195 Hazel Dr · Headland, AL
Flood risk 1/10 · Minimal
- FEMA flood zone
- X (unshaded)
- Chance of flooding over 30 yrs
- 0.0%
- Est. flood insurance / yr
- $507 – $1,088
Fire risk 4/10 · Minor
- Est. fire insurance / yr
- $916 – $1,700
Heat risk 8/10 · Major
- Hot days now (above 108°F)
- 7 days/yr
- Hot days in 30 yrs
- 19 days/yr
Wind risk 8/10 · Major
- Chance of severe wind over 30 yrs
- 99.0%
Air-quality risk 2/10 · Minimal
- Unhealthy air days now
- 1 days/yr
- Unhealthy air days in 30 yrs
- 2 days/yr
Risk factors via First Street. Map © Google.
Why this score? — see what drove the D+ grade
The composite is a weighted blend of 9 inputs, each scored 0–100. Each bar is that input's sub-score; the figure is the points it added to the 100-point composite (weight × sub-score).
- Cash flow +20.7/30.0
- DSCR +6.6/10.0
- 1% rule +5.5/10.0
- Livability +3.3/5.0
- Schools +2.8/10.0
- Rent growth +2.5/5.0
- Condition / age +2.5/5.0
- ARV discount +1.5/15.0
- Appreciation +0.0/10.0
$179,900
🖨 Deal sheet 📄 Offer letter ✓ Due diligence
Listing remarks MLS
11-30-2023 - Seller Accepted an offer, just waiting on complete contract package to be executed. Seller will pay up to 3% closing costs with an accepted offer! Large 3 bedroom, 2 bath mobile home with living room, dining room, den, split bedroom plan, large primary bedroom with walk in closet and a flex space for a office, a nursery, a place to workout or even a reading nook. Primary bath with large tub, double sinks and separate shower. Large walk in laundry room leads out back to the covered deck with built in seating to enjoy the large back yard. Off the living room are sliding glass patio doors that also lead to a covered front deck, perfect for pulling into the large 2 car garage and being able to unload the car and getting to the front door without having to be outside in the weather. Property is owned by the US Dept. of HUD; Case #011-779097; FHA Financing: IE(Insured Escrow); 203K Eligible: Yes; Subject to Appraisal, Seller makes no representations or warranties as to property condition. Sold As Is.
Key facts
- 0.49 acre lot
- 2 garage spots
- Built 1999
Property features AI
Exterior
- Parking: Attached 2-car garage; Two covered parking spaces (total 2 spaces)
- Utilities: Public water; Septic tank; Cable available
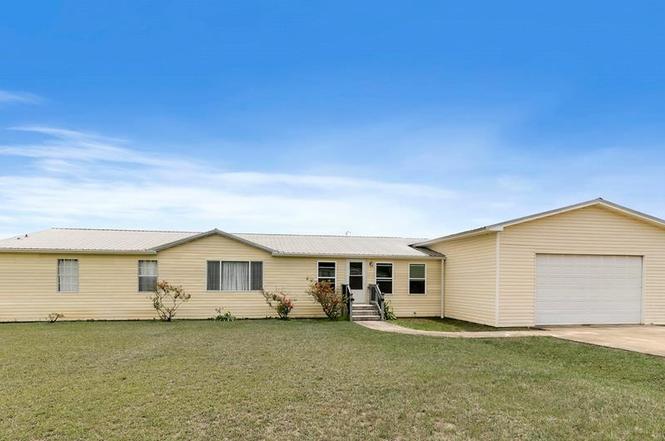
- Home design: Manufactured (modular) residential home
- Construction: Vinyl siding
- Exterior features: Deck; Waterfront location
Interior
- Kitchen: Dishwasher; Microwave; Oven; Range; Range hood; Refrigerator; Electric water heater
- Flooring: Vinyl
- Bathrooms: Two full bathrooms
- Interior features: Ceiling fans; Window treatments
- Laundry & utility: Washer; Dryer; Laundry inside
Neighborhood map
What this means for you Summary
Snapshot
- This is a 4-bed/2.0-bath manufactured listed at $180k.
Deal economics
- At list price, monthly cash flow is $243 ($3k/yr) — positive.
- The deal already cash-flows at list — no discount required.
- Meets the 1% rule at list price ($2k rent vs $180k).
- Cap rate 7.9% vs local median 3.8% in Headland — top-decile yield for the area; either an underpriced asset or a hidden risk that comps aren't pricing in. Stress-test before assuming the spread holds.
Location & tenants
- Location reads 66/100 on livability (#101 in AL) — a middle-class / working-renter tenant base. Strengths: cost of living A+, housing A+, crime B+; Watch: health & safety D, amenities F, commute F.
- Henry County (rural): math 21% / reading 45% proficiency, ranked #55 of 129 in AL (top 43%) — families likely to look elsewhere, expect single-tenant / working-renter base with shorter leases.
- Zoned schools: Headland Elementary School (math 39% / reading 59%, grade D, #132 of 627 statewide, top 21%, 858 students, 48% FRL); Headland Middle School (math 16% / reading 58%, grade F, #73 of 257 statewide, top 29%, 576 students, 47% FRL); Headland High School (math 17% / reading 27%, grade F, #142 of 305 statewide, top 51%, 412 students, 49% FRL).
- Market conditions: 172 active listings in the ZIP; 2 comparable units currently listed for rent nearby; 71 units permitted in Henry County in 2024 (0 in 5+ unit buildings).
Forward outlook
- Local home prices are declining (-3.0%/yr); year-one equity from $1k of loan paydown is wiped out by about $5k of value loss. Plan a longer hold.
- Henry County population projected to shrink 8% by 2050 — rents likely to lag national; underwrite the cash flow, not the appreciation.
Negotiation context
- Only 5 days on market — expect competitive offers; lowballing is unlikely to land.
- 4 sale attempts since 13y ago with the ask held roughly flat each time — persistent listings suggest the price (not the market) is what's stuck; bring a comps-based counter.
- Current owner paid $85k; list at $180k implies a 111% gain — meaningful room to come down on a strong offer.
Risks & watch-outs
- Climate carrying-cost: severe wind risk, 99% chance of damaging wind over 30y; extreme-heat days projected 7→19/yr by 2055 (HVAC capex compounding) — expect insurance premiums to compound above CPI over the hold.
Questions for the listing agent
- Is there a deadline driving the sale (1031 exchange, divorce, estate, relocation)? That informs how much negotiation room exists.
- Schools are D-rated, which usually means shorter tenancies and higher turnover. Who's the typical renter profile here, and what's been the actual vacancy rate?
- The area grade is low — what's the realistic commute time and amenity access for the typical tenant pool here? Any planned neighborhood developments (good or bad) we should know about?
- What's the average days-on-market for RENTAL listings here right now (not sales)? A rising rental-DOM trend means longer vacancies and softer asking-rent achievability than the comps imply.
- What's the recent tenant-quality profile in this submarket — average credit score on applications, eviction rate, late-payment / NSF rate, and stable-employment percentage? A property-management company in the area should have these aggregated.
- How much new for-sale + rental construction is in the pipeline within 1–3 miles? Heavy new supply typically softens prices + rents 12–24 months out; constrained supply supports both.
Investment metrics
- 1% rule
- 1.05% ✓
- Cap rate
- 7.91%
- Cash-on-cash
- 5.78%
- DSCR
- 1.26
- GRM
- 8.0
CMA / ARV
- ARV (on-the-fly)
- $158,614
- Comps found
- 3
Show comp detail 3 sales within ~0.75 mi
| Address | Dist | Beds/Ba | Sqft | Sold | Price | $/sf | Match |
|---|---|---|---|---|---|---|---|
| 200 Apricot Dr | 0.08mi | 3/2.0 (-1) | 1,920 (-14%) | 5mo | $162,000 | $84 | 63 |
| 465 Bradford Cir | 0.13mi | 3/2.0 (-1) | 2,048 (-8%) | 14mo | $144,500 | $71 | 63 |
| 465 Bradford Cir | 0.13mi | 3/2.0 (-1) | 2,048 (-8%) | 14mo | $144,500 | $71 | 63 |
Match score weights: distance 35% · size 25% · config 20% · recency 20%. Top-matched comps best support the ARV.
Projected returns pro-forma
-3.0% appreciation · 3.0% rent growth · sell at horizon
- IRR
- -7.3%
- Equity multiple
- 0.73×
- Total profit
- $-13,658
- Equity at exit
- $26,824
- IRR
- 2.3%
- Equity multiple
- 1.16×
- Total profit
- $8,137
- Equity at exit
- $15,554
Cash invested: $50,372 (down + closing). Projections, not guarantees.
Landlord ↔ Tenant lean methodology
- Overall (STATE)
- 90 Strongly Landlord-Friendly
- State Alabama
- 90 Strongly Landlord-Friendly · R+15
- County
- — inherits STATE
- City
- — inherits STATE
ZIP-level market 36345
- Home prices YoY
- -16.0%
- Active inventory
- 172
- Price-to-rent
- 8.0×
Monthly cashflow live
- Estimated rent
- $1,881 medium interval (Pro) →
- Mortgage (P&I)
- −$943
- Tax est. 1.5%
- −$225 /mo · $2,698/yr
- Insurance
- −$75
- HOA
- −$0
- Vacancy / Maint / Mgmt
- −$395
- Net cashflow
- $243
Break-even live
UW: 25.0% down · 7.5% · 30yr · 1.5% tax · 5.0% vac · 8.0% maint · 8.0% mgmt
Financing live
Cash to close
- Down payment
- $44,975
- Closing costs
- $5,397
- Reserves months
- —
- Total cash needed
- —
Loan-product check · same deal, 3 products live
Conventional
25% down · 7.5% · 30yr
- Down + closing
- —
- Monthly P&I
- —
- Monthly cashflow
- —
- DSCR
- —
- Eligible?
- —
Personal DTI + credit; lowest rate.
DSCR
20% down · 8.5% · 30yr
- Down + closing
- —
- Monthly P&I
- —
- Monthly cashflow
- —
- DSCR
- —
- Eligible?
- —
No personal income docs; deal must DSCR.
Hard money
10% down · 12.0% · 12mo
- Down + closing
- —
- Monthly P&I
- —
- Monthly cashflow
- —
- DSCR
- —
- Eligible?
- —
Short-term bridge; refi at stabilization.
Rent comps 2 comps
| Address | Beds | Baths | Sqft | Rent | $/sqft | DOM | Units | Dist |
|---|---|---|---|---|---|---|---|---|
| 121 Tanglewood Dr Headland, AL | 3.0 | 2.0 | 1624 | $1,800 | $1.11 | 43d | 1 | 0.81mi |
| 124 Tanglewood Dr Headland, AL | 3.0 | 2.0 | 1487 | $1,975 | $1.33 | 43d | 1 | 0.86mi |
Listing history 6 events
-
2026-06-19days on market $179,900 Active 5 DOM
-
2026-06-18days on market $179,900 Active 4 DOM
-
2026-06-17days on market $179,900 Active 3 DOM
-
2026-06-16days on market $179,900 Active 2 DOM
-
2026-06-16remarks 699-char remark
-
2026-06-15$179,900 Active 1 DOM
ⓘ Source: listings_history table (triggers on properties + properties_extension) + one-shot
backfill from property_details.listing_events for pre-trigger history.
Climate risk First Street
- Flood 1/10 Low FEMA zone X (unshaded) · 0% chance over 30 yrs
- Wildfire 4/10 Moderate
- Heat 8/10 Severe 7 d/yr ≥108°F today · 19 d/yr by 30 yrs out
- Wind 8/10 Severe 99% chance of damaging wind over 30 yrs
- Air quality 2/10 Low 1 unhealthy d/yr today · 2 by 30 yrs out
Nearby sold comps map
Loading sold comps map…
Walkable amenities ~0.75 mi
Loading nearby amenities…
Taxation est. · year 1
- Rental income
- $22,573
- − Mortgage interest
- −$10,077
- − Property taxes
- −$2,698
- − Insurance
- −$900
- − Repairs & maintenance
- −$1,806
- − Management
- −$1,806
- − Depreciation
- −$5,233
- Taxable income
- $53
- Est. tax owed @ 24.0%
- −$13
- After-tax cash flow
- $2,901/yr
For passive investors: Depreciation is non-cash, so a rental often shows a tax loss while cash-flowing — sheltering income. Rental losses are passive: they offset passive income freely, and up to $25,000/yr can offset ordinary (W-2) income if you actively participate and your MAGI is under $100k (phasing out to $0 by $150k); unused losses carry forward. On sale, claimed depreciation is recaptured at up to 25%, and gains may owe capital-gains tax (a 1031 exchange can defer both). Figures are a year-1 estimate at your 24.0% rate — not tax advice; consult a CPA.
Schools (NCES district)
- District
- Henry County
- NCES district ID
- 0101740
- Math proficiency
- 21% ▼ -15.00%
- Reading proficiency
- 45% ▲ 3.00%
- Median HH income
- $41,502
- Composite
- 27.78/100
- National rank
- #6894
- State rank
- #55 of 129 in AL
Livability — Headland
- Score
- 66/100
- State rank
- #101
- US rank
- #11540
Category grades
Schools grade is shown separately in the Schools card above.
Census & demographics
- City population
- 8,838
- Population (ZIP)
- 8,838
Population outlook (Henry County) Hauer SSP2
- Today (2025)
- 17,109 people
- By 2030
- 16,928 · -1.1%
- By 2040
- 16,376 · -4.3%
- By 2050
- 15,778 · -7.8%
- By 2075
- 14,491 · -15.3%
- By 2100
- 12,673 · -25.9%
Race, ethnicity, and origin ACS 2023
- Neighborhood character
- Predominantly White (79%)
- Race & ethnicity
- White 79% Black 16% Two or more races 2% Hispanic / Latino 2% Asian 1%
- Common ancestry
- Slovak 2% Iranian 1% Romanian 1%
- Foreign-born
- 1% · Vietnam
Political lean MEDSL · Henry
- 2024 margin
- Solid R (+50.8) · D 24.3% · R 75.1%
- 2008→2024 swing
- -21.1pp toward R · 2008: -29.7pp · 2024: -50.8pp
- All cycles
- 2024: R+50.8 2020: R+43.0 2016: R+41.6 2012: R+29.4 2008: R+29.7
Not yet ingested
- Civics
- —
Market trends
- HPI YoY
- ▼ -40.45%
- Current HPI
- 213.0749
- Rent YoY
- —
- Metro
- —
- State GDP YoY
- ▲ 2.94%
- F500 in state
- 4
Industry mix (Fortune 500 HQ in AL)
| Industry | F500 HQs | Revenue |
|---|---|---|
| Financial Services | 1 | $8B |
|
||
| Healthcare | 1 | $5B |
|
||
Price history
+227.7% since first listed7 events — show timeline
- 2026-06-14 Listed $179,900 SAMLS
- 2023-12-22 Sold (MLS) $85,099 SAMLS
- 2023-12-01 Contingent — SAMLS
- 2023-10-20 Listed $88,000 SAMLS
- 2013-10-29 Sold (Public Records) $43,000 Public Records
- 2013-05-30 Listed $54,900 MAAR
- 2013-05-30 Listed $54,900 WBR
Property tax history
+11.5%/yrLatest (2025): $249 · -32.6% YoY. Source: county tax records.
Cash-flow waterfall
monthlySold comps — $/sqft
last 12 mo · ≤1 miLoading sold comps…