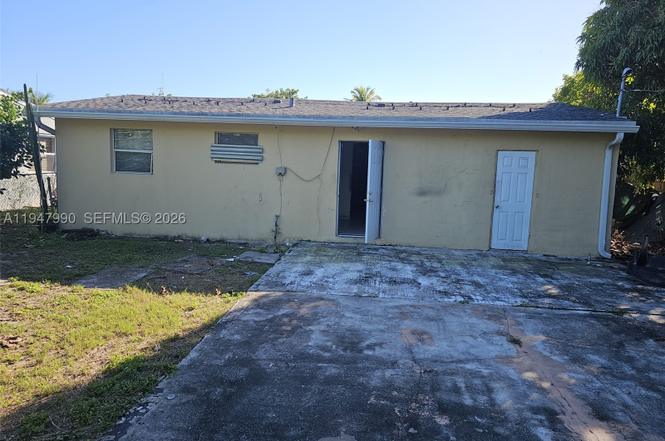
2243 Mayo St · Hollywood, FL
Flood risk 5/10 · Moderate
- FEMA flood zone
- AH
- Chance of flooding over 30 yrs
- 0.24%
- Est. flood insurance / yr
- $1,142 – $2,507
Fire risk 1/10 · Minimal
- Est. fire insurance / yr
- $947 – $1,759
Heat risk 10/10 · Severe
- Hot days now (above 105°F)
- 7 days/yr
- Hot days in 30 yrs
- 27 days/yr
Wind risk 10/10 · Severe
- Chance of severe wind over 30 yrs
- 99.0%
Air-quality risk 2/10 · Minimal
- Unhealthy air days now
- 2 days/yr
- Unhealthy air days in 30 yrs
- 2 days/yr
Risk factors via First Street. Map © Google.
Why this score? — see what drove the B- grade
The composite is a weighted blend of 9 inputs, each scored 0–100. Each bar is that input's sub-score; the figure is the points it added to the 100-point composite (weight × sub-score).
- Cash flow +22.1/30.0
- ARV discount +15.0/15.0
- 1% rule +8.2/10.0
- DSCR +7.1/10.0
- Schools +4.1/10.0
- Livability +3.8/5.0
- Rent growth +2.6/5.0
- Condition / age +2.5/5.0
- Appreciation +0.0/10.0
$236,000
🖨 Deal sheet (PDF) 📄 Offer letter ✓ Due diligence
Listing remarks
Handyman Special!!!
Key facts
- 7,217 sq ft lot
- Parking
- Built 1955
Neighborhood map
What this means for you Summary
Snapshot
- This is a 3-bed/1.0-bath single-family listed at $236k.
Deal economics
- At list price, monthly cash flow is $228 ($3k/yr) — positive.
- The deal already cash-flows at list — no discount required.
- Meets the 1% rule at list price ($3k rent vs $236k).
- Cap rate 8.2% vs local median 3.2% in Hollywood — top-decile yield for the area; either an underpriced asset or a hidden risk that comps aren't pricing in. Stress-test before assuming the spread holds.
Location & tenants
- Location reads 76/100 on livability (#232 in FL, #3,548 nationally) — a middle-class / working-renter tenant base. Strengths: commute A+, housing A+, crime B+; Watch: amenities D.
- Broward (suburban): math 42% / reading 53% proficiency, ranked #46 of 73 in FL (top 63%) — families likely to look elsewhere, expect single-tenant / working-renter base with shorter leases.
- Market conditions: Rents flat; 589 active listings in the ZIP; 32 comparable units currently listed for rent nearby; rentals at typical pace (median 16d on market — plan ~3-4 weeks tenant-placement turnaround); 2,111 units permitted in Broward County in 2024 (1,265 in 5+ unit buildings).
- At $3,114/mo this rent would consume 66% of the median local household income ($56k/yr) (locally 3948% of renters already pay >50% of income on rent) — very limited rent-growth headroom before tenants either downsize or default.
Forward outlook
- Local home prices are declining (-3.0%/yr); year-one equity from $2k of loan paydown is wiped out by about $7k of value loss. Plan a longer hold.
- Broward County population projected at +34% by 2050 — long-run rental-demand tailwind backs the buy-and-hold thesis.
Negotiation context
- Only 1 days on market — expect competitive offers; lowballing is unlikely to land.
Risks & watch-outs
- Watch-outs: property tax is 3.8% of price; flood insurance adds $152/mo; built in 1955 — expect roof / HVAC / electrical / plumbing capex.
- Climate carrying-cost: in FEMA flood zone AH (mandatory federal flood insurance); severe wind risk, 99% chance of damaging wind over 30y; extreme-heat days projected 7→27/yr by 2055 (HVAC capex compounding) — expect insurance premiums to compound above CPI over the hold.
Questions for the listing agent
- Built in 1955 — when were the roof, HVAC, electrical panel, plumbing, and water heater last replaced?
- Property tax is high relative to price — has the assessment been appealed recently, and will the sale trigger a re-assessment?
- What's the actual annual flood-insurance premium (NFIP or private), and is the property in a SFHA with mandatory coverage?
- Is there a deadline driving the sale (1031 exchange, divorce, estate, relocation)? That informs how much negotiation room exists.
- What's the average days-on-market for RENTAL listings here right now (not sales)? A rising rental-DOM trend means longer vacancies and softer asking-rent achievability than the comps imply.
- What's the recent tenant-quality profile in this submarket — average credit score on applications, eviction rate, late-payment / NSF rate, and stable-employment percentage? A property-management company in the area should have these aggregated.
- How much new for-sale + rental construction is in the pipeline within 1–3 miles? Heavy new supply typically softens prices + rents 12–24 months out; constrained supply supports both.
Investment metrics
- 1% rule
- 1.32% ✓
- Cap rate
- 8.22%
- Cash-on-cash
- 6.90%
- DSCR
- 1.31
- GRM
- 6.3
CMA / ARV
- ARV (on-the-fly)
- $416,160
- Comps found
- 5
Show comp detail 5 sales within ~0.75 mi
| Address | Dist | Beds/Ba | Sqft | Sold | Price | $/sf | Match |
|---|---|---|---|---|---|---|---|
| 1426 S 22nd Ave | 0.11mi | 3/2.0 | 954 (+10%) | 18mo | $450,000 | $472 | 59 |
| 1004 S 24th Ter | 0.40mi | 2/1.0 (-1) | 862 (-1%) | 22mo | $429,000 | $498 | 57 |
| 2451 Washington St | 0.47mi | 2/1.0 (-1) | 937 (+8%) | 7mo | $450,000 | $480 | 54 |
| 2114 Wiley Ct | 0.20mi | 2/1.0 (-1) | 775 (-11%) | 23mo | $380,000 | $490 | 49 |
| 1904 Mayo St | 0.47mi | 2/2.0 (-1) | 989 (+14%) | 13mo | $449,000 | $454 | 35 |
Match score weights: distance 35% · size 25% · config 20% · recency 20%. Top-matched comps best support the ARV.
Projected returns pro-forma
-3.0% appreciation · 0.43% rent growth · sell at horizon
- IRR
- -13.6%
- Equity multiple
- 0.53×
- Total profit
- $-31,164
- Equity at exit
- $35,188
- IRR
- -11.1%
- Equity multiple
- 0.43×
- Total profit
- $-37,354
- Equity at exit
- $20,405
Cash invested: $66,080 (down + closing). Projections, not guarantees.
Landlord ↔ Tenant lean methodology
- Overall (STATE)
- 87 Strongly Landlord-Friendly
- State Florida
- 87 Strongly Landlord-Friendly · R+3
- County
- — inherits STATE
- City
- — inherits STATE
ZIP-level market 33020
- Rents YoY
- 0.4%
- Active inventory
- 589
- Price-to-rent
- 6.3×
Monthly cashflow live
- Estimated rent
- $3,114 high interval (Pro) →
- Mortgage (P&I)
- −$1,238
- Tax from tax record
- −$744 /mo · $8,926/yr
- Insurance
- −$98
- Flood insurance flood zone
- −$152 /mo · $1,824/yr
- HOA
- −$0
- Vacancy / Maint / Mgmt
- −$654
- Net cashflow
- $228
Break-even live
Sensitivity live
| Price | -10% $361 | -5% $295 | +0% $228 | +5% $161 | +10% $94 |
|---|---|---|---|---|---|
| Rent | -10% $-18 | -5% $105 | +0% $228 | +5% $351 | +10% $474 |
| Rate | -1.0pp $347 | -0.5pp $288 | base $228 | +0.5pp $167 | +1.0pp $104 |
UW: 25.0% down · 7.5% · 30yr · 1.5% tax · 5.0% vac · 8.0% maint · 8.0% mgmt
Financing live
Cash to close
- Down payment
- $59,000
- Closing costs
- $7,080
- Reserves months
- —
- Total cash needed
- —
Loan-product check · same deal, 3 products live
Conventional
25% down · 7.5% · 30yr
- Down + closing
- —
- Monthly P&I
- —
- Monthly cashflow
- —
- DSCR
- —
- Eligible?
- —
Personal DTI + credit; lowest rate.
DSCR
20% down · 8.5% · 30yr
- Down + closing
- —
- Monthly P&I
- —
- Monthly cashflow
- —
- DSCR
- —
- Eligible?
- —
No personal income docs; deal must DSCR.
Hard money
10% down · 12.0% · 12mo
- Down + closing
- —
- Monthly P&I
- —
- Monthly cashflow
- —
- DSCR
- —
- Eligible?
- —
Short-term bridge; refi at stabilization.
Rent comps 32 comps
| Address | Beds | Baths | Sqft | Rent | $/sqft | DOM | Units | Dist |
|---|---|---|---|---|---|---|---|---|
| 200 E Pembroke Rd Hallandale Beach, FL | 3.0 | 1.0–2.0 | 1006 | $4,120 | $4.10 | 2d | 62 | 0.33mi |
| 832 NW 10th St Unit 1 Hallandale Beach, FL | 2.0 | 1.0 | 800 | $1,800 | $2.25 | 24d | 1 | 0.56mi |
| 2750 Washington St Hollywood, FL | 2.0 | 1.0 | 1053 | $3,500 | $3.32 | 15d | 1 | 0.77mi |
| 2750 Washington St Hollywood, FL | 2.0 | 1.0 | 1053 | $3,300 | $3.13 | 3d | 1 | 0.77mi |
| 401 N Federal Hwy Hallandale Beach, FL | 1.0–3.0 | 1.0–2.0 | 973 | $3,638 | $3.74 | 15d | 48 | 0.78mi |
| 1046 Foster Rd Hallandale Beach, FL | 2.0 | 1.0 | 750 | $1,795 | $2.39 | 8d | 1 | 0.80mi |
| 2001 Van Buren St Hollywood, FL | 2.0 | 1.0–2.0 | 788 | $3,599 | $4.57 | 15d | 171 | 0.86mi |
| 2165 Van Buren St Hollywood, FL | 3.0 | 1.0–3.0 | 1072 | $4,420 | $4.12 | 2d | 14 | 0.87mi |
| 2917 Plunkett St Unit 15C Hollywood, FL | 2.0 | 1.0 | 900 | $1,950 | $2.17 | 8d | 1 | 0.88mi |
| 906 NE 6th St Hallandale Beach, FL | 3.0 | 2.0 | 1080 | $4,250 | $3.94 | 24d | 1 | 0.89mi |
| 906 NE 6th St Hallandale Beach, FL | 3.0 | 2.0 | 1080 | $4,250 | $3.94 | 5d | 1 | 0.89mi |
| 906 NE 6th St Hallandale Beach, FL | 3.0 | 2.0 | 1080 | $4,250 | $3.94 | 12d | 1 | 0.89mi |
| 320 S Federal Hwy Hollywood, FL | 2.0 | 1.0–2.0 | 742 | $3,616 | $4.87 | 24d | 9 | 0.93mi |
| 2233 Hollywood Blvd Hollywood, FL | 1.0–2.0 | 1.0–2.0 | 913 | $3,515 | $3.85 | 15d | 94 | 0.93mi |
| 303 S Federal Hwy Hollywood, FL | 1.0–3.0 | 1.0–3.0 | 992 | $3,690 | $3.72 | 3d | 35 | 0.97mi |
| 1818 Hollywood Blvd Hollywood, FL | 3.0 | 1.0–2.5 | 1089 | $5,506 | $5.06 | 2d | 17 | 1.01mi |
| 1770 S Young Cir Hollywood, FL | 2.0 | 1.0–2.0 | 881 | $4,768 | $5.41 | 2d | 42 | 1.01mi |
| 829 SW 1st St Hallandale Beach, FL | 2.0 | 2.0 | 850 | $1,985 | $2.34 | 24d | 1 | 1.09mi |
| 2918 Jackson St Unit 1 Hollywood, FL | 2.0 | 1.0 | 750 | $1,700 | $2.27 | 8d | 1 | 1.10mi |
| 2918 Jackson St Hollywood, FL | 2.0 | 1.0 | 750 | $1,700 | $2.27 | 4d | 1 | 1.10mi |
| 90 SW 3rd St Unit 2400 Hallandale Beach, FL | 2.0 | 2.0 | 1079 | $3,700 | $3.43 | 24d | 1 | 1.13mi |
| 220 SW 9th Ave #516 Hallandale Beach, FL | 2.0 | 2.0 | 918 | $2,200 | $2.40 | 24d | 1 | 1.16mi |
| 220 SW 9th Ave Hallandale Beach, FL | 1.0–2.0 | 1.0–2.0 | 771 | $2,200 | $2.85 | 21d | 2 | 1.18mi |
| 1776 Polk St Hollywood, FL | 1.0–2.0 | 1.0–2.0 | 954 | $3,598 | $3.77 | 15d | 25 | 1.21mi |
| 2806 Taylor St Apt C Hollywood, FL | 2.0 | 2.0 | 650 | $2,295 | $3.53 | 24d | 1 | 1.28mi |
| 2806 Taylor St Apt C Hollywood, FL | 2.0 | 2.0 | 650 | $2,295 | $3.53 | 8d | 1 | 1.28mi |
| 1056 SW 2nd St Unit 1056 Hallandale Beach, FL | 3.0 | 2.0 | 1000 | $3,300 | $3.30 | 24d | 1 | 1.28mi |
| 215 SE 5th St Hallandale Beach, FL | 2.0–3.0 | 2.0 | 1133 | $3,675 | $3.24 | 24d | 5 | 1.28mi |
| 1033 SW 3rd St Hallandale Beach, FL | 2.0 | 1.0 | 875 | $2,800 | $3.20 | 24d | 1 | 1.32mi |
| 1180 E Hallandale Beach Blvd Unit 1241877P Hallandale Beach, FL | 1.0–2.0 | 1.0–2.0 | 844 | $5,453 | $6.46 | 4d | 2 | 1.36mi |
| 2843 Fillmore St Hollywood, FL | 1.0–2.0 | 1.0 | 800 | $2,095 | $2.62 | 24d | 1 | 1.46mi |
| 2910 Pierce St Unit F106 Hollywood, FL | 2.0 | 1.0 | 850 | $1,975 | $2.32 | 2d | 1 | 1.47mi |
Listing history 5 events
-
2026-01-19status Pending
-
2025-12-20$236,000 Active
-
2021-01-29soldstatus $244,500
-
2004-04-08soldstatus $55,000
-
1969-10-01soldstatus $13,500
ⓘ Source: listings_history table (triggers on properties + properties_extension) + one-shot
backfill from property_details.listing_events for pre-trigger history.
Tax reassessment forecast FL · Resets to sale price
- Current annual tax
- $8,926 · $744/mo
- Projected year-2 tax
- $8,926 · $744/mo
- Expected delta
- $0/yr ($0/mo · 0.0%)
ⓘ Screening estimate from a state-policy table — verify with the county assessor before closing.
Climate risk First Street
- Flood 5/10 Major FEMA zone AH · 24% chance over 30 yrs
- Wildfire 1/10 Low
- Heat 10/10 Extreme 7 d/yr ≥105°F today · 27 d/yr by 30 yrs out
- Wind 10/10 Extreme 99% chance of damaging wind over 30 yrs
- Air quality 2/10 Low 2 unhealthy d/yr today · 2 by 30 yrs out
Nearby sold comps map
Loading sold comps map…
Walkable amenities ~0.75 mi
Loading nearby amenities…
Taxation est. · year 1
- Rental income
- $37,362
- − Mortgage interest
- −$13,220
- − Property taxes
- −$8,926
- − Insurance
- −$3,004
- − Repairs & maintenance
- −$2,989
- − Management
- −$2,989
- − Depreciation
- −$6,865
- Taxable loss
- −$631
- Est. tax savings @ 24.0%
- +$152
- After-tax cash flow
- $2,886/yr
For passive investors: Depreciation is non-cash, so a rental often shows a tax loss while cash-flowing — sheltering income. Rental losses are passive: they offset passive income freely, and up to $25,000/yr can offset ordinary (W-2) income if you actively participate and your MAGI is under $100k (phasing out to $0 by $150k); unused losses carry forward. On sale, claimed depreciation is recaptured at up to 25%, and gains may owe capital-gains tax (a 1031 exchange can defer both). Figures are a year-1 estimate at your 24.0% rate — not tax advice; consult a CPA.
Schools (NCES district)
- District
- Broward
- NCES district ID
- 1200180
- Math proficiency
- 42% ▼ -18.00%
- Reading proficiency
- 53% ▼ -5.00%
- Median HH income
- $52,139
- Composite
- 40.88/100
- National rank
- #3621
- State rank
- #46 of 73 in FL
Livability — Hollywood
- Score
- 76/100
- State rank
- #232
- US rank
- #3548
Category grades
Schools grade is shown separately in the Schools card above.
Census & demographics
- Census place
- Hollywood, FL
- County
- Broward County · 1,963,430 people
- City population
- 109,079
- Metro
- Miami-Fort Lauderdale-Pompano Beach, FL
- Population (ZIP)
- 46,322
- Household income
- $56,473
- Rent vs Own
- Severe rent burden
- 3948.0
Population outlook (Broward County) Hauer SSP2
- Today (2025)
- 2,207,033 people
- By 2030
- 2,360,704 · +7.0%
- By 2040
- 2,661,208 · +20.6%
- By 2050
- 2,946,698 · +33.5%
- By 2075
- 3,602,273 · +63.2%
- By 2100
- 3,970,984 · +79.9%
Race, ethnicity, and origin ACS 2023
- Neighborhood character
- Diverse neighborhood (Simpson 0.68)
- Race & ethnicity
- Hispanic / Latino 43% Two or more races 31% White 28% Black 24% Asian 1%
- Hispanic origin (detail)
- Mexican 1% Puerto Rican 4% Cuban 9% Dominican 3% Salvadoran 3%
- Common ancestry
- Hispanic 5% Lithuanian 2% Scotch-Irish 1%
- Foreign-born
- 41% · Canada, Jamaica, Dominican Republic
- Languages at home
- 48% English-only · Spanish 38% French/Haitian/Cajun 6% Russian/Polish/Slavic 2%
Political lean MEDSL · Broward
- 2024 margin
- D (+17.0) · D 58.0% · R 41.0%
- 2008→2024 swing
- -17.8pp toward R · 2008: 34.7pp · 2024: 17.0pp
- All cycles
- 2024: D+17.0 2020: D+29.8 2016: D+35.0 2012: D+34.9 2008: D+34.7
Not yet ingested
- Civics
- —
Market trends
- HPI YoY
- ▼ -406.34%
- Current HPI
- 524.7664
- Rent YoY
- ▲ 0.43%
- Metro
- Miami-Fort Lauderdale-Pompano Beach, FL
- State GDP YoY
- ▲ 3.28%
- F500 in state
- 36
Industry mix (Fortune 500 HQ in FL)
| Industry | F500 HQs | Revenue |
|---|---|---|
| Industrial Technology | 2 | $29B |
|
||
| Insurance | 2 | $17B |
|
||
| Retail | 1 | $60B |
|
||
| Technology Distribution | 1 | $58B |
|
||
| Homebuilding | 1 | $35B |
|
||
| Technology Manufacturing | 1 | $35B |
|
||
Price history
+1648.1% since first listed5 events — show timeline
- 2026-01-19 Pending — MARMLS
- 2025-12-20 Listed $236,000 MARMLS
- 2021-01-29 Sold (Public Records) $244,500 Public Records
- 2004-04-08 Sold (Public Records) $55,000 Public Records
- 1969-10-01 Sold (Public Records) $13,500 Public Records
Property tax history
+12.6%/yrLatest (2025): $8,926 · +20.9% YoY. Source: county tax records.
Cash-flow waterfall
monthlySold comps — $/sqft
last 12 mo · ≤1 miLoading sold comps…