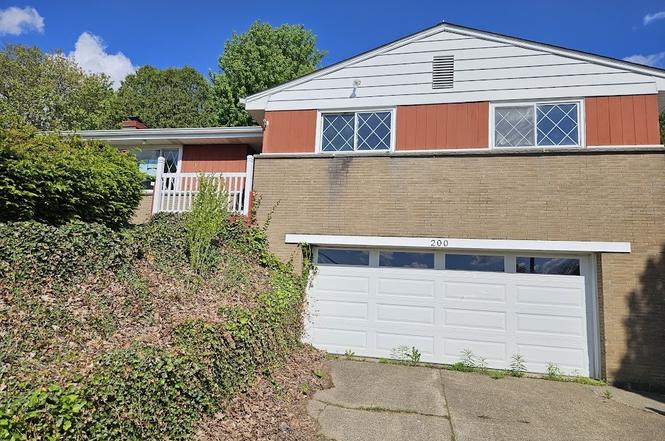
200 Lookout Dr · North Fayette, PA
Flood risk 1/10 · Minimal
- FEMA flood zone
- X (unshaded)
- Chance of flooding over 30 yrs
- 0.0%
- Est. flood insurance / yr
- $473 – $860
Fire risk 1/10 · Minimal
- Est. fire insurance / yr
- $511 – $949
Heat risk 3/10 · Minor
- Hot days now (above 97°F)
- 7 days/yr
- Hot days in 30 yrs
- 17 days/yr
Wind risk 2/10 · Minimal
- Chance of severe wind over 30 yrs
- 0.0%
Air-quality risk 2/10 · Minimal
- Unhealthy air days now
- 1 days/yr
- Unhealthy air days in 30 yrs
- 2 days/yr
Risk factors via First Street. Map © Google.
Why this score? — see what drove the C+ grade
The composite is a weighted blend of 9 inputs, each scored 0–100. Each bar is that input's sub-score; the figure is the points it added to the 100-point composite (weight × sub-score).
- Cash flow +20.0/30.0
- ARV discount +15.0/15.0
- DSCR +6.3/10.0
- Schools +6.1/10.0
- 1% rule +5.9/10.0
- Rent growth +2.5/5.0
- Livability +2.5/5.0
- Condition / age +2.5/5.0
- Appreciation +0.0/10.0
$150,000
🖨 Deal sheet 📄 Offer letter ✓ Due diligence
Listing remarks MLS
Nice sized 3 bedroom, 2.5 bath ranch home with loads of potential. Quiet neighborhood in West Allegheny School District. Private yard, hardwood floors, 2 car garage, shed, tons of storage and a great location! Roof, furnace, A/C, hot water tank and garage door all replaced in the last 9 years. Close to Pittsburgh airport and Robinson.
Key facts
- Outdoor living area
- Large yard
- Ranch style home
Tags
Property features AI
Exterior
- Parking: Attached garage
- Utilities: Public water; Public sewer
- Home design: Single-story home
- Exterior features: Resale property
Interior
- Flooring: Carpet; Hardwood
- Bathrooms: Two full bathrooms; One half bathroom
- Heating & cooling: Gas heating; Central air conditioning
- Interior features: Basement
Neighborhood map
What this means for you Summary
Snapshot
- This is a 3-bed/2.5-bath single-family listed at $150k.
Deal economics
- At list price, monthly cash flow is $183 ($2k/yr) — positive.
- The deal already cash-flows at list — no discount required.
- Meets the 1% rule at list price ($2k rent vs $150k).
Location & tenants
- Location reads: area grade C — affects rentability + tenant quality, not the cash-flow math above.
- West Allegheny SD (suburban): math 64% / reading 77% proficiency, ranked #22 of 539 in PA (top 4%) — strong family-tenant draw, lease renewals of 3-5y typical; only 18% free/reduced lunch — higher-income household profile.
- Market conditions: 66 active listings in the ZIP; 4 comparable units currently listed for rent nearby; rentals leasing fast (median 7d on market — plan ~1-2 weeks tenant-placement turnaround); 2,996 units permitted in Allegheny County in 2024 (1,588 in 5+ unit buildings).
Forward outlook
- Local home prices are declining (-3.0%/yr); year-one equity from $1k of loan paydown is wiped out by about $4k of value loss. Plan a longer hold.
Negotiation context
- Only 4 days on market — expect competitive offers; lowballing is unlikely to land.
- 2 sale attempts since 3y ago with the ask held roughly flat each time — persistent listings suggest the price (not the market) is what's stuck; bring a comps-based counter.
Questions for the listing agent
- Built in 1960 — when were the roof, HVAC, electrical panel, plumbing, and water heater last replaced?
- Is there a deadline driving the sale (1031 exchange, divorce, estate, relocation)? That informs how much negotiation room exists.
- What's the average days-on-market for RENTAL listings here right now (not sales)? A rising rental-DOM trend means longer vacancies and softer asking-rent achievability than the comps imply.
- What's the recent tenant-quality profile in this submarket — average credit score on applications, eviction rate, late-payment / NSF rate, and stable-employment percentage? A property-management company in the area should have these aggregated.
- How much new for-sale + rental construction is in the pipeline within 1–3 miles? Heavy new supply typically softens prices + rents 12–24 months out; constrained supply supports both.
Investment metrics
- 1% rule
- 1.09% ✓
- Cap rate
- 7.76%
- Cash-on-cash
- 5.23%
- DSCR
- 1.23
- GRM
- 7.6
CMA / ARV
- ARV (on-the-fly)
- $282,528
- Comps found
- 10
Show comp detail 10 sales within ~0.75 mi
| Address | Dist | Beds/Ba | Sqft | Sold | Price | $/sf | Match |
|---|---|---|---|---|---|---|---|
| 334 Florida Dr | 0.08mi | 3/2.0 | 1,335 (+2%) | 4mo | $296,000 | $222 | 88 |
| 427 Carolina Dr | 0.17mi | 3/2.0 | 1,379 (+5%) | 1mo | $298,500 | $216 | 80 |
| 100 Mayer Dr | 0.20mi | 3/1.0 | 1,260 (-4%) | 0mo | $250,500 | $199 | 78 |
| 7672 Steubenville Pike | 0.57mi | 3/2.0 | 1,310 (+0%) | 4mo | $218,500 | $167 | 68 |
| 401 Florida Dr | 0.09mi | 3/2.0 | 1,400 (+7%) | 17mo | $220,000 | $157 | 68 |
| 306 Virginia Dr | 0.19mi | 3/2.0 | 1,482 (+13%) | 4mo | $330,000 | $223 | 64 |
| 326 Florida Dr | 0.08mi | 3/1.5 | 1,125 (-14%) | 10mo | $262,500 | $233 | 60 |
| 511 Hankey Farms Dr | 0.48mi | 3/1.0 | 1,263 (-3%) | 20mo | $259,900 | $206 | 49 |
| 339 Lutz Rd | 0.47mi | 2/2.0 (-1) | 1,429 (+9%) | 20mo | $505,000 | $353 | 39 |
| 10 Albert Ln | 0.57mi | 3/1.0 | 1,456 (+11%) | 15mo | $195,000 | $134 | 36 |
Match score weights: distance 35% · size 25% · config 20% · recency 20%. Top-matched comps best support the ARV.
Projected returns pro-forma
-3.0% appreciation · 3.0% rent growth · sell at horizon
- IRR
- -8.1%
- Equity multiple
- 0.70×
- Total profit
- $-12,576
- Equity at exit
- $22,365
- IRR
- 1.5%
- Equity multiple
- 1.10×
- Total profit
- $4,350
- Equity at exit
- $12,969
Cash invested: $42,000 (down + closing). Projections, not guarantees.
Landlord ↔ Tenant lean methodology
- Overall (STATE)
- 62 Landlord-Friendly
- State Pennsylvania
- 62 Landlord-Friendly · EVEN
- County
- — inherits STATE
- City
- — inherits STATE
ZIP-level market 15071
- Home prices YoY
- -21.2%
- Active inventory
- 66
- Price-to-rent
- 7.6×
Monthly cashflow live
- Estimated rent
- $1,638 medium interval (Pro) →
- Mortgage (P&I)
- −$787
- Tax from tax record
- −$262 /mo · $3,142/yr
- Insurance
- −$62
- HOA
- −$0
- Vacancy / Maint / Mgmt
- −$344
- Net cashflow
- $183
Break-even live
UW: 25.0% down · 7.5% · 30yr · 1.5% tax · 5.0% vac · 8.0% maint · 8.0% mgmt
Financing live
Cash to close
- Down payment
- $37,500
- Closing costs
- $4,500
- Reserves months
- —
- Total cash needed
- —
Loan-product check · same deal, 3 products live
Conventional
25% down · 7.5% · 30yr
- Down + closing
- —
- Monthly P&I
- —
- Monthly cashflow
- —
- DSCR
- —
- Eligible?
- —
Personal DTI + credit; lowest rate.
DSCR
20% down · 8.5% · 30yr
- Down + closing
- —
- Monthly P&I
- —
- Monthly cashflow
- —
- DSCR
- —
- Eligible?
- —
No personal income docs; deal must DSCR.
Hard money
10% down · 12.0% · 12mo
- Down + closing
- —
- Monthly P&I
- —
- Monthly cashflow
- —
- DSCR
- —
- Eligible?
- —
Short-term bridge; refi at stabilization.
Rent comps 4 comps
| Address | Beds | Baths | Sqft | Rent | $/sqft | DOM | Units | Dist |
|---|---|---|---|---|---|---|---|---|
| 1600 Settlers Dr Oakdale, PA | 1.0–2.0 | 1.0 | 769 | $1,645 | $2.14 | 1d | 23 | 0.53mi |
| 1101 Timberglen Dr Imperial, PA | 3.0 | 2.0 | 1310 | $1,800 | $1.37 | 7d | 1 | 0.72mi |
| 27412 Evergreen Run Unit 27412 Imperial, PA | 2.0 | 1.0 | 1000 | $1,150 | $1.15 | 23d | 1 | 0.87mi |
| 100 Lincoln Highlands Dr Coraopolis, PA | 1.0–3.0 | 1.0–2.0 | 988 | $1,935 | $1.96 | 1d | 13 | 1.15mi |
Listing history 5 events
-
2026-06-18days on market $150,000 Active 4 DOM
-
2026-06-17days on market $150,000 Active 3 DOM
-
2026-06-16days on market $150,000 Active 2 DOM
-
2026-06-15remarks 699-char remark
-
2026-06-15$150,000 Active 1 DOM
ⓘ Source: listings_history table (triggers on properties + properties_extension) + one-shot
backfill from property_details.listing_events for pre-trigger history.
Tax reassessment forecast PA · Partial reset (capped growth)
- Current annual tax
- $3,142 · $262/mo
- Projected year-2 tax
- $3,142 · $262/mo
- Expected delta
- $0/yr ($0/mo · 0.0%)
ⓘ Screening estimate from a state-policy table — verify with the county assessor before closing.
Climate risk First Street
- Flood 1/10 Low FEMA zone X (unshaded) · 0% chance over 30 yrs
- Wildfire 1/10 Low
- Heat 3/10 Moderate 7 d/yr ≥97°F today · 17 d/yr by 30 yrs out
- Wind 2/10 Low 0% chance of damaging wind over 30 yrs
- Air quality 2/10 Low 1 unhealthy d/yr today · 2 by 30 yrs out
Nearby sold comps map
Loading sold comps map…
Walkable amenities ~0.75 mi
Loading nearby amenities…
Taxation est. · year 1
- Rental income
- $19,656
- − Mortgage interest
- −$8,402
- − Property taxes
- −$3,142
- − Insurance
- −$750
- − Repairs & maintenance
- −$1,572
- − Management
- −$1,572
- − Depreciation
- −$4,364
- Taxable loss
- −$147
- Est. tax savings @ 24.0%
- +$35
- After-tax cash flow
- $2,232/yr
For passive investors: Depreciation is non-cash, so a rental often shows a tax loss while cash-flowing — sheltering income. Rental losses are passive: they offset passive income freely, and up to $25,000/yr can offset ordinary (W-2) income if you actively participate and your MAGI is under $100k (phasing out to $0 by $150k); unused losses carry forward. On sale, claimed depreciation is recaptured at up to 25%, and gains may owe capital-gains tax (a 1031 exchange can defer both). Figures are a year-1 estimate at your 24.0% rate — not tax advice; consult a CPA.
Schools (NCES district)
- District
- West Allegheny SD
- NCES district ID
- 4225200
- Math proficiency
- 64% ▼ -5.00%
- Reading proficiency
- 77% ▼ -3.00%
- Median HH income
- $67,549
- Composite
- 61.41/100
- National rank
- #763
- State rank
- #22 of 539 in PA
Livability — North Fayette
No livability data for this city. (Only ~50 U.S. cities are tracked.)
Census & demographics
- Population (ZIP)
- 12,455
Population outlook (Allegheny County) Hauer SSP2
- Today (2025)
- 1,250,282 people
- By 2030
- 1,256,482 · +0.5%
- By 2040
- 1,256,318 · +0.5%
- By 2050
- 1,244,169 · -0.5%
- By 2075
- 1,197,693 · -4.2%
- By 2100
- 1,093,187 · -12.6%
Race, ethnicity, and origin ACS 2023
- Neighborhood character
- Predominantly White (84%)
- Race & ethnicity
- White 84% Two or more races 8% Asian 4% Black 3% Hispanic / Latino 3%
- Common ancestry
- Romanian 10% Scotch-Irish 3% Slovak 2%
- Foreign-born
- 5% · Canada
- Languages at home
- 93% English-only · Other Asian/Pacific 3% Other Indo-European 1% Spanish 1%
Political lean MEDSL · Allegheny
- 2024 margin
- Strong D (+20.3) · D 59.7% · R 39.4%
- 2008→2024 swing
- +4.8pp toward D · 2008: 15.5pp · 2024: 20.3pp
- All cycles
- 2024: D+20.3 2020: D+20.4 2016: D+16.4 2012: D+14.4 2008: D+15.5
Not yet ingested
- Civics
- —
Market trends
- HPI YoY
- ▼ -71.90%
- Current HPI
- 266.6786
- Rent YoY
- —
- Metro
- —
- State GDP YoY
- ▲ 1.68%
- F500 in state
- 34
Industry mix (Fortune 500 HQ in PA)
| Industry | F500 HQs | Revenue |
|---|---|---|
| Healthcare | 2 | $309B |
|
||
| Insurance | 2 | $27B |
|
||
| Telecommunications / Media | 1 | $124B |
|
||
| Industrial Distribution | 1 | $22B |
|
||
| Financial Services | 1 | $20B |
|
||
| Chemicals / Materials | 1 | $18B |
|
||
Price history
-48.3% since first listed4 events — show timeline
- 2026-06-14 Listed $150,000 West Penn MLS
- 2023-09-06 Price Changed $269,900 West Penn MLS
- 2023-08-13 Price Changed $278,000 West Penn MLS
- 2023-08-01 Listed $290,000 West Penn MLS
Property tax history
+0.4%/yrLatest (2026): $3,142 · +0.0% YoY. Source: county tax records.
Cash-flow waterfall
monthlySold comps — $/sqft
last 12 mo · ≤1 miLoading sold comps…