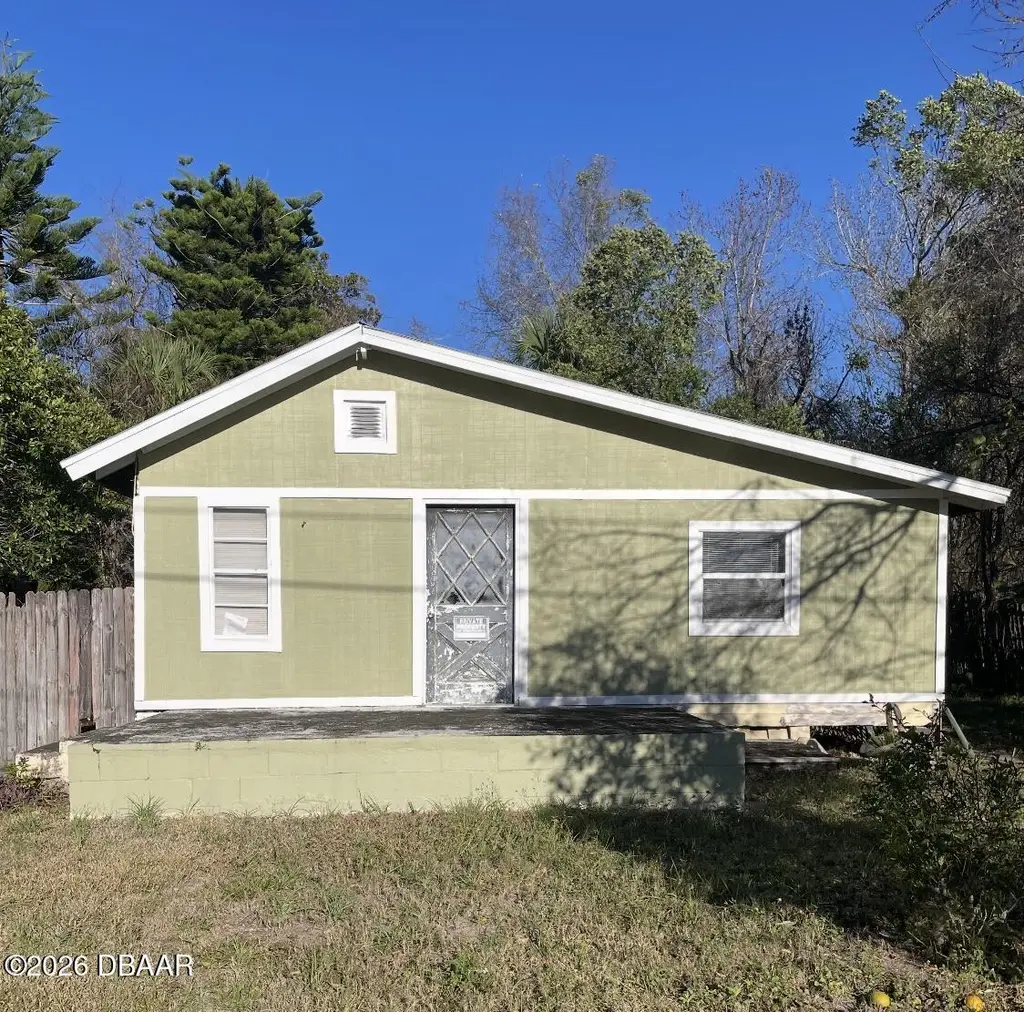
1921 Duval Pl · Daytona Beach, FL
Flood risk 1/10 · Minimal
- FEMA flood zone
- X (unshaded)
- Chance of flooding over 30 yrs
- 0.0%
- Est. flood insurance / yr
- $507 – $1,088
Fire risk 2/10 · Minimal
- Est. fire insurance / yr
- $947 – $1,759
Heat risk 9/10 · Severe
- Hot days now (above 105°F)
- 7 days/yr
- Hot days in 30 yrs
- 19 days/yr
Wind risk 10/10 · Severe
- Chance of severe wind over 30 yrs
- 99.0%
Air-quality risk 2/10 · Minimal
- Unhealthy air days now
- 2 days/yr
- Unhealthy air days in 30 yrs
- 2 days/yr
Risk factors via First Street. Map © Google.
Why this score? — see what drove the B- grade
The composite is a weighted blend of 9 inputs, each scored 0–100. Each bar is that input's sub-score; the figure is the points it added to the 100-point composite (weight × sub-score).
- Cash flow +29.0/30.0
- DSCR +10.0/10.0
- 1% rule +8.8/10.0
- ARV discount +7.5/15.0
- Livability +4.2/5.0
- Schools +3.9/10.0
- Condition / age +2.5/5.0
- Rent growth +2.0/5.0
- Appreciation +0.0/10.0
$105,000
🖨 Deal sheet 📄 Offer letter ✓ Due diligence
Listing remarks MLS
HIGH AND DRY!! This is a fixer upper in quiet neighborhood with lots of possibilities! CASH only but you can remodel or tear down and build your own home with no HOA! No utilities are on at this property. This is an ASIS property.
Key facts
- 6,534 sq ft lot
- Built 1953
- Listed 38 days
Neighborhood map
What this means for you Summary
Snapshot
- This is a 2-bed/1.0-bath single-family listed at $105k.
Deal economics
- At list price, monthly cash flow is $361 ($4k/yr) — positive.
- The deal already cash-flows at list — no discount required.
- Meets the 1% rule at list price ($1k rent vs $105k).
- Recommended offer: $102k (3.0% below list) — sets the bar for market timing.
Location & tenants
- Location reads 83/100 on livability (#46 in FL, #867 nationally) — a professional / high-income tenant draw. Strengths: amenities A+, commute A+, cost of living A+; Watch: schools D+, employment D-.
- Volusia (suburban): math 44% / reading 49% proficiency, ranked #47 of 73 in FL (top 64%) — families likely to look elsewhere, expect single-tenant / working-renter base with shorter leases.
- Market conditions: Rents soft (-2.0%/yr); 280 active listings in the ZIP; 12 comparable units currently listed for rent nearby; rentals at typical pace (median 15d on market — plan ~3-4 weeks tenant-placement turnaround); 3,402 units permitted in Volusia County in 2024 (681 in 5+ unit buildings).
- This rent runs 31% of the median local income ($57k/yr) — at the standard rent-burdened threshold; future hikes will face affordability resistance.
Forward outlook
- Local home prices are declining (-3.0%/yr); year-one equity from $726 of loan paydown is wiped out by about $3k of value loss. Plan a longer hold.
- Volusia County population projected at +19% by 2050 — long-run rental-demand tailwind backs the buy-and-hold thesis.
Negotiation context
- It's been on market 38 days — a 3% lower offer ($102k) is reasonable based on typical stale-listing flexibility.
- 3 sale attempts; this cycle's ask is 10% above the opening price — seller raised mid-cycle; expect resistance to lowballs.
- Current owner paid $9k; list at $105k implies a 1059% gain — meaningful room to come down on a strong offer.
Risks & watch-outs
- Watch-outs: built in 1953 — expect roof / HVAC / electrical / plumbing capex.
- Climate carrying-cost: severe wind risk, 99% chance of damaging wind over 30y; extreme-heat days projected 7→19/yr by 2055 (HVAC capex compounding) — expect insurance premiums to compound above CPI over the hold.
Questions for the listing agent
- It's been on market 38 days. Have you received any prior offers? Is the seller open to a 3% concession, seller financing, or rate buy-down credit?
- Built in 1953 — when were the roof, HVAC, electrical panel, plumbing, and water heater last replaced?
- Is there a deadline driving the sale (1031 exchange, divorce, estate, relocation)? That informs how much negotiation room exists.
- Schools are D-rated, which usually means shorter tenancies and higher turnover. Who's the typical renter profile here, and what's been the actual vacancy rate?
- What's the average days-on-market for RENTAL listings here right now (not sales)? A rising rental-DOM trend means longer vacancies and softer asking-rent achievability than the comps imply.
- What's the recent tenant-quality profile in this submarket — average credit score on applications, eviction rate, late-payment / NSF rate, and stable-employment percentage? A property-management company in the area should have these aggregated.
- How much new for-sale + rental construction is in the pipeline within 1–3 miles? Heavy new supply typically softens prices + rents 12–24 months out; constrained supply supports both.
Investment metrics
- 1% rule
- 1.38% ✓
- Cap rate
- 10.41%
- Cash-on-cash
- 14.72%
- DSCR
- 1.65
- GRM
- 6.0
CMA / ARV
No comps found within radius.
Projected returns pro-forma
-3.0% appreciation · 0.0% rent growth · sell at horizon
- IRR
- 1.6%
- Equity multiple
- 1.06×
- Total profit
- $1,767
- Equity at exit
- $15,656
- IRR
- 7.8%
- Equity multiple
- 1.51×
- Total profit
- $14,952
- Equity at exit
- $9,078
Cash invested: $29,400 (down + closing). Projections, not guarantees.
Landlord ↔ Tenant lean methodology
- Overall (STATE)
- 87 Strongly Landlord-Friendly
- State Florida
- 87 Strongly Landlord-Friendly · R+3
- County
- — inherits STATE
- City
- — inherits STATE
ZIP-level market 32119
- Rents YoY
- -2.0%
- Active inventory
- 280
- Price-to-rent
- 6.0×
Monthly cashflow live
- Estimated rent
- $1,447 high interval (Pro) →
- Mortgage (P&I)
- −$551
- Tax from tax record
- −$188 /mo · $2,259/yr
- Insurance
- −$44
- HOA
- −$0
- Vacancy / Maint / Mgmt
- −$304
- Net cashflow
- $361
Break-even live
UW: 25.0% down · 7.5% · 30yr · 1.5% tax · 5.0% vac · 8.0% maint · 8.0% mgmt
Financing live
Cash to close
- Down payment
- $26,250
- Closing costs
- $3,150
- Reserves months
- —
- Total cash needed
- —
Loan-product check · same deal, 3 products live
Conventional
25% down · 7.5% · 30yr
- Down + closing
- —
- Monthly P&I
- —
- Monthly cashflow
- —
- DSCR
- —
- Eligible?
- —
Personal DTI + credit; lowest rate.
DSCR
20% down · 8.5% · 30yr
- Down + closing
- —
- Monthly P&I
- —
- Monthly cashflow
- —
- DSCR
- —
- Eligible?
- —
No personal income docs; deal must DSCR.
Hard money
10% down · 12.0% · 12mo
- Down + closing
- —
- Monthly P&I
- —
- Monthly cashflow
- —
- DSCR
- —
- Eligible?
- —
Short-term bridge; refi at stabilization.
Rent comps 12 comps
| Address | Beds | Baths | Sqft | Rent | $/sqft | DOM | Units | Dist |
|---|---|---|---|---|---|---|---|---|
| 1017 June Ter Lot 6 Daytona Beach, FL | 2.0 | 1.0 | 700 | $1,350 | $1.93 | 23d | 1 | 0.41mi |
| 1756 S Clyde Morris Blvd Daytona Beach, FL | 1.0–2.0 | 1.0–2.0 | 850 | $1,650 | $1.94 | 23d | 8 | 0.61mi |
| 1200 Floral Springs Blvd Port Orange, FL | 1.0–3.0 | 1.0–2.0 | 1047 | $1,780 | $1.70 | 11d | 81 | 0.81mi |
| 1401 S Clyde Morris Blvd Daytona Beach, FL | 1.0 | 1.0 | 576 | $1,272 | $2.21 | 23d | 5 | 0.85mi |
| 1400 Hancock Blvd Daytona Beach, FL | 1.0–2.0 | 1.0–2.0 | 800 | $1,483 | $1.85 | 11d | 11 | 0.90mi |
| 132 Forest Lake Blvd Daytona Beach, FL | 1.0–2.0 | 1.0–2.0 | 706 | $1,421 | $2.01 | 14d | 13 | 0.91mi |
| 1600 Big Tree Rd South Daytona, FL | 1.0 | 1.0 | 630 | $1,225 | $1.94 | 23d | 3 | 0.94mi |
| 1420 New Bellevue Ave Daytona Beach, FL | 1.0–2.0 | 1.0–2.0 | 800 | $1,554 | $1.94 | 11d | 9 | 1.00mi |
| 1270 Reed Canal Rd Port Orange, FL | 1.0–3.0 | 1.0–2.0 | 1001 | $1,746 | $1.74 | 11d | 29 | 1.01mi |
| 1220 S Nova Rd Daytona Beach, FL | 1.0 | 1.0 | 576 | $955 | $1.66 | 11d | 11 | 1.15mi |
| 1401 Reed Canal Rd Port Orange, FL | 1.0–3.0 | 1.0–2.0 | 1045 | $1,856 | $1.78 | 14d | 25 | 1.16mi |
| 886 S Nova Rd Daytona Beach, FL | 1.0–2.0 | 1.0 | 685 | $1,260 | $1.84 | 11d | 10 | 1.43mi |
Listing history 24 events
-
2026-06-18days on market $105,000 Active 38 DOM
-
2026-06-17days on market $105,000 Active 37 DOM
-
2026-06-16days on market $105,000 Active 36 DOM
-
2026-06-15days on market $105,000 Active 35 DOM
-
2026-06-14pricedays on market $105,000 Active 33 DOM
-
2026-06-10days on market $109,200 Active 30 DOM
-
2026-06-09days on market $109,200 Active 29 DOM
-
2026-06-08days on market $109,200 Active 28 DOM
-
2026-06-07days on market $109,200 Active 27 DOM
-
2026-06-05days on market $109,200 Active 24 DOM
-
2026-06-03days on market $109,200 Active 23 DOM
-
2026-06-03days on market $109,200 Active 22 DOM
-
2026-06-01days on market $109,200 Active 21 DOM
-
2026-05-31days on market $109,200 Active 20 DOM
-
2026-05-31days on market $109,200 Active 19 DOM
-
2026-05-15price $109,200 230-char remark
Show marketing remark (230 chars)
HIGH AND DRY!! This is a fixer upper in quiet neighborhood with lots of possibilities! CASH only but you can remodel or tear down and build your own home with no HOA! No utilities are on at this property. This is an ASIS property.
-
2026-05-11status Active 230-char remark
Show marketing remark (230 chars)
HIGH AND DRY!! This is a fixer upper in quiet neighborhood with lots of possibilities! CASH only but you can remodel or tear down and build your own home with no HOA! No utilities are on at this property. This is an ASIS property.
-
2026-03-05status Active 230-char remark
Show marketing remark (230 chars)
HIGH AND DRY!! This is a fixer upper in quiet neighborhood with lots of possibilities! CASH only but you can remodel or tear down and build your own home with no HOA! No utilities are on at this property. This is an ASIS property.
-
2026-01-24status Pending 230-char remark
Show marketing remark (230 chars)
HIGH AND DRY!! This is a fixer upper in quiet neighborhood with lots of possibilities! CASH only but you can remodel or tear down and build your own home with no HOA! No utilities are on at this property. This is an ASIS property.
-
2026-01-24historical 230-char remark
Show marketing remark (230 chars)
HIGH AND DRY!! This is a fixer upper in quiet neighborhood with lots of possibilities! CASH only but you can remodel or tear down and build your own home with no HOA! No utilities are on at this property. This is an ASIS property.
-
2026-01-24price $119,200 230-char remark
Show marketing remark (230 chars)
HIGH AND DRY!! This is a fixer upper in quiet neighborhood with lots of possibilities! CASH only but you can remodel or tear down and build your own home with no HOA! No utilities are on at this property. This is an ASIS property.
-
2026-01-22$95,200 Active 230-char remark
Show marketing remark (230 chars)
HIGH AND DRY!! This is a fixer upper in quiet neighborhood with lots of possibilities! CASH only but you can remodel or tear down and build your own home with no HOA! No utilities are on at this property. This is an ASIS property.
-
1979-01-01soldstatus $9,058
-
1970-03-01soldstatus $5,000
ⓘ Source: listings_history table (triggers on properties + properties_extension) + one-shot
backfill from property_details.listing_events for pre-trigger history.
Tax reassessment forecast FL · Resets to sale price
- Current annual tax
- $2,259 · $188/mo
- Projected year-2 tax
- $2,259 · $188/mo
- Expected delta
- $0/yr ($0/mo · 0.0%)
ⓘ Screening estimate from a state-policy table — verify with the county assessor before closing.
Climate risk First Street
- Flood 1/10 Low FEMA zone X (unshaded) · 0% chance over 30 yrs
- Wildfire 2/10 Low
- Heat 9/10 Extreme 7 d/yr ≥105°F today · 19 d/yr by 30 yrs out
- Wind 10/10 Extreme 99% chance of damaging wind over 30 yrs
- Air quality 2/10 Low 2 unhealthy d/yr today · 2 by 30 yrs out
Nearby sold comps map
Loading sold comps map…
Walkable amenities ~0.75 mi
Loading nearby amenities…
Taxation est. · year 1
- Rental income
- $17,365
- − Mortgage interest
- −$5,882
- − Property taxes
- −$2,259
- − Insurance
- −$525
- − Repairs & maintenance
- −$1,389
- − Management
- −$1,389
- − Depreciation
- −$3,055
- Taxable income
- $2,867
- Est. tax owed @ 24.0%
- −$688
- After-tax cash flow
- $3,639/yr
For passive investors: Depreciation is non-cash, so a rental often shows a tax loss while cash-flowing — sheltering income. Rental losses are passive: they offset passive income freely, and up to $25,000/yr can offset ordinary (W-2) income if you actively participate and your MAGI is under $100k (phasing out to $0 by $150k); unused losses carry forward. On sale, claimed depreciation is recaptured at up to 25%, and gains may owe capital-gains tax (a 1031 exchange can defer both). Figures are a year-1 estimate at your 24.0% rate — not tax advice; consult a CPA.
Schools (NCES district)
- District
- Volusia
- NCES district ID
- 1201920
- Math proficiency
- 44% ▼ -9.00%
- Reading proficiency
- 49% ▼ -3.00%
- Median HH income
- $42,946
- Composite
- 39.2/100
- National rank
- #4019
- State rank
- #47 of 73 in FL
Livability — Daytona Beach
- Score
- 83/100
- State rank
- #46
- US rank
- #867
Category grades
Schools grade is shown separately in the Schools card above.
Census & demographics
- County
- Volusia County · 556,871 people
- City population
- 67,539
- Metro
- Deltona-Daytona Beach-Ormond Beach, FL
- Population (ZIP)
- 22,348
- Household income
- $56,862
- Rent vs Own
- Severe rent burden
- 1158.0
Population outlook (Volusia County) Hauer SSP2
- Today (2025)
- 572,749 people
- By 2030
- 598,695 · +4.5%
- By 2040
- 644,880 · +12.6%
- By 2050
- 681,451 · +19.0%
- By 2075
- 759,957 · +32.7%
- By 2100
- 778,902 · +36.0%
Race, ethnicity, and origin ACS 2023
- Neighborhood character
- Predominantly White (75%)
- Race & ethnicity
- White 75% Black 10% Hispanic / Latino 9% Two or more races 5% Asian 2%
- Hispanic origin (detail)
- Puerto Rican 4%
- Common ancestry
- Lithuanian 2% Slovak 2% Romanian 2%
- Foreign-born
- 9% · Canada, South Korea, Jamaica
- Languages at home
- 87% English-only · Spanish 7% Other Indo-European 2% German/W. Germanic 1%
Political lean MEDSL · Volusia
- 2024 margin
- Strong R (+21.8) · D 38.7% · R 60.5%
- 2008→2024 swing
- -27.4pp toward R · 2008: 5.7pp · 2024: -21.8pp
- All cycles
- 2024: R+21.8 2020: R+14.1 2016: R+13.1 2012: R+1.2 2008: D+5.7
Not yet ingested
- Civics
- —
Market trends
- HPI YoY
- ▼ -247.99%
- Current HPI
- 309.304
- Rent YoY
- ▼ -2.01%
- Metro
- Deltona-Daytona Beach-Ormond Beach, FL
- State GDP YoY
- ▲ 3.28%
- F500 in state
- 36
Industry mix (Fortune 500 HQ in FL)
| Industry | F500 HQs | Revenue |
|---|---|---|
| Industrial Technology | 2 | $29B |
|
||
| Insurance | 2 | $17B |
|
||
| Retail | 1 | $60B |
|
||
| Technology Distribution | 1 | $58B |
|
||
| Homebuilding | 1 | $35B |
|
||
| Technology Manufacturing | 1 | $35B |
|
||
Price history
+2084.0% since first listed9 events — show timeline
- 2026-05-15 Price Changed $109,200 Daytona MLS
- 2026-05-11 Relisted — Daytona MLS
- 2026-03-05 Relisted — Daytona MLS
- 2026-01-24 Pending — Daytona MLS
- 2026-01-24 Price Changed $119,200 Daytona MLS
- 2026-01-24 Listing Removed — Daytona MLS
- 2026-01-22 Listed $95,200 Daytona MLS
- 1979-01-01 Sold (Public Records) $9,058 Public Records
- 1970-03-01 Sold (Public Records) $5,000 Public Records
Property tax history
+19.2%/yrLatest (2025): $2,259 · +8.1% YoY. Source: county tax records.
Cash-flow waterfall
monthlySold comps — $/sqft
last 12 mo · ≤1 miLoading sold comps…