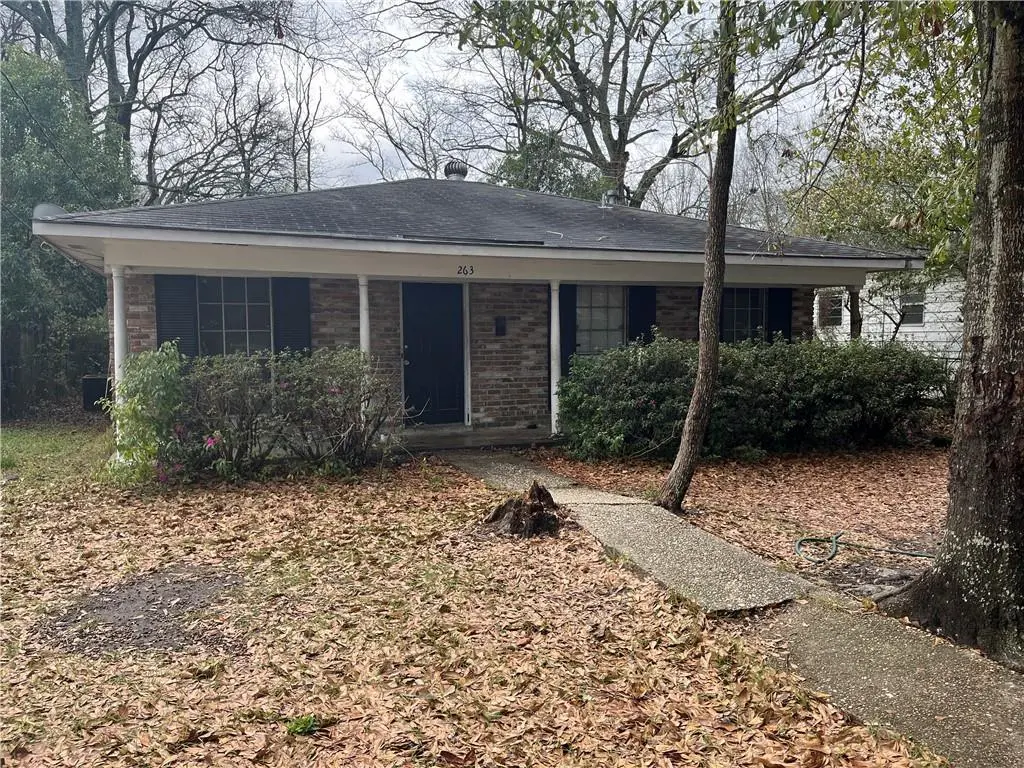
263 9th Ave · Chickasaw, AL
Flood risk 1/10 · Minimal
- FEMA flood zone
- X (unshaded)
- Chance of flooding over 30 yrs
- 0.0%
- Est. flood insurance / yr
- $507 – $1,088
Fire risk 3/10 · Minor
- Est. fire insurance / yr
- $916 – $1,700
Heat risk 9/10 · Severe
- Hot days now (above 104°F)
- 7 days/yr
- Hot days in 30 yrs
- 21 days/yr
Wind risk 9/10 · Severe
- Chance of severe wind over 30 yrs
- 99.0%
Air-quality risk 2/10 · Minimal
- Unhealthy air days now
- 1 days/yr
- Unhealthy air days in 30 yrs
- 2 days/yr
Risk factors via First Street. Map © Google.
Why this score? — see what drove the B+ grade
The composite is a weighted blend of 9 inputs, each scored 0–100. Each bar is that input's sub-score; the figure is the points it added to the 100-point composite (weight × sub-score).
- Cash flow +29.8/30.0
- DSCR +10.0/10.0
- Appreciation +10.0/10.0
- 1% rule +7.7/10.0
- ARV discount +7.5/15.0
- Schools +5.0/10.0
- Livability +3.1/5.0
- Rent growth +2.5/5.0
- Condition / age +2.5/5.0
$84,900
🖨 Deal sheet 📄 Offer letter ✓ Due diligence
Listing remarks MLS
Step into cash flow! This 3 bed / 1 bath house is perfect for a landlord! It's a full brick house on slab foundation. This property is under the affordable housing program that is 100% subsidized at a rate of $1,050 / month. House has central heating and air.
Key facts
- Slab foundation
- Full brick house
- 0.25 acre lot
Tags
Neighborhood map
What this means for you Summary
Snapshot
- This is a 3-bed/1.0-bath single-family listed at $85k.
Deal economics
- At list price, monthly cash flow is $311 ($4k/yr) — positive.
- The deal already cash-flows at list — no discount required.
- Meets the 1% rule at list price ($1k rent vs $85k).
- Recommended offer: $84k (1.5% below list) — sets the bar for market timing.
- Cap rate 10.7% vs local median 7.2% in Chickasaw — top-decile yield for the area; either an underpriced asset or a hidden risk that comps aren't pricing in. Stress-test before assuming the spread holds.
Location & tenants
- Location reads 61/100 on livability (#237 in AL) — a middle-class / working-renter tenant base. Strengths: cost of living A+, housing A-, health & safety B; Watch: schools F, crime D-, amenities F.
- Market conditions: 45 active listings in the ZIP; 7 comparable units currently listed for rent nearby; rentals leasing fast (median 14d on market — plan ~1-2 weeks tenant-placement turnaround); 1,678 units permitted in Mobile County in 2024 (264 in 5+ unit buildings).
Forward outlook
- In year one you build about $9k of equity ($587 loan paydown + $8k appreciation (10.0% local appreciation)).
- Mobile County population projected to shrink 8% by 2050 — rents likely to lag national; underwrite the cash flow, not the appreciation.
- At projected returns (10.0% appreciation + 3.0% rent growth), your $24k cash investment doubles in ~2 years — after that, you're playing with house money.
- By year 4, paydown + projected appreciation supports a ~$32k cash-out refi (75% LTV) — recoverable capital for the next deal without selling this one.
Negotiation context
- It's been on market 19 days — a 2% lower offer ($84k) is reasonable based on typical stale-listing flexibility.
- 2 sale attempts with the ask held roughly flat each time — persistent listings suggest the price (not the market) is what's stuck; bring a comps-based counter.
- Current owner paid $55k; list at $85k implies a 54% gain — meaningful room to come down on a strong offer.
Risks & watch-outs
- Climate carrying-cost: severe wind risk, 99% chance of damaging wind over 30y; extreme-heat days projected 7→21/yr by 2055 (HVAC capex compounding) — expect insurance premiums to compound above CPI over the hold.
Questions for the listing agent
- Is there a deadline driving the sale (1031 exchange, divorce, estate, relocation)? That informs how much negotiation room exists.
- Schools are F-rated, which usually means shorter tenancies and higher turnover. Who's the typical renter profile here, and what's been the actual vacancy rate?
- Crime grade is D in this area — have there been break-ins, vandalism, or insurance claims at this property in the last 3 years? What carrier currently insures it and at what premium?
- What's the average days-on-market for RENTAL listings here right now (not sales)? A rising rental-DOM trend means longer vacancies and softer asking-rent achievability than the comps imply.
- What's the recent tenant-quality profile in this submarket — average credit score on applications, eviction rate, late-payment / NSF rate, and stable-employment percentage? A property-management company in the area should have these aggregated.
- How much new for-sale + rental construction is in the pipeline within 1–3 miles? Heavy new supply typically softens prices + rents 12–24 months out; constrained supply supports both.
Investment metrics
- 1% rule
- 1.27% ✓
- Cap rate
- 10.68%
- Cash-on-cash
- 15.68%
- DSCR
- 1.70
- GRM
- 6.6
CMA / ARV
- ARV (median comp)
- $84,810
- List price
- $84,900
- Delta
- 0.11%
- Verdict
- FAIR
- Comps
- 20 within 1.0 mi
Show comp detail 12 sales within ~0.75 mi
| Address | Dist | Beds/Ba | Sqft | Sold | Price | $/sf | Match |
|---|---|---|---|---|---|---|---|
| 263 9th Ave | 0.00mi | 3/1.0 | 1,329 (0%) | 0mo | $75,000 | $56 | 100 |
| 154 Chieftain Way | 0.27mi | 3/1.0 | 1,286 (-3%) | 1mo | $78,000 | $61 | 81 |
| 305 11th Ave | 0.15mi | 3/2.0 | 1,152 (-13%) | 1mo | $65,000 | $56 | 66 |
| 315 4th Ave | 0.42mi | 3/2.0 | 1,369 (+3%) | 10mo | $129,000 | $94 | 64 |
| 305 5th Ave | 0.34mi | 3/1.0 | 1,232 (-7%) | 11mo | $60,000 | $49 | 62 |
| 310 8th Ave | 0.12mi | 2/2.0 (-1) | 1,160 (-13%) | 10mo | $76,500 | $66 | 56 |
| 206 5th St | 0.62mi | 2/1.0 (-1) | 1,376 (+4%) | 8mo | $53,500 | $39 | 53 |
| 254 4th Ave | 0.44mi | 3/2.0 | 1,456 (+10%) | 8mo | $209,000 | $144 | 53 |
| 516 Lee St W | 0.72mi | 3/1.5 | 1,271 (-4%) | 11mo | $145,000 | $114 | 48 |
| 94 DIAMOND St | 0.54mi | 3/2.0 | 1,215 (-9%) | 12mo | $168,000 | $138 | 47 |
| 346 Fall Ave | 0.60mi | 3/1.5 | 1,144 (-14%) | 1mo | $42,000 | $37 | 46 |
| 513 Holiday Ave | 0.73mi | 3/2.0 | 1,458 (+10%) | 1mo | $170,000 | $117 | 45 |
Match score weights: distance 35% · size 25% · config 20% · recency 20%. Top-matched comps best support the ARV.
Projected returns pro-forma
10.0% appreciation · 3.0% rent growth · sell at horizon
- IRR
- 35.9%
- Equity multiple
- 3.78×
- Total profit
- $66,015
- Equity at exit
- $76,485
- IRR
- 30.9%
- Equity multiple
- 8.52×
- Total profit
- $178,813
- Equity at exit
- $164,942
Cash invested: $23,772 (down + closing). Projections, not guarantees.
Landlord ↔ Tenant lean methodology
- Overall (STATE)
- 90 Strongly Landlord-Friendly
- State Alabama
- 90 Strongly Landlord-Friendly · R+15
- County
- — inherits STATE
- City
- — inherits STATE
ZIP-level market 36611
- Home prices YoY
- 7.0%
- Active inventory
- 45
- Price-to-rent
- 6.6×
Monthly cashflow live
- Estimated rent
- $1,074 high interval (Pro) →
- Mortgage (P&I)
- −$445
- Tax from tax record
- −$57 /mo · $688/yr
- Insurance
- −$35
- HOA
- −$0
- Vacancy / Maint / Mgmt
- −$226
- Net cashflow
- $311
Break-even live
UW: 25.0% down · 7.5% · 30yr · 1.5% tax · 5.0% vac · 8.0% maint · 8.0% mgmt
Financing live
Cash to close
- Down payment
- $21,225
- Closing costs
- $2,547
- Reserves months
- —
- Total cash needed
- —
Loan-product check · same deal, 3 products live
Conventional
25% down · 7.5% · 30yr
- Down + closing
- —
- Monthly P&I
- —
- Monthly cashflow
- —
- DSCR
- —
- Eligible?
- —
Personal DTI + credit; lowest rate.
DSCR
20% down · 8.5% · 30yr
- Down + closing
- —
- Monthly P&I
- —
- Monthly cashflow
- —
- DSCR
- —
- Eligible?
- —
No personal income docs; deal must DSCR.
Hard money
10% down · 12.0% · 12mo
- Down + closing
- —
- Monthly P&I
- —
- Monthly cashflow
- —
- DSCR
- —
- Eligible?
- —
Short-term bridge; refi at stabilization.
Rent comps 7 comps
| Address | Beds | Baths | Sqft | Rent | $/sqft | DOM | Units | Dist |
|---|---|---|---|---|---|---|---|---|
| 55 Thompson Blvd Chickasaw, AL | 3.0 | 1.0 | 939 | $1,500 | $1.60 | 21d | 1 | 0.51mi |
| 101 Grant St Chickasaw, AL | 3.0 | 1.0 | 1383 | $895 | $0.65 | 13d | 1 | 0.65mi |
| 78 Lee St Chickasaw, AL | 3.0 | 1.0 | 1412 | $1,100 | $0.78 | 44d | 1 | 0.65mi |
| 408 Rawls Ave Mobile, AL | 2.0 | 1.0 | 1032 | $1,100 | $1.07 | 13d | 1 | 0.92mi |
| 311 Grant St Chickasaw, AL | 2.0 | 1.0 | 1000 | $850 | $0.85 | 44d | 1 | 0.96mi |
| 3 Southern St Chickasaw, AL | 3.0 | 1.0 | 1108 | $795 | $0.72 | 13d | 1 | 1.09mi |
| 100 Dairy Rd Mobile, AL | 2.0–3.0 | 2.0 | 999 | $1,100 | $1.10 | 13d | 1 | 1.44mi |
Listing history 7 events
-
2026-05-07status Pending 259-char remark
Show marketing remark (259 chars)
Step into cash flow! This 3 bed / 1 bath house is perfect for a landlord! It's a full brick house on slab foundation. This property is under the affordable housing program that is 100% subsidized at a rate of $1,050 / month. House has central heating and air.
-
2026-04-21status Active 259-char remark
Show marketing remark (259 chars)
Step into cash flow! This 3 bed / 1 bath house is perfect for a landlord! It's a full brick house on slab foundation. This property is under the affordable housing program that is 100% subsidized at a rate of $1,050 / month. House has central heating and air.
-
2026-03-13status Pending 259-char remark
Show marketing remark (259 chars)
Step into cash flow! This 3 bed / 1 bath house is perfect for a landlord! It's a full brick house on slab foundation. This property is under the affordable housing program that is 100% subsidized at a rate of $1,050 / month. House has central heating and air.
-
2026-03-13historical 259-char remark
Show marketing remark (259 chars)
Step into cash flow! This 3 bed / 1 bath house is perfect for a landlord! It's a full brick house on slab foundation. This property is under the affordable housing program that is 100% subsidized at a rate of $1,050 / month. House has central heating and air.
-
2026-03-10$84,900 Active 259-char remark
Show marketing remark (259 chars)
Step into cash flow! This 3 bed / 1 bath house is perfect for a landlord! It's a full brick house on slab foundation. This property is under the affordable housing program that is 100% subsidized at a rate of $1,050 / month. House has central heating and air.
-
2024-11-07soldstatus $55,000
-
2015-09-08soldstatus $9,500
ⓘ Source: listings_history table (triggers on properties + properties_extension) + one-shot
backfill from property_details.listing_events for pre-trigger history.
Tax reassessment forecast AL · Resets to sale price
- Current annual tax
- $688 · $57/mo
- Projected year-2 tax
- $688 · $57/mo
- Expected delta
- $0/yr ($0/mo · 0.0%)
ⓘ Screening estimate from a state-policy table — verify with the county assessor before closing.
Climate risk First Street
- Flood 1/10 Low FEMA zone X (unshaded) · 0% chance over 30 yrs
- Wildfire 3/10 Moderate
- Heat 9/10 Extreme 7 d/yr ≥104°F today · 21 d/yr by 30 yrs out
- Wind 9/10 Extreme 99% chance of damaging wind over 30 yrs
- Air quality 2/10 Low 1 unhealthy d/yr today · 2 by 30 yrs out
Nearby sold comps map
Loading sold comps map…
Walkable amenities ~0.75 mi
Loading nearby amenities…
Taxation est. · year 1
- Rental income
- $12,891
- − Mortgage interest
- −$4,756
- − Property taxes
- −$688
- − Insurance
- −$424
- − Repairs & maintenance
- −$1,031
- − Management
- −$1,031
- − Depreciation
- −$2,470
- Taxable income
- $2,490
- Est. tax owed @ 24.0%
- −$598
- After-tax cash flow
- $3,131/yr
For passive investors: Depreciation is non-cash, so a rental often shows a tax loss while cash-flowing — sheltering income. Rental losses are passive: they offset passive income freely, and up to $25,000/yr can offset ordinary (W-2) income if you actively participate and your MAGI is under $100k (phasing out to $0 by $150k); unused losses carry forward. On sale, claimed depreciation is recaptured at up to 25%, and gains may owe capital-gains tax (a 1031 exchange can defer both). Figures are a year-1 estimate at your 24.0% rate — not tax advice; consult a CPA.
Schools (NCES district)
No district data.
Livability — Chickasaw
- Score
- 61/100
- State rank
- #237
- US rank
- #17438
Category grades
Schools grade is shown separately in the Schools card above.
Census & demographics
- Census place
- Chickasaw, AL
- City population
- 6,367
- Population (ZIP)
- 6,367
Population outlook (Mobile County) Hauer SSP2
- Today (2025)
- 415,303 people
- By 2030
- 411,755 · -0.9%
- By 2040
- 399,670 · -3.8%
- By 2050
- 382,616 · -7.9%
- By 2075
- 337,353 · -18.8%
- By 2100
- 283,391 · -31.8%
Race, ethnicity, and origin ACS 2023
- Neighborhood character
- Diverse neighborhood (Simpson 0.56)
- Race & ethnicity
- Black 55% White 38% Two or more races 4% Hispanic / Latino 2% Asian 2%
- Common ancestry
- Lithuanian 2% Serbian 1% Italian 1%
- Foreign-born
- 3% · Canada, China
- Languages at home
- 98% English-only · Spanish 1% French/Haitian/Cajun 1%
Political lean MEDSL · Mobile
- 2024 margin
- R (+16.4) · D 41.3% · R 57.7%
- 2008→2024 swing
- -7.7pp toward R · 2008: -8.7pp · 2024: -16.4pp
- All cycles
- 2024: R+16.4 2020: R+11.9 2016: R+13.9 2012: R+9.3 2008: R+8.7
Not yet ingested
- Civics
- —
Market trends
- HPI YoY
- ▲ 12.90%
- Current HPI
- 196.621
- Rent YoY
- —
- Metro
- —
- State GDP YoY
- ▲ 2.94%
- F500 in state
- 4
Industry mix (Fortune 500 HQ in AL)
| Industry | F500 HQs | Revenue |
|---|---|---|
| Financial Services | 1 | $8B |
|
||
| Healthcare | 1 | $5B |
|
||
Price history
+793.7% since first listed7 events — show timeline
- 2026-05-07 Pending — GCMLS AL
- 2026-04-21 Relisted — GCMLS AL
- 2026-03-13 Pending — GCMLS AL
- 2026-03-13 Delisted — GCMLS AL
- 2026-03-10 Listed $84,900 GCMLS AL
- 2024-11-07 Sold (Public Records) $55,000 Public Records
- 2015-09-08 Sold (Public Records) $9,500 Public Records
Property tax history
+9.1%/yrLatest (2025): $688 · +12.8% YoY. Source: county tax records.
Cash-flow waterfall
monthlySold comps — $/sqft
last 12 mo · ≤1 miLoading sold comps…