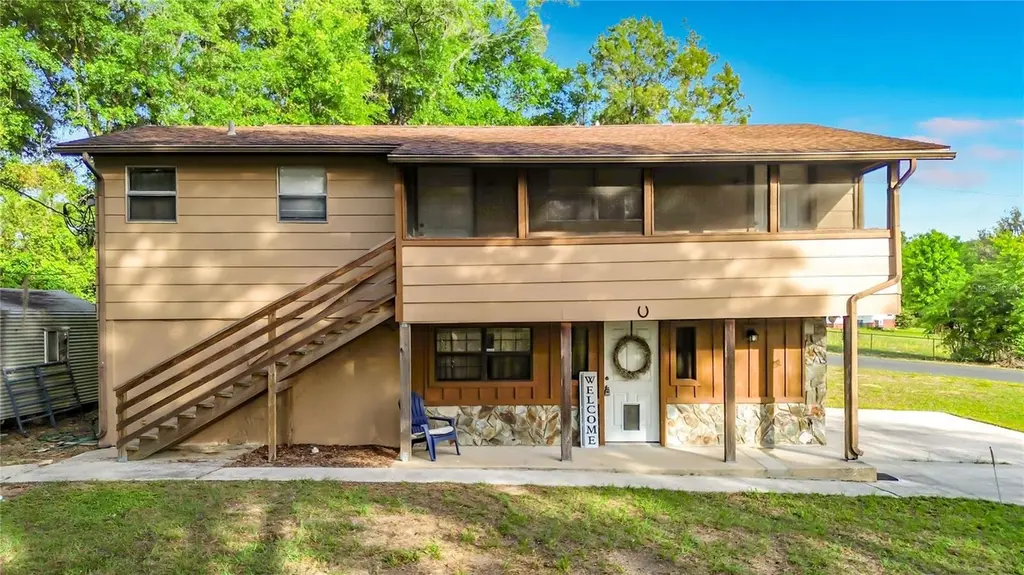
5120 W Marge Ln · Citrus Springs, FL
Flood risk 1/10 · Minimal
- FEMA flood zone
- X (unshaded)
- Chance of flooding over 30 yrs
- 0.0%
- Est. flood insurance / yr
- $507 – $1,088
Fire risk 6/10 · Moderate
- Est. fire insurance / yr
- $947 – $1,759
Heat risk 9/10 · Severe
- Hot days now (above 107°F)
- 7 days/yr
- Hot days in 30 yrs
- 23 days/yr
Wind risk 9/10 · Severe
- Chance of severe wind over 30 yrs
- 99.0%
Air-quality risk 2/10 · Minimal
- Unhealthy air days now
- 0 days/yr
- Unhealthy air days in 30 yrs
- 1 days/yr
Risk factors via First Street. Map © Google.
Why this score? — see what drove the B- grade
The composite is a weighted blend of 9 inputs, each scored 0–100. Each bar is that input's sub-score; the figure is the points it added to the 100-point composite (weight × sub-score).
- Cash flow +26.4/30.0
- ARV discount +12.4/15.0
- DSCR +9.0/10.0
- 1% rule +6.8/10.0
- Schools +4.1/10.0
- Livability +3.4/5.0
- Rent growth +2.5/5.0
- Condition / age +2.5/5.0
- Appreciation +1.8/10.0
$212,500
🖨 Deal sheet 📄 Offer letter ✓ Due diligence
Listing remarks
Under contract-accepting backup offers. Tucked away in the heart of Dunnellon, this charming cabin-style retreat offers the perfect blend of rustic character and outdoor adventure. Featuring laminate flooring throughout, a newer water heater, an 8-year-old roof, and a brand-new A/C installed in 2026, this home is well-equipped for comfort and peace of mind. A unique and versatile layout includes both an interior spiral staircase and a separate exterior wider wooden staircase, providing convenient access to the second floor. Upstairs, enjoy a breezy screened lanai—an ideal spot to relax and take in the peaceful surroundings. What truly sets this property apart is the deeded access to a
Key facts
- Screened lanai
- 0.31 acre lot
- Built 1971
Tags
Property features AI
Finance
- Other: Property zoned CLR; One septic system; Lot assessed as roughly 1/4 to less than 1/2 acre
- HOA & community: No HOA/association indicated; Cats and dogs allowed
Exterior
- Utilities: Public water; Septic tank sewer; Electricity connected
- Home design: Single family residence; Residential property; Completed condition; Faces west; Two stories; Entry level: Two levels
- Construction: Frame construction; Shingle roof; Slab foundation; Built on lot sized about 0.31 acre (approx. 110 x 125)
- Exterior features: Private mailbox; Other exterior features; Canal water view; Brackish canal access
Interior
- Kitchen: Range
- Bedrooms: 3 bedrooms
- Flooring: Laminate; Tile
- Bathrooms: 1 full bath; 1 half bath
- Heating & cooling: Central heating; Electric heating; Heat pump; Central air conditioning
- Interior features: Ceiling fans; Kitchen/family room combo; Thermostat; Other interior features
- Laundry & utility: Inside laundry room; Washer; Dryer
Neighborhood map
What this means for you Summary
Snapshot
- This is a 3-bed/1.5-bath single-family listed at $212k.
Deal economics
- At list price, monthly cash flow is $553 ($7k/yr) — positive.
- The deal already cash-flows at list — no discount required.
- Meets the 1% rule at list price ($2k rent vs $212k).
- Recommended offer: $206k (3.0% below list) — sets the bar for market timing.
- Cap rate 9.4% vs local median 5.1% in Citrus Springs — top-decile yield for the area; either an underpriced asset or a hidden risk that comps aren't pricing in. Stress-test before assuming the spread holds.
Location & tenants
- Location reads 68/100 on livability (#521 in FL) — a middle-class / working-renter tenant base. Strengths: cost of living A+, housing A+; Watch: schools C-, health & safety C-, employment D+.
- Citrus (rural): math 49% / reading 50% proficiency, ranked #44 of 73 in FL (top 60%) — families likely to look elsewhere, expect single-tenant / working-renter base with shorter leases.
- Market conditions: 642 active listings in the ZIP; 1 comparable units currently listed for rent nearby; 2,443 units permitted in Citrus County in 2024 (0 in 5+ unit buildings).
Forward outlook
- Local home prices are declining (-3.0%/yr); year-one equity from $1k of loan paydown is wiped out by about $6k of value loss. Plan a longer hold.
- Citrus County population projected to shrink 10% by 2050 — rents likely to lag national; underwrite the cash flow, not the appreciation.
- At projected returns (-3.0% appreciation + 3.0% rent growth), your $60k cash investment doubles in ~10 years — after that, you're playing with house money.
Negotiation context
- It's been on market 56 days — a 3% lower offer ($206k) is reasonable based on typical stale-listing flexibility.
- 3 sale attempts since 4y ago with the ask held roughly flat each time — persistent listings suggest the price (not the market) is what's stuck; bring a comps-based counter.
Risks & watch-outs
- Climate carrying-cost: severe wind risk, 99% chance of damaging wind over 30y; major wildfire risk; extreme-heat days projected 7→23/yr by 2055 (HVAC capex compounding) — expect insurance premiums to compound above CPI over the hold.
Questions for the listing agent
- It's been on market 56 days. Have you received any prior offers? Is the seller open to a 3% concession, seller financing, or rate buy-down credit?
- Built in 1971 — when were the roof, HVAC, electrical panel, plumbing, and water heater last replaced?
- Is there a deadline driving the sale (1031 exchange, divorce, estate, relocation)? That informs how much negotiation room exists.
- What's the average days-on-market for RENTAL listings here right now (not sales)? A rising rental-DOM trend means longer vacancies and softer asking-rent achievability than the comps imply.
- What's the recent tenant-quality profile in this submarket — average credit score on applications, eviction rate, late-payment / NSF rate, and stable-employment percentage? A property-management company in the area should have these aggregated.
- How much new for-sale + rental construction is in the pipeline within 1–3 miles? Heavy new supply typically softens prices + rents 12–24 months out; constrained supply supports both.
Investment metrics
- 1% rule
- 1.18% ✓
- Cap rate
- 9.41%
- Cash-on-cash
- 11.15%
- DSCR
- 1.50
- GRM
- 7.1
CMA / ARV
- ARV (on-the-fly)
- $238,680
- Comps found
- 1
Show comp detail 1 sale within ~0.75 mi
| Address | Dist | Beds/Ba | Sqft | Sold | Price | $/sf | Match |
|---|---|---|---|---|---|---|---|
| 11911 N Ellsworth Ter | 0.07mi | 3/2.0 | 1,440 (-8%) | 22mo | $220,000 | $153 | 64 |
Match score weights: distance 35% · size 25% · config 20% · recency 20%. Top-matched comps best support the ARV.
Projected returns pro-forma
-3.0% appreciation · 3.0% rent growth · sell at horizon
- IRR
- 0.3%
- Equity multiple
- 1.01×
- Total profit
- $778
- Equity at exit
- $31,684
- IRR
- 10.0%
- Equity multiple
- 1.77×
- Total profit
- $46,044
- Equity at exit
- $18,373
Cash invested: $59,500 (down + closing). Projections, not guarantees.
Landlord ↔ Tenant lean methodology
- Overall (STATE)
- 87 Strongly Landlord-Friendly
- State Florida
- 87 Strongly Landlord-Friendly · R+3
- County
- — inherits STATE
- City
- — inherits STATE
ZIP-level market 34433
- Home prices YoY
- -1.8%
- Active inventory
- 642
- Price-to-rent
- 7.1×
Monthly cashflow live
- Estimated rent
- $2,500 medium interval (Pro) →
- Mortgage (P&I)
- −$1,114
- Tax from tax record
- −$219 /mo · $2,632/yr
- Insurance
- −$89
- HOA
- −$0
- Vacancy / Maint / Mgmt
- −$525
- Net cashflow
- $553
Break-even live
UW: 25.0% down · 7.5% · 30yr · 1.5% tax · 5.0% vac · 8.0% maint · 8.0% mgmt
Financing live
Cash to close
- Down payment
- $53,125
- Closing costs
- $6,375
- Reserves months
- —
- Total cash needed
- —
Loan-product check · same deal, 3 products live
Conventional
25% down · 7.5% · 30yr
- Down + closing
- —
- Monthly P&I
- —
- Monthly cashflow
- —
- DSCR
- —
- Eligible?
- —
Personal DTI + credit; lowest rate.
DSCR
20% down · 8.5% · 30yr
- Down + closing
- —
- Monthly P&I
- —
- Monthly cashflow
- —
- DSCR
- —
- Eligible?
- —
No personal income docs; deal must DSCR.
Hard money
10% down · 12.0% · 12mo
- Down + closing
- —
- Monthly P&I
- —
- Monthly cashflow
- —
- DSCR
- —
- Eligible?
- —
Short-term bridge; refi at stabilization.
Rent comps 1 comps
| Address | Beds | Baths | Sqft | Rent | $/sqft | DOM | Units | Dist |
|---|---|---|---|---|---|---|---|---|
| 12950 SW 233rd Terrace Rd Dunnellon, FL | 3.0 | 2.5 | 1612 | $2,500 | $1.55 | 13d | 1 | 1.20mi |
Listing history 32 events
-
2026-06-03status $212,500 Pending 56 DOM
-
2026-06-02days on market $212,500 Active 56 DOM
-
2026-06-01days on market $212,500 Active 55 DOM
-
2026-05-31days on market $212,500 Active 54 DOM
-
2026-05-30days on market $212,500 Active 53 DOM
-
2026-05-13price $212,500
-
2026-04-07$215,000 Active
-
2026-01-02historical
-
2025-12-27price $219,999
-
2025-11-21price $220,000
-
2025-11-21price $220,000
-
2025-11-13price $226,800
-
2025-11-03price $231,800
-
2025-10-31price $231,900
-
2025-10-24price $231,800
-
2025-08-29price $231,900
-
2025-08-17price $232,000
-
2025-08-17price $232,000
-
2025-08-12price $248,900
-
2025-08-12price $248,900
-
2025-07-23price $249,000
-
2025-07-23price $249,000
-
2025-03-14price $258,000
-
2025-03-09price $258,000
-
2025-02-20price $259,000
-
2025-02-19price $259,000
-
2025-02-09$269,000 Active
-
2022-05-02soldstatus $219,000
-
2022-04-29soldstatus $219,000 Closed
-
2022-03-23status Pending
-
2022-03-19$219,000 Active
-
1994-06-14soldstatus $37,500
ⓘ Source: listings_history table (triggers on properties + properties_extension) + one-shot
backfill from property_details.listing_events for pre-trigger history.
Tax reassessment forecast FL · Resets to sale price
- Current annual tax
- $2,632 · $219/mo
- Projected year-2 tax
- $2,632 · $219/mo
- Expected delta
- $0/yr ($0/mo · 0.0%)
ⓘ Screening estimate from a state-policy table — verify with the county assessor before closing.
Climate risk First Street
- Flood 1/10 Low FEMA zone X (unshaded) · 0% chance over 30 yrs
- Wildfire 6/10 Major
- Heat 9/10 Extreme 7 d/yr ≥107°F today · 23 d/yr by 30 yrs out
- Wind 9/10 Extreme 99% chance of damaging wind over 30 yrs
- Air quality 2/10 Low 0 unhealthy d/yr today · 1 by 30 yrs out
Nearby sold comps map
Loading sold comps map…
Walkable amenities ~0.75 mi
Loading nearby amenities…
Taxation est. · year 1
- Rental income
- $30,000
- − Mortgage interest
- −$11,903
- − Property taxes
- −$2,632
- − Insurance
- −$1,062
- − Repairs & maintenance
- −$2,400
- − Management
- −$2,400
- − Depreciation
- −$6,182
- Taxable income
- $3,420
- Est. tax owed @ 24.0%
- −$821
- After-tax cash flow
- $5,812/yr
For passive investors: Depreciation is non-cash, so a rental often shows a tax loss while cash-flowing — sheltering income. Rental losses are passive: they offset passive income freely, and up to $25,000/yr can offset ordinary (W-2) income if you actively participate and your MAGI is under $100k (phasing out to $0 by $150k); unused losses carry forward. On sale, claimed depreciation is recaptured at up to 25%, and gains may owe capital-gains tax (a 1031 exchange can defer both). Figures are a year-1 estimate at your 24.0% rate — not tax advice; consult a CPA.
Schools (NCES district)
- District
- Citrus
- NCES district ID
- 1200270
- Math proficiency
- 49% ▼ -10.00%
- Reading proficiency
- 50% ▼ -6.00%
- Median HH income
- $38,618
- Composite
- 41.28/100
- National rank
- #3519
- State rank
- #44 of 73 in FL
Livability — Citrus Springs
- Score
- 68/100
- State rank
- #521
- US rank
- #9598
Category grades
Schools grade is shown separately in the Schools card above.
Census & demographics
- City population
- 10,730
- Population (ZIP)
- 8,218
Population outlook (Citrus County) Hauer SSP2
- Today (2025)
- 138,622 people
- By 2030
- 136,886 · -1.3%
- By 2040
- 132,009 · -4.8%
- By 2050
- 125,196 · -9.7%
- By 2075
- 108,570 · -21.7%
- By 2100
- 84,454 · -39.1%
Race, ethnicity, and origin ACS 2023
- Neighborhood character
- Predominantly White (76%)
- Race & ethnicity
- White 76% Hispanic / Latino 13% Two or more races 13%
- Hispanic origin (detail)
- Puerto Rican 6% Cuban 1%
- Common ancestry
- Italian 2% Romanian 2% Lithuanian 1%
- Foreign-born
- 9% · Canada
- Languages at home
- 90% English-only · Spanish 9% Other Indo-European 1%
Political lean MEDSL · Citrus
- 2024 margin
- Solid R (+45.9) · D 26.8% · R 72.6%
- 2008→2024 swing
- -29.8pp toward R · 2008: -16.1pp · 2024: -45.9pp
- All cycles
- 2024: R+45.9 2020: R+41.0 2016: R+39.7 2012: R+21.9 2008: R+16.1
Not yet ingested
- Civics
- —
Market trends
- HPI YoY
- ▼ -6.35%
- Current HPI
- 340.9844
- Rent YoY
- —
- Metro
- —
- State GDP YoY
- ▲ 3.28%
- F500 in state
- 36
Industry mix (Fortune 500 HQ in FL)
| Industry | F500 HQs | Revenue |
|---|---|---|
| Industrial Technology | 2 | $29B |
|
||
| Insurance | 2 | $17B |
|
||
| Retail | 1 | $60B |
|
||
| Technology Distribution | 1 | $58B |
|
||
| Homebuilding | 1 | $35B |
|
||
| Technology Manufacturing | 1 | $35B |
|
||
Price history
+466.7% since first listed27 events — show timeline
- 2026-05-13 Price Changed $212,500 Stellar MLS as Distributed by MLS Grid
- 2026-04-07 Listed $215,000 Stellar MLS as Distributed by MLS Grid
- 2026-01-02 Listing Removed — Stellar MLS as Distributed by MLS Grid
- 2025-12-27 Price Changed $219,999 Stellar MLS as Distributed by MLS Grid
- 2025-11-21 Price Changed $220,000 RACC
- 2025-11-21 Price Changed $220,000 Stellar MLS as Distributed by MLS Grid
- 2025-11-13 Price Changed $226,800 RACC
- 2025-11-03 Price Changed $231,800 RACC
- 2025-10-31 Price Changed $231,900 RACC
- 2025-10-24 Price Changed $231,800 Stellar MLS as Distributed by MLS Grid
- 2025-08-29 Price Changed $231,900 Stellar MLS as Distributed by MLS Grid
- 2025-08-17 Price Changed $232,000 RACC
- 2025-08-17 Price Changed $232,000 Stellar MLS as Distributed by MLS Grid
- 2025-08-12 Price Changed $248,900 RACC
- 2025-08-12 Price Changed $248,900 Stellar MLS as Distributed by MLS Grid
- 2025-07-23 Price Changed $249,000 RACC
- 2025-07-23 Price Changed $249,000 Stellar MLS as Distributed by MLS Grid
- 2025-03-14 Price Changed $258,000 RACC
- 2025-03-09 Price Changed $258,000 Stellar MLS as Distributed by MLS Grid
- 2025-02-20 Price Changed $259,000 RACC
- 2025-02-19 Price Changed $259,000 Stellar MLS as Distributed by MLS Grid
- 2025-02-09 Listed $269,000 Stellar MLS as Distributed by MLS Grid
- 2022-05-02 Sold (Public Records) $219,000 Public Records
- 2022-04-29 Sold (MLS) $219,000 Stellar MLS as Distributed by MLS Grid
- 2022-03-23 Pending — Stellar MLS as Distributed by MLS Grid
- 2022-03-19 Listed $219,000 Stellar MLS as Distributed by MLS Grid
- 1994-06-14 Sold (Public Records) $37,500 Public Records
Property tax history
+20.9%/yrLatest (2025): $2,632 · +5.0% YoY. Source: county tax records.
Cash-flow waterfall
monthlySold comps — $/sqft
last 12 mo · ≤1 miLoading sold comps…