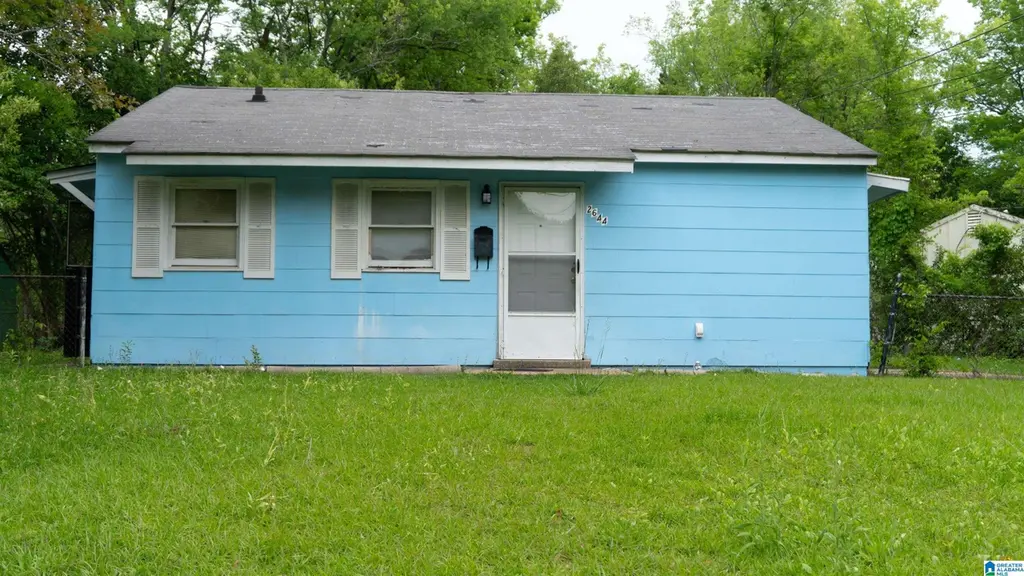
2644 Lark Dr · Montgomery, AL
Flood risk 1/10 · Minimal
- FEMA flood zone
- X (unshaded)
- Chance of flooding over 30 yrs
- 0.0%
- Est. flood insurance / yr
- $507 – $1,088
Fire risk 2/10 · Minimal
- Est. fire insurance / yr
- $916 – $1,700
Heat risk 7/10 · Major
- Hot days now (above 108°F)
- 7 days/yr
- Hot days in 30 yrs
- 20 days/yr
Wind risk 7/10 · Major
- Chance of severe wind over 30 yrs
- 78.0%
Air-quality risk 2/10 · Minimal
- Unhealthy air days now
- 1 days/yr
- Unhealthy air days in 30 yrs
- 1 days/yr
Risk factors via First Street. Map © Google.
Why this score? — see what drove the B grade
The composite is a weighted blend of 9 inputs, each scored 0–100. Each bar is that input's sub-score; the figure is the points it added to the 100-point composite (weight × sub-score).
- Cash flow +30.0/30.0
- 1% rule +10.0/10.0
- DSCR +10.0/10.0
- ARV discount +7.5/15.0
- Appreciation +6.4/10.0
- Livability +3.2/5.0
- Rent growth +2.5/5.0
- Condition / age +2.5/5.0
- Schools +1.7/10.0
$50,000
🖨 Deal sheet 📄 Offer letter ✓ Due diligence
Listing remarks
great investment opportunity
Key facts
- 0.3 acre lot
- Built 1954
- Listed 26 days
Property features AI
Finance
- Other: Parcel ID 11-07-26-2-010-008.000; Approximately 0.3 acres
- Financial info: No financial details provided
- HOA & community: No association fee
Exterior
- Parking: Driveway parking; Off-street parking
- Security: No security features listed
- Utilities: Public water; Connected sewer; Gas water heater; Internet availability unknown
- Home design: Existing construction; Wood construction
- Construction: Slab foundation
- Exterior features: No waterfront; No pool; No patio; No garden/patio; No decks
Interior
- Kitchen: Laminate and solid surface countertops; Gas cooktop; Refrigerator
- Bedrooms: Master bedroom on level 1; Additional bedroom on level 1
- Flooring: Carpet; Vinyl
- Bathrooms: One full bathroom; Tub/shower combo
- Heating & cooling: Central heating; Central cooling
- Interior features: 720 HVAC/living area (per seller); Pull-down attic; Ceilings: other (see remarks); No additional interior features listed
- Laundry & utility: No laundry details provided
Neighborhood map
What this means for you Summary
Snapshot
- This is a 2-bed/1.0-bath single-family listed at $50k.
Deal economics
- At list price, monthly cash flow is $333 ($4k/yr) — positive.
- The deal already cash-flows at list — no discount required.
- Meets the 1% rule at list price ($800 rent vs $50k).
- Recommended offer: $49k (1.5% below list) — sets the bar for market timing.
- Cap rate 14.3% vs local median 6.0% in Montgomery — top-decile yield for the area; either an underpriced asset or a hidden risk that comps aren't pricing in. Stress-test before assuming the spread holds.
Location & tenants
- Location reads 65/100 on livability (#138 in AL) — a middle-class / working-renter tenant base. Strengths: cost of living A+, housing A+; Watch: employment D, crime F, amenities D-.
- Montgomery County (urban): math 9% / reading 31% proficiency, ranked #106 of 129 in AL (top 82%) — low school quality limits family demand, transient renter base, plan for 1-2y turnover; 70% free/reduced lunch — lower-income household profile, screen leases tightly.
- Zoned schools: Carver Elementary School (math 8% / reading 47%, grade F, #389 of 627 statewide, top 62%, 365 students, 77% FRL); Carver Senior High School (math 2% / reading 12%, grade F, #265 of 305 statewide, top 89%, 902 students, 89% FRL).
- Market conditions: 65 active listings in the ZIP; 1 comparable units currently listed for rent nearby; 460 units permitted in Montgomery County in 2024 (37 in 5+ unit buildings).
Forward outlook
- In year one you build about $2k of equity ($346 loan paydown + $1k appreciation (2.7% local appreciation)).
- Montgomery County population projected to shrink 8% by 2050 — rents likely to lag national; underwrite the cash flow, not the appreciation.
- At projected returns (2.7% appreciation + 3.0% rent growth), your $14k cash investment doubles in ~3 years — after that, you're playing with house money.
Negotiation context
- It's been on market 26 days — a 2% lower offer ($49k) is reasonable based on typical stale-listing flexibility.
Risks & watch-outs
- Watch-outs: built in 1954 — expect roof / HVAC / electrical / plumbing capex.
- Climate carrying-cost: major wind risk, 78% chance of damaging wind over 30y; extreme-heat days projected 7→20/yr by 2055 (HVAC capex compounding) — expect insurance premiums to compound above CPI over the hold.
Questions for the listing agent
- Built in 1954 — when were the roof, HVAC, electrical panel, plumbing, and water heater last replaced?
- Is there a deadline driving the sale (1031 exchange, divorce, estate, relocation)? That informs how much negotiation room exists.
- Crime grade is F in this area — have there been break-ins, vandalism, or insurance claims at this property in the last 3 years? What carrier currently insures it and at what premium?
- What's the average days-on-market for RENTAL listings here right now (not sales)? A rising rental-DOM trend means longer vacancies and softer asking-rent achievability than the comps imply.
- What's the recent tenant-quality profile in this submarket — average credit score on applications, eviction rate, late-payment / NSF rate, and stable-employment percentage? A property-management company in the area should have these aggregated.
- How much new for-sale + rental construction is in the pipeline within 1–3 miles? Heavy new supply typically softens prices + rents 12–24 months out; constrained supply supports both.
Investment metrics
- 1% rule
- 1.60% ✓
- Cap rate
- 14.29%
- Cash-on-cash
- 28.55%
- DSCR
- 2.27
- GRM
- 5.2
CMA / ARV
- ARV (on-the-fly)
- $22,320
- Comps found
- 6
Show comp detail 6 sales within ~0.75 mi
| Address | Dist | Beds/Ba | Sqft | Sold | Price | $/sf | Match |
|---|---|---|---|---|---|---|---|
| 2596 Drake St | 0.09mi | 2/1.0 | 720 (0%) | 20mo | $8,000 | $11 | 79 |
| 2602 Drake St | 0.08mi | 2/1.0 | 720 (0%) | 20mo | $8,000 | $11 | 79 |
| 2568 Westgate St | 0.17mi | 2/1.0 | 720 (0%) | 22mo | $9,200 | $13 | 74 |
| 2620 Rutland St | 0.50mi | 2/1.0 | 616 (-14%) | 15mo | $19,000 | $31 | 40 |
| 3308 Lunceford St | 0.59mi | 3/1.0 (+1) | 784 (+9%) | 16mo | $48,000 | $61 | 39 |
| 3315 Boone St | 0.61mi | 2/1.0 | 616 (-14%) | 14mo | $63,000 | $102 | 36 |
Match score weights: distance 35% · size 25% · config 20% · recency 20%. Top-matched comps best support the ARV.
Projected returns pro-forma
2.71% appreciation · 3.0% rent growth · sell at horizon
- IRR
- 33.9%
- Equity multiple
- 2.89×
- Total profit
- $26,451
- Equity at exit
- $21,661
- IRR
- 34.4%
- Equity multiple
- 5.67×
- Total profit
- $65,386
- Equity at exit
- $32,757
Cash invested: $14,000 (down + closing). Projections, not guarantees.
Landlord ↔ Tenant lean methodology
- Overall (STATE)
- 90 Strongly Landlord-Friendly
- State Alabama
- 90 Strongly Landlord-Friendly · R+15
- County
- — inherits STATE
- City
- — inherits STATE
ZIP-level market 36108
- Home prices YoY
- 2.9%
- Active inventory
- 65
- Price-to-rent
- 5.2×
Monthly cashflow live
- Estimated rent
- $800 medium interval (Pro) →
- Mortgage (P&I)
- −$262
- Tax from tax record
- −$16 /mo · $190/yr
- Insurance
- −$21
- HOA
- −$0
- Vacancy / Maint / Mgmt
- −$168
- Net cashflow
- $333
Break-even live
UW: 25.0% down · 7.5% · 30yr · 1.5% tax · 5.0% vac · 8.0% maint · 8.0% mgmt
Financing live
Cash to close
- Down payment
- $12,500
- Closing costs
- $1,500
- Reserves months
- —
- Total cash needed
- —
Loan-product check · same deal, 3 products live
Conventional
25% down · 7.5% · 30yr
- Down + closing
- —
- Monthly P&I
- —
- Monthly cashflow
- —
- DSCR
- —
- Eligible?
- —
Personal DTI + credit; lowest rate.
DSCR
20% down · 8.5% · 30yr
- Down + closing
- —
- Monthly P&I
- —
- Monthly cashflow
- —
- DSCR
- —
- Eligible?
- —
No personal income docs; deal must DSCR.
Hard money
10% down · 12.0% · 12mo
- Down + closing
- —
- Monthly P&I
- —
- Monthly cashflow
- —
- DSCR
- —
- Eligible?
- —
Short-term bridge; refi at stabilization.
Rent comps 1 comps
| Address | Beds | Baths | Sqft | Rent | $/sqft | DOM | Units | Dist |
|---|---|---|---|---|---|---|---|---|
| 3208 Caffey Dr Montgomery, AL | 2.0 | 1.0 | 616 | $800 | $1.30 | 44d | 1 | 0.44mi |
Listing history 16 events
-
2026-06-18days on market $50,000 Active 26 DOM
-
2026-06-17days on market $50,000 Active 25 DOM
-
2026-06-16days on market $50,000 Active 24 DOM
-
2026-06-15days on market $50,000 Active 23 DOM
-
2026-06-14days on market $50,000 Active 21 DOM
-
2026-06-13days on market $50,000 Active 20 DOM
-
2026-06-10days on market $50,000 Active 18 DOM
-
2026-06-09days on market $50,000 Active 17 DOM
-
2026-06-08days on market $50,000 Active 16 DOM
-
2026-06-07days on market $50,000 Active 15 DOM
-
2026-06-03days on market $50,000 Active 11 DOM
-
2026-06-02days on market $50,000 Active 10 DOM
-
2026-06-01days on market $50,000 Active 9 DOM
-
2026-05-31days on market $50,000 Active 8 DOM
-
2026-05-30days on market $50,000 Active 7 DOM
-
2026-05-23$50,000 Active
ⓘ Source: listings_history table (triggers on properties + properties_extension) + one-shot
backfill from property_details.listing_events for pre-trigger history.
Tax reassessment forecast AL · Resets to sale price
- Current annual tax
- $190 · $16/mo
- Projected year-2 tax
- $205 · $17/mo
- Expected delta
- +$15/yr (+$1/mo · 7.8%)
ⓘ Screening estimate from a state-policy table — verify with the county assessor before closing.
Climate risk First Street
- Flood 1/10 Low FEMA zone X (unshaded) · 0% chance over 30 yrs
- Wildfire 2/10 Low
- Heat 7/10 Severe 7 d/yr ≥108°F today · 20 d/yr by 30 yrs out
- Wind 7/10 Severe 78% chance of damaging wind over 30 yrs
- Air quality 2/10 Low 1 unhealthy d/yr today · 1 by 30 yrs out
Nearby sold comps map
Loading sold comps map…
Walkable amenities ~0.75 mi
Loading nearby amenities…
Taxation est. · year 1
- Rental income
- $9,600
- − Mortgage interest
- −$2,801
- − Property taxes
- −$190
- − Insurance
- −$250
- − Repairs & maintenance
- −$768
- − Management
- −$768
- − Depreciation
- −$1,455
- Taxable income
- $3,369
- Est. tax owed @ 24.0%
- −$808
- After-tax cash flow
- $3,189/yr
For passive investors: Depreciation is non-cash, so a rental often shows a tax loss while cash-flowing — sheltering income. Rental losses are passive: they offset passive income freely, and up to $25,000/yr can offset ordinary (W-2) income if you actively participate and your MAGI is under $100k (phasing out to $0 by $150k); unused losses carry forward. On sale, claimed depreciation is recaptured at up to 25%, and gains may owe capital-gains tax (a 1031 exchange can defer both). Figures are a year-1 estimate at your 24.0% rate — not tax advice; consult a CPA.
Schools (NCES district)
- District
- Montgomery County
- NCES district ID
- 0102430
- Math proficiency
- 9% ▼ -21.00%
- Reading proficiency
- 31% ▼ -1.00%
- Median HH income
- $43,902
- Composite
- 17.24/100
- National rank
- #9093
- State rank
- #106 of 129 in AL
Livability — Montgomery
- Score
- 65/100
- State rank
- #138
- US rank
- #13416
Category grades
Schools grade is shown separately in the Schools card above.
Census & demographics
- Census place
- Montgomery, AL
- City population
- 175,913
- Population (ZIP)
- 15,549
Population outlook (Montgomery County) Hauer SSP2
- Today (2025)
- 224,008 people
- By 2030
- 221,460 · -1.1%
- By 2040
- 214,179 · -4.4%
- By 2050
- 204,912 · -8.5%
- By 2075
- 177,821 · -20.6%
- By 2100
- 145,134 · -35.2%
Race, ethnicity, and origin ACS 2023
- Neighborhood character
- Predominantly Black (82%)
- Race & ethnicity
- Black 82% White 10% Hispanic / Latino 6% Two or more races 2%
- Hispanic origin (detail)
- Mexican 4% Puerto Rican 1%
- Foreign-born
- 2% · Canada
- Languages at home
- 96% English-only · Spanish 3%
Political lean MEDSL · Montgomery
- 2024 margin
- Solid D (+30.7) · D 64.8% · R 34.1% · Other 1.1%
- 2008→2024 swing
- +11.5pp toward D · 2008: 19.2pp · 2024: 30.7pp
- All cycles
- 2024: D+30.7 2020: D+31.5 2016: D+26.2 2012: D+24.3 2008: D+19.2
Not yet ingested
- Civics
- —
Market trends
- HPI YoY
- ▲ 2.71%
- Current HPI
- 95.2405
- Rent YoY
- —
- Metro
- —
- State GDP YoY
- ▲ 2.94%
- F500 in state
- 4
Industry mix (Fortune 500 HQ in AL)
| Industry | F500 HQs | Revenue |
|---|---|---|
| Financial Services | 1 | $8B |
|
||
| Healthcare | 1 | $5B |
|
||
Price history
1 event — show timeline
- 2026-05-23 Listed $50,000 Greater Alabama MLS
Property tax history
+1.5%/yrLatest (2024): $190 · -5.3% YoY. Source: county tax records.
Cash-flow waterfall
monthlySold comps — $/sqft
last 12 mo · ≤1 miLoading sold comps…