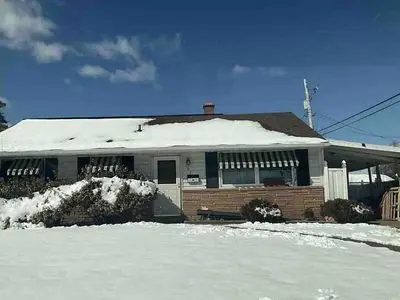
107 Festone Ave · New Castle, DE
Flood risk 1/10 · Minimal
- FEMA flood zone
- X (unshaded)
- Chance of flooding over 30 yrs
- 0.0%
- Est. flood insurance / yr
- $507 – $1,088
Fire risk 1/10 · Minimal
- Est. fire insurance / yr
- $476 – $884
Heat risk 7/10 · Major
- Hot days now (above 102°F)
- 7 days/yr
- Hot days in 30 yrs
- 15 days/yr
Wind risk 6/10 · Moderate
- Chance of severe wind over 30 yrs
- 27.0%
Air-quality risk 3/10 · Minor
- Unhealthy air days now
- 3 days/yr
- Unhealthy air days in 30 yrs
- 4 days/yr
Risk factors via First Street. Map © Google.
Why this score? — see what drove the D+ grade
The composite is a weighted blend of 9 inputs, each scored 0–100. Each bar is that input's sub-score; the figure is the points it added to the 100-point composite (weight × sub-score).
- Cash flow +16.0/30.0
- ARV discount +10.6/15.0
- DSCR +5.0/10.0
- Livability +3.6/5.0
- 1% rule +3.0/10.0
- Rent growth +2.5/5.0
- Condition / age +2.5/5.0
- Schools +2.1/10.0
- Appreciation +0.0/10.0
$290,000
🖨 Deal sheet (PDF) 📄 Offer letter ✓ Due diligence
Listing remarks MLS
Large master bedroom, family room, Jenn-Air stove, fenced rear yard, carport, 12 x 10 shed all make this ranch a must see for anyone looking for one floor living. Curved lot gives lots of room. OPEN SUNDAY 2/9/03 1:00-4:00
Key facts
- Spacious yard
- Corner lot
- Built 1956
Tags
Neighborhood map
What this means for you Summary
Snapshot
- This is a 4-bed/1.0-bath single-family listed at $290k.
Deal economics
- At list price, monthly cash flow is $145 ($2k/yr) — positive.
- The deal already cash-flows at list — no discount required.
- To meet the 1% rule (rent ≥ 1% of price), the offer needs to be $233k (19.6% below list).
- Recommended offer: $233k (19.6% below list) — sets the bar for 1% rule.
- Cap rate 6.9% vs local median 5.0% in New Castle — top-decile yield for the area; either an underpriced asset or a hidden risk that comps aren't pricing in. Stress-test before assuming the spread holds.
Location & tenants
- Location reads 72/100 on livability (#13 in DE) — a middle-class / working-renter tenant base. Strengths: employment A+, housing A+, cost of living A; Watch: crime F, commute F.
- Colonial School District (suburban): math 15% / reading 30% proficiency, ranked #23 of 26 in DE (top 88%) — low school quality limits family demand, transient renter base, plan for 1-2y turnover.
- Zoned schools: Eisenberg (Harry O.) Elementary School (math 8% / reading 22%, grade F, #91 of 105 statewide, top 87%, 399 students, 0% FRL); Mccullough (Calvin R. ) Middle School (math 8% / reading 15%, grade F, #35 of 36 statewide, top 97%, 705 students, 0% FRL); Penn (William) High School (math 16% / reading 30%, grade F, #29 of 40 statewide, top 72%, 2,239 students, 0% FRL) — zoned schools average 0% FRL vs 53% district-wide (53 pts lower); this property's tenant base skews higher-income than the district average.
- Market conditions: 143 active listings in the ZIP; 5 comparable units currently listed for rent nearby; rentals at typical pace (median 21d on market — plan ~3-4 weeks tenant-placement turnaround); solid renter incomes; 1,367 units permitted in New Castle County in 2024 (201 in 5+ unit buildings).
- This rent runs 37% of the median local income ($75k/yr) — at the standard rent-burdened threshold; future hikes will face affordability resistance.
Forward outlook
- Local home prices are declining (-3.0%/yr); year-one equity from $2k of loan paydown is wiped out by about $9k of value loss. Plan a longer hold.
- New Castle County population projected at +9% by 2050 — modest demand growth; plan on rents tracking national, not racing it.
Negotiation context
- It's been on market 21 days — a 2% lower offer ($286k) is reasonable based on typical stale-listing flexibility.
- 3 sale attempts since 24y ago with the ask held roughly flat each time — persistent listings suggest the price (not the market) is what's stuck; bring a comps-based counter.
- Current owner paid $120k; list at $290k implies a 142% gain — meaningful room to come down on a strong offer.
Risks & watch-outs
- Watch-outs: built in 1956 — expect roof / HVAC / electrical / plumbing capex.
- Climate carrying-cost: major wind risk, 27% chance of damaging wind over 30y; extreme-heat days projected 7→15/yr by 2055 (HVAC capex compounding) — expect insurance premiums to compound above CPI over the hold.
Questions for the listing agent
- Built in 1956 — when were the roof, HVAC, electrical panel, plumbing, and water heater last replaced?
- Is there a deadline driving the sale (1031 exchange, divorce, estate, relocation)? That informs how much negotiation room exists.
- Schools are D-rated, which usually means shorter tenancies and higher turnover. Who's the typical renter profile here, and what's been the actual vacancy rate?
- Crime grade is F in this area — have there been break-ins, vandalism, or insurance claims at this property in the last 3 years? What carrier currently insures it and at what premium?
- The area grade is low — what's the realistic commute time and amenity access for the typical tenant pool here? Any planned neighborhood developments (good or bad) we should know about?
- What's the average days-on-market for RENTAL listings here right now (not sales)? A rising rental-DOM trend means longer vacancies and softer asking-rent achievability than the comps imply.
- What's the recent tenant-quality profile in this submarket — average credit score on applications, eviction rate, late-payment / NSF rate, and stable-employment percentage? A property-management company in the area should have these aggregated.
- How much new for-sale + rental construction is in the pipeline within 1–3 miles? Heavy new supply typically softens prices + rents 12–24 months out; constrained supply supports both.
Investment metrics
- 1% rule
- 0.80% ✗
- Cap rate
- 6.89%
- Cash-on-cash
- 2.14%
- DSCR
- 1.10
- GRM
- 10.4
CMA / ARV
- ARV (on-the-fly)
- $311,100
- Comps found
- 12
Show comp detail 12 sales within ~0.75 mi
| Address | Dist | Beds/Ba | Sqft | Sold | Price | $/sf | Match |
|---|---|---|---|---|---|---|---|
| 183 Edge Ave | 0.24mi | 3/1.0 (-1) | 1,250 (-2%) | 2mo | $308,000 | $246 | 79 |
| 10 Midfield Rd | 0.49mi | 3/1.0 (-1) | 1,250 (-2%) | 1mo | $305,000 | $244 | 68 |
| 139 N Katrin Cir | 0.46mi | 3/2.5 (-1) | 1,250 (-2%) | 1mo | $390,000 | $312 | 63 |
| 3 S Glen Ave | 0.18mi | 3/1.0 (-1) | 1,450 (+14%) | 2mo | $270,500 | $187 | 62 |
| 101 Bellanca Ln | 0.31mi | 3/1.5 (-1) | 1,400 (+10%) | 2mo | $320,000 | $229 | 61 |
| 16 Varmar Dr | 0.30mi | 3/1.0 (-1) | 1,100 (-14%) | 0mo | $299,900 | $273 | 58 |
| 7 May Ave | 0.44mi | 3/1.5 (-1) | 1,175 (-8%) | 2mo | $299,999 | $255 | 58 |
| 17 Varmar Dr | 0.28mi | 3/1.0 (-1) | 1,100 (-14%) | 2mo | $205,000 | $186 | 58 |
| 6 Wardor Ave | 0.57mi | 4/1.0 | 1,150 (-10%) | 1mo | $195,000 | $170 | 56 |
| 7 Onaway Pl | 0.54mi | 4/2.0 | 1,400 (+10%) | 3mo | $276,000 | $197 | 52 |
| 306 Elwood Pl | 0.69mi | 3/1.0 (-1) | 1,200 (-6%) | 3mo | $271,000 | $226 | 50 |
| 19 Arbutus Ave | 0.59mi | 3/2.0 (-1) | 1,377 (+8%) | 1mo | $355,000 | $258 | 50 |
Match score weights: distance 35% · size 25% · config 20% · recency 20%. Top-matched comps best support the ARV.
Projected returns pro-forma
-3.0% appreciation · 3.0% rent growth · sell at horizon
- IRR
- -13.0%
- Equity multiple
- 0.53×
- Total profit
- $-37,912
- Equity at exit
- $43,240
- IRR
- -4.1%
- Equity multiple
- 0.73×
- Total profit
- $-21,747
- Equity at exit
- $25,074
Cash invested: $81,200 (down + closing). Projections, not guarantees.
Landlord ↔ Tenant lean methodology
- Overall (STATE)
- 70 Landlord-Friendly
- State Delaware
- 70 Landlord-Friendly · D+7
- County
- — inherits STATE
- City
- — inherits STATE
ZIP-level market 19720
- Active inventory
- 143
- Price-to-rent
- 10.4×
Monthly cashflow live
- Estimated rent
- $2,331 high interval (Pro) →
- Mortgage (P&I)
- −$1,521
- Tax from tax record
- −$55 /mo · $660/yr
- Insurance
- −$121
- HOA
- −$0
- Vacancy / Maint / Mgmt
- −$490
- Net cashflow
- $145
Break-even live
Sensitivity live
| Price | -10% $309 | -5% $227 | +0% $145 | +5% $63 | +10% $-19 |
|---|---|---|---|---|---|
| Rent | -10% $-39 | -5% $53 | +0% $145 | +5% $237 | +10% $329 |
| Rate | -1.0pp $291 | -0.5pp $219 | base $145 | +0.5pp $70 | +1.0pp $-7 |
UW: 25.0% down · 7.5% · 30yr · 1.5% tax · 5.0% vac · 8.0% maint · 8.0% mgmt
Financing live
Cash to close
- Down payment
- $72,500
- Closing costs
- $8,700
- Reserves months
- —
- Total cash needed
- —
Loan-product check · same deal, 3 products live
Conventional
25% down · 7.5% · 30yr
- Down + closing
- —
- Monthly P&I
- —
- Monthly cashflow
- —
- DSCR
- —
- Eligible?
- —
Personal DTI + credit; lowest rate.
DSCR
20% down · 8.5% · 30yr
- Down + closing
- —
- Monthly P&I
- —
- Monthly cashflow
- —
- DSCR
- —
- Eligible?
- —
No personal income docs; deal must DSCR.
Hard money
10% down · 12.0% · 12mo
- Down + closing
- —
- Monthly P&I
- —
- Monthly cashflow
- —
- DSCR
- —
- Eligible?
- —
Short-term bridge; refi at stabilization.
Rent comps 5 comps
| Address | Beds | Baths | Sqft | Rent | $/sqft | DOM | Units | Dist |
|---|---|---|---|---|---|---|---|---|
| 13 Arbutus Ave Unit 1 New Castle, DE | 3.0 | 2.0 | 1600 | $2,650 | $1.66 | 20d | 1 | 0.58mi |
| 17 Gene Ave New Castle, DE | 3.0 | 1.5 | 900 | $2,100 | $2.33 | 45d | 1 | 0.59mi |
| 600 Moores Ln New Castle, DE | 1.0–3.0 | 1.0–1.5 | 800 | $2,149 | $2.69 | 0d | 7 | 0.71mi |
| 10 Burton Ave New Castle, DE | 3.0 | 1.0 | 900 | $1,900 | $2.11 | 26d | 1 | 0.77mi |
| 114 Baldt Ave Historic New Castle, DE | 3.0 | 1.5 | 1300 | $2,200 | $1.69 | 5d | 1 | 1.28mi |
Listing history 19 events
-
2026-06-16days on market $290,000 Active 21 DOM
-
2026-06-15days on market $290,000 Active 20 DOM
-
2026-06-13days on market $290,000 Active 18 DOM
-
2026-06-09days on market $290,000 Active 14 DOM
-
2026-06-08days on market $290,000 Active 13 DOM
-
2026-06-07days on market $290,000 Active 12 DOM
-
2026-06-04days on market $290,000 Active 9 DOM
-
2026-06-03days on market $290,000 Active 8 DOM
-
2026-06-02days on market $290,000 Active 7 DOM
-
2026-06-01days on market $290,000 Active 6 DOM
-
2026-05-31days on market $290,000 Active 5 DOM
-
2026-05-26$290,000 Active
-
2003-05-01soldstatus $119,900
-
2003-04-30soldstatus $119,900 222-char remark
Show marketing remark (222 chars)
Large master bedroom, family room, Jenn-Air stove, fenced rear yard, carport, 12 x 10 shed all make this ranch a must see for anyone looking for one floor living. Curved lot gives lots of room. OPEN SUNDAY 2/9/03 1:00-4:00
-
2003-03-15historical 222-char remark
Show marketing remark (222 chars)
Large master bedroom, family room, Jenn-Air stove, fenced rear yard, carport, 12 x 10 shed all make this ranch a must see for anyone looking for one floor living. Curved lot gives lots of room. OPEN SUNDAY 2/9/03 1:00-4:00
-
2002-11-15$119,900 222-char remark
Show marketing remark (222 chars)
Large master bedroom, family room, Jenn-Air stove, fenced rear yard, carport, 12 x 10 shed all make this ranch a must see for anyone looking for one floor living. Curved lot gives lots of room. OPEN SUNDAY 2/9/03 1:00-4:00
-
2002-09-26$123,900
-
2002-09-26historical
-
1986-10-01soldstatus $62,900
ⓘ Source: listings_history table (triggers on properties + properties_extension) + one-shot
backfill from property_details.listing_events for pre-trigger history.
Tax reassessment forecast DE · Partial reset (capped growth)
- Current annual tax
- $660 · $55/mo
- Projected year-2 tax
- $1,171 · $98/mo
- Expected delta
- +$511/yr (+$43/mo · 77.4%)
ⓘ Screening estimate from a state-policy table — verify with the county assessor before closing.
Climate risk First Street
- Flood 1/10 Low FEMA zone X (unshaded) · 0% chance over 30 yrs
- Wildfire 1/10 Low
- Heat 7/10 Severe 7 d/yr ≥102°F today · 15 d/yr by 30 yrs out
- Wind 6/10 Major 27% chance of damaging wind over 30 yrs
- Air quality 3/10 Moderate 3 unhealthy d/yr today · 4 by 30 yrs out
Nearby sold comps map
Loading sold comps map…
Walkable amenities ~0.75 mi
Loading nearby amenities…
Taxation est. · year 1
- Rental income
- $27,974
- − Mortgage interest
- −$16,245
- − Property taxes
- −$660
- − Insurance
- −$1,450
- − Repairs & maintenance
- −$2,238
- − Management
- −$2,238
- − Depreciation
- −$8,436
- Taxable loss
- −$3,293
- Est. tax savings @ 24.0%
- +$790
- After-tax cash flow
- $2,530/yr
For passive investors: Depreciation is non-cash, so a rental often shows a tax loss while cash-flowing — sheltering income. Rental losses are passive: they offset passive income freely, and up to $25,000/yr can offset ordinary (W-2) income if you actively participate and your MAGI is under $100k (phasing out to $0 by $150k); unused losses carry forward. On sale, claimed depreciation is recaptured at up to 25%, and gains may owe capital-gains tax (a 1031 exchange can defer both). Figures are a year-1 estimate at your 24.0% rate — not tax advice; consult a CPA.
Schools (NCES district)
- District
- Colonial School District
- NCES district ID
- 1000230
- Math proficiency
- 15% ▼ -10.00%
- Reading proficiency
- 30% ▼ -9.00%
- Median HH income
- $58,622
- Composite
- 20.75/100
- National rank
- #8517
- State rank
- #23 of 26 in DE
Livability — New Castle
- Score
- 72/100
- State rank
- #13
- US rank
- #5905
Category grades
Schools grade is shown separately in the Schools card above.
Census & demographics
- County
- New Castle County · 483,412 people
- City population
- 62,392
- Metro
- Philadelphia-Camden-Wilmington, PA-NJ-DE-MD
- Population (ZIP)
- 62,392
- Household income
- $75,403
- Rent vs Own
- Severe rent burden
- 1852.0
Population outlook (New Castle County) Hauer SSP2
- Today (2025)
- 594,686 people
- By 2030
- 609,164 · +2.4%
- By 2040
- 632,154 · +6.3%
- By 2050
- 649,068 · +9.1%
- By 2075
- 687,771 · +15.7%
- By 2100
- 694,961 · +16.9%
Race, ethnicity, and origin ACS 2023
- Neighborhood character
- Diverse neighborhood (Simpson 0.67)
- Race & ethnicity
- Black 42% White 35% Hispanic / Latino 17% Two or more races 7% Asian 2%
- Hispanic origin (detail)
- Mexican 9% Puerto Rican 6% Dominican 2%
- Common ancestry
- Romanian 4% Lithuanian 1% Swedish 1%
- Foreign-born
- 12% · Canada
- Languages at home
- 82% English-only · Spanish 13% French/Haitian/Cajun 1% Other Indo-European 1%
Political lean MEDSL · New Castle
- 2024 margin
- Solid D (+32.6) · D 65.5% · R 32.9% · Other 1.6%
- 2008→2024 swing
- -8.1pp toward R · 2008: 40.6pp · 2024: 32.6pp
- All cycles
- 2024: D+32.6 2020: D+37.1 2016: D+29.6 2012: D+34.1 2008: D+40.6
Not yet ingested
- Civics
- —
Market trends
- HPI YoY
- ▼ -261.00%
- Current HPI
- 255.0404
- Rent YoY
- —
- Metro
- Philadelphia-Camden-Wilmington, PA-NJ-DE-MD
- State GDP YoY
- —
- F500 in state
- 0
Price history
+361.0% since first listed8 events — show timeline
- 2026-05-26 Listed $290,000 FSBO.com
- 2003-05-01 Sold (Public Records) $119,900 Public Records
- 2003-04-30 Sold (MLS) $119,900 BRIGHT MLS
- 2003-03-15 Listing Removed — BRIGHT MLS
- 2002-11-15 Listed $119,900 BRIGHT MLS
- 2002-09-26 Listing Removed — BRIGHT MLS
- 2002-09-26 Listed $123,900 BRIGHT MLS
- 1986-10-01 Sold (Public Records) $62,900 Public Records
Property tax history
+3.9%/yrLatest (2024): $660 · +10.9% YoY. Source: county tax records.
Cash-flow waterfall
monthlySold comps — $/sqft
last 12 mo · ≤1 miLoading sold comps…