 🔨 Auction
406 W Dickson St · Murfreesboro, AR
Flood risk 1/10 · Minimal
- FEMA flood zone
- —
- Chance of flooding over 30 yrs
- 0.0%
- Est. flood insurance / yr
- —
Fire risk 5/10 · Moderate
- Est. fire insurance / yr
- $1,499 – $2,785
Heat risk 6/10 · Moderate
- Hot days now (above 109°F)
- 7 days/yr
- Hot days in 30 yrs
- 20 days/yr
Wind risk 4/10 · Minor
- Chance of severe wind over 30 yrs
- 11.0%
Air-quality risk 1/10 · Minimal
- Unhealthy air days now
- 0 days/yr
- Unhealthy air days in 30 yrs
- 0 days/yr
Risk factors via First Street. Map © Google.
Why this score? — see what drove the C grade
The composite is a weighted blend of 9 inputs, each scored 0–100. Each bar is that input's sub-score; the figure is the points it added to the 100-point composite (weight × sub-score).
- Cash flow +20.7/30.0
- ARV discount +7.5/15.0
- DSCR +6.6/10.0
- 1% rule +5.5/10.0
- Appreciation +5.1/10.0
- Livability +3.4/5.0
- Schools +3.1/10.0
- Rent growth +2.5/5.0
- Condition / age +2.5/5.0
$1
🖨 Deal sheet 📄 Offer letter ✓ Due diligence
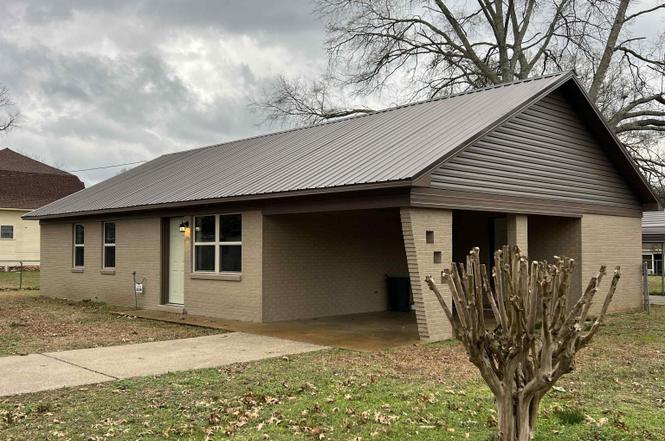
Listing remarks
RESIDENTIAL REAL ESTATE AUCTION Friday, March 20th at 11AM 2026 Open House: Sunday, March 15th 1PM to 3PM 406 West Dickson St. Murfreesboro, AR 71958 Live on Location with Online Bidding - Bidding now in progress at www. FowlerAuctioneers.com Offers Made Prior to Auction are welcome!! Subject to Seller Confirmation Newly Remodeled One-Story, 1,170± SF Home has 3 Bedrooms/ 1 Bath. Home Consists of Living Room, Dining Room, Single Carport. The home has a new pitched rafters, decking, metal roof, new heat, HVAC is approx. one year old. New wiring, new custom tile shower & vanity, new kitchen cabinets, new lighting, carpet in the bedrooms, new weather proof wood plank style floo
Key facts
- 9,583 sq ft lot
- Parking
- Built 1992
Neighborhood map
What this means for you Summary
Snapshot
- This is a 3-bed/1.0-bath single-family listed at $1.
Deal economics
- At list price, monthly cash flow is $137 ($2k/yr) — positive.
- The deal already cash-flows at list — no discount required.
- Meets the 1% rule at list price ($1k rent vs $1).
Location & tenants
- Location reads 68/100 on livability (#90 in AR) — a middle-class / working-renter tenant base. Strengths: crime A+, cost of living A+, health & safety A+; Watch: schools D, amenities F, commute F.
- South Pike County School District (rural): math 35% / reading 40% proficiency, ranked #99 of 238 in AR (top 42%) — families likely to look elsewhere, expect single-tenant / working-renter base with shorter leases.
- Market conditions: 30 active listings in the ZIP.
Forward outlook
- In year one you build about $952 of equity ($696 loan paydown + $256 appreciation (0.2% local appreciation)).
- Pike County population projected at -26% by 2050 — secular population decline; favor cash flow + early exit over multi-decade hold.
- At projected returns (0.2% appreciation + 3.0% rent growth), your $28k cash investment doubles in ~8 years — after that, you're playing with house money.
Negotiation context
- It's been on market 75 days — a 6% lower offer ($0) is reasonable based on typical stale-listing flexibility.
Risks & watch-outs
- Watch-outs: property tax is 150930.0% of price.
- Climate carrying-cost: moderate wildfire risk; extreme-heat days projected 7→20/yr by 2055 (HVAC capex compounding) — expect insurance premiums to compound above CPI over the hold.
Questions for the listing agent
- It's been on market 75 days. Have you received any prior offers? Is the seller open to a 5% concession, seller financing, or rate buy-down credit?
- Property tax is high relative to price — has the assessment been appealed recently, and will the sale trigger a re-assessment?
- Why hasn't it sold? Are there any deal-killer items the seller is aware of (foundation, flood, title, zoning, code violations)?
- Is there a deadline driving the sale (1031 exchange, divorce, estate, relocation)? That informs how much negotiation room exists.
- Schools are D-rated, which usually means shorter tenancies and higher turnover. Who's the typical renter profile here, and what's been the actual vacancy rate?
- What's the average days-on-market for RENTAL listings here right now (not sales)? A rising rental-DOM trend means longer vacancies and softer asking-rent achievability than the comps imply.
- What's the recent tenant-quality profile in this submarket — average credit score on applications, eviction rate, late-payment / NSF rate, and stable-employment percentage? A property-management company in the area should have these aggregated.
- How much new for-sale + rental construction is in the pipeline within 1–3 miles? Heavy new supply typically softens prices + rents 12–24 months out; constrained supply supports both.
Investment metrics
- 1% rule
- 1.05% ✓
- Cap rate
- 7.92%
- Cash-on-cash
- 5.82%
- DSCR
- 1.26
- GRM
- 8.0
CMA / ARV
- ARV (on-the-fly)
- $100,620
- Comps found
- 2
Show comp detail 2 sales within ~0.75 mi
| Address | Dist | Beds/Ba | Sqft | Sold | Price | $/sf | Match |
|---|---|---|---|---|---|---|---|
| 405 3rd Ave | 0.31mi | 2/1.0 (-1) | 1,200 (+3%) | 9mo | $85,000 | $71 | 69 |
| 406 W 6th St | 0.46mi | 3/1.0 | 1,100 (-6%) | 12mo | $95,000 | $86 | 58 |
Match score weights: distance 35% · size 25% · config 20% · recency 20%. Top-matched comps best support the ARV.
Projected returns pro-forma
0.25% appreciation · 3.0% rent growth · sell at horizon
- IRR
- 5.1%
- Equity multiple
- 1.25×
- Total profit
- $6,982
- Equity at exit
- $30,503
- IRR
- 10.1%
- Equity multiple
- 2.13×
- Total profit
- $31,929
- Equity at exit
- $37,709
Cash invested: $28,174 (down + closing). Projections, not guarantees.
Landlord ↔ Tenant lean methodology
- Overall (STATE)
- 92 Strongly Landlord-Friendly
- State Arkansas
- 92 Strongly Landlord-Friendly · R+14
- County
- — inherits STATE
- City
- — inherits STATE
ZIP-level market 71958
- Home prices YoY
- 0.1%
- Active inventory
- 30
Monthly cashflow live
- Estimated rent
- $1,053 medium interval (Pro) →
- Mortgage (P&I)
- −$528
- Tax est. 1.5%
- −$126 /mo · $1,509/yr
- Insurance
- −$42
- HOA
- −$0
- Vacancy / Maint / Mgmt
- −$221
- Net cashflow
- $137
Break-even live
UW: 25.0% down · 7.5% · 30yr · 1.5% tax · 5.0% vac · 8.0% maint · 8.0% mgmt
Financing live
Cash to close
- Down payment
- $25,155
- Closing costs
- $3,019
- Reserves months
- —
- Total cash needed
- —
Loan-product check · same deal, 3 products live
Conventional
25% down · 7.5% · 30yr
- Down + closing
- —
- Monthly P&I
- —
- Monthly cashflow
- —
- DSCR
- —
- Eligible?
- —
Personal DTI + credit; lowest rate.
DSCR
20% down · 8.5% · 30yr
- Down + closing
- —
- Monthly P&I
- —
- Monthly cashflow
- —
- DSCR
- —
- Eligible?
- —
No personal income docs; deal must DSCR.
Hard money
10% down · 12.0% · 12mo
- Down + closing
- —
- Monthly P&I
- —
- Monthly cashflow
- —
- DSCR
- —
- Eligible?
- —
Short-term bridge; refi at stabilization.
Listing history 3 events
-
2026-03-24status Under Contract
-
2026-01-06$1 New Listing
-
1999-09-22soldstatus $51,000
ⓘ Source: listings_history table (triggers on properties + properties_extension) + one-shot
backfill from property_details.listing_events for pre-trigger history.
Climate risk First Street
- Flood 1/10 Low 0% chance over 30 yrs
- Wildfire 5/10 Major
- Heat 6/10 Major 7 d/yr ≥109°F today · 20 d/yr by 30 yrs out
- Wind 4/10 Moderate 11% chance of damaging wind over 30 yrs
- Air quality 1/10 Low 0 unhealthy d/yr today · 0 by 30 yrs out
Nearby sold comps map
Loading sold comps map…
Walkable amenities ~0.75 mi
Loading nearby amenities…
Taxation est. · year 1
- Rental income
- $12,637
- − Mortgage interest
- −$5,636
- − Property taxes
- −$1,509
- − Insurance
- −$503
- − Repairs & maintenance
- −$1,011
- − Management
- −$1,011
- − Depreciation
- −$2,927
- Taxable income
- $40
- Est. tax owed @ 24.0%
- −$10
- After-tax cash flow
- $1,630/yr
For passive investors: Depreciation is non-cash, so a rental often shows a tax loss while cash-flowing — sheltering income. Rental losses are passive: they offset passive income freely, and up to $25,000/yr can offset ordinary (W-2) income if you actively participate and your MAGI is under $100k (phasing out to $0 by $150k); unused losses carry forward. On sale, claimed depreciation is recaptured at up to 25%, and gains may owe capital-gains tax (a 1031 exchange can defer both). Figures are a year-1 estimate at your 24.0% rate — not tax advice; consult a CPA.
Schools (NCES district)
- District
- South Pike County School District
- NCES district ID
- 0510320
- Math proficiency
- 35% ▼ -11.00%
- Reading proficiency
- 40% ▼ -7.00%
- Median HH income
- $37,455
- Composite
- 31.2/100
- National rank
- #6040
- State rank
- #99 of 238 in AR
Livability — Murfreesboro
- Score
- 68/100
- State rank
- #90
- US rank
- #9996
Category grades
Schools grade is shown separately in the Schools card above.
Census & demographics
- Census place
- Murfreesboro, AR
- Population (ZIP)
- 2,324
Population outlook (Pike County) Hauer SSP2
- Today (2025)
- 10,158 people
- By 2030
- 9,681 · -4.7%
- By 2040
- 8,640 · -14.9%
- By 2050
- 7,500 · -26.2%
- By 2075
- 4,897 · -51.8%
- By 2100
- 2,911 · -71.3%
Race, ethnicity, and origin ACS 2023
- Neighborhood character
- Predominantly White (79%)
- Race & ethnicity
- White 79% Black 9% Two or more races 8% Hispanic / Latino 6%
- Hispanic origin (detail)
- Mexican 5%
- Common ancestry
- Italian 7% Serbian 2% Slovak 1%
- Foreign-born
- 3% · Canada
- Languages at home
- 97% English-only · Spanish 3%
Political lean MEDSL · Pike
- 2024 margin
- Solid R (+73.1) · D 12.8% · R 86.0% · Other 1.2%
- 2008→2024 swing
- -31.8pp toward R · 2008: -41.3pp · 2024: -73.1pp
- All cycles
- 2024: R+73.1 2020: R+67.7 2016: R+62.3 2012: R+52.7 2008: R+41.3
Not yet ingested
- Civics
- —
Market trends
- HPI YoY
- ▲ 0.25%
- Current HPI
- 180.1647
- Rent YoY
- —
- Metro
- —
- State GDP YoY
- ▲ 3.80%
- F500 in state
- 10
Industry mix (Fortune 500 HQ in AR)
| Industry | F500 HQs | Revenue |
|---|---|---|
| Retail | 1 | $681B |
|
||
| Food / Agriculture | 1 | $53B |
|
||
| Retail / Energy | 1 | $22B |
|
||
| Transportation / Logistics | 1 | $12B |
|
||
| Energy | 1 | $4B |
|
||
Price history
3 events — show timeline
- 2026-03-24 Pending — CARMLS
- 2026-01-06 Listed $1 CARMLS
- 1999-09-22 Sold (Public Records) $51,000 Public Records
Property tax history
+19.2%/yrLatest (2025): $493 · +9.1% YoY. Source: county tax records.
Cash-flow waterfall
monthlySold comps — $/sqft
last 12 mo · ≤1 miLoading sold comps…