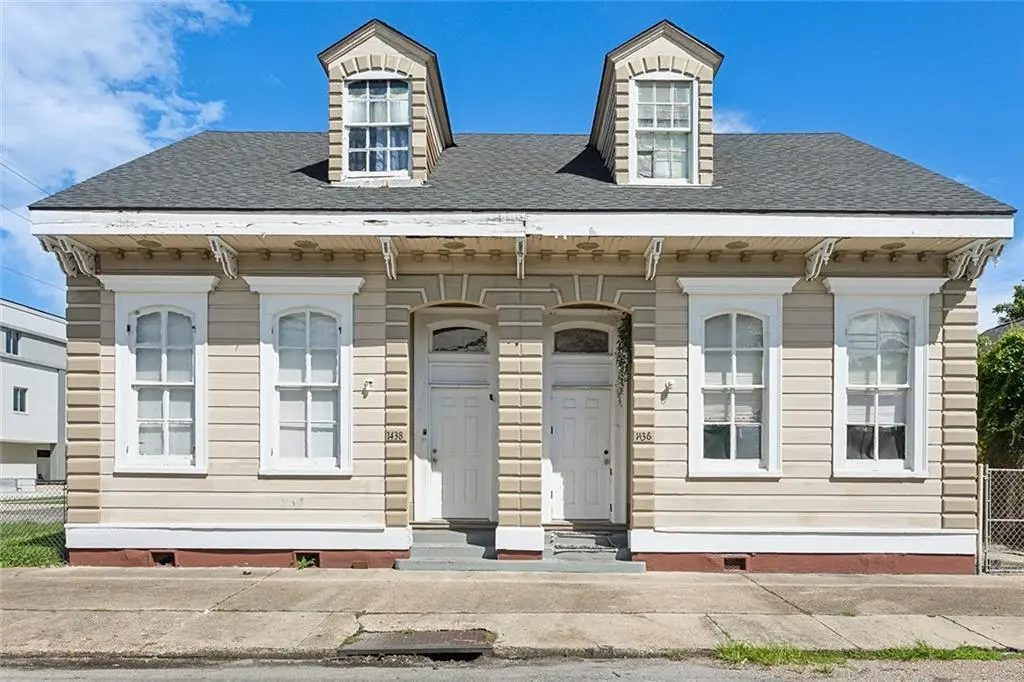
1436 N Villere St · New Orleans, LA
Flood risk 7/10 · Major
- FEMA flood zone
- X
- Chance of flooding over 30 yrs
- 0.6%
- Est. flood insurance / yr
- $507 – $1,088
Fire risk 1/10 · Minimal
- Est. fire insurance / yr
- $1,269 – $2,357
Heat risk 10/10 · Severe
- Hot days now (above 108°F)
- 7 days/yr
- Hot days in 30 yrs
- 21 days/yr
Wind risk 10/10 · Severe
- Chance of severe wind over 30 yrs
- 99.0%
Air-quality risk 4/10 · Minor
- Unhealthy air days now
- 4 days/yr
- Unhealthy air days in 30 yrs
- 4 days/yr
Risk factors via First Street. Map © Google.
Why this score? — see what drove the C grade
The composite is a weighted blend of 9 inputs, each scored 0–100. Each bar is that input's sub-score; the figure is the points it added to the 100-point composite (weight × sub-score).
- Cash flow +25.0/30.0
- DSCR +8.2/10.0
- ARV discount +7.5/15.0
- 1% rule +6.7/10.0
- Livability +4.0/5.0
- Rent growth +2.5/5.0
- Condition / age +2.5/5.0
- Schools +1.6/10.0
- Appreciation +0.0/10.0
$280,000
🖨 Deal sheet 📄 Offer letter ✓ Due diligence
Listing remarks MLS
Historic Double Just Minutes from the French Quarter with Significant Upside Potential! <br><br> Opportunity awaits at 1436-1438 N. Villere Street, a classic New Orleans duplex full of original charm and investment potential. Located just blocks from the French Quarter, Marigny, and some of the city's most popular restaurants, music venues, and attractions, this property offers an exceptional chance to renovate and create substantial value. <br><br> Featuring original hardwood floors, soaring ceilings, exposed brick accents, decorative fireplaces, and historic architectural details throughout, this duplex is ready for its next chapter. Whether you're an investor seeking a value-add rental property, a developer looking for your next project, or an owner-occupant interested in living in one unit while generating income from the other, the possibilities are endless. <br><br> With a strong projected after-repair value and growing demand in the surrounding area, this property presents an excellent opportunity for renovation, long-term rental income, short-term rental possibilities where permitted, or resale potential. <br><br> Properties this close to the French Quarter with this much character and upside don't come along often. Bring your vision and unlock the full potential of this New Orleans classic. <br><br> Property sold as-is. Priced below market value to sell. Buyer to verify zoning, use restrictions, and all measurements. <br><br>
Key facts
- 2 unit property
- Brick accents
- 4,543 sq ft lot
Tags
Property features AI
Finance
- Financial info: Two-unit property; Unit 1436: approximately 2214 sq ft, 5 beds, 2 full baths, rent $1,405; Unit 1438: approximately 2214 sq ft, 5 beds, 2 full baths, rent $1,400
Exterior
- Utilities: Public water; Public sewer
- Home design: Two-story building; Raised foundation
- Construction: Shingle roof
- Exterior features: City lot; Irregular lot
Interior
- Bedrooms: Each unit has 5 bedrooms (both units)
- Bathrooms: Four full bathrooms total (two full bathrooms per unit)
- Heating & cooling: Window unit heating; Window unit cooling
- Interior features: Average condition
Neighborhood map
What this means for you Summary
Snapshot
- This is a 2-bed/1.0-bath condo listed at $280k.
Deal economics
- At list price, monthly cash flow is $546 ($7k/yr) — positive.
- The deal already cash-flows at list — no discount required.
- Meets the 1% rule at list price ($3k rent vs $280k).
- Cap rate 8.9% vs local median 4.4% in New Orleans — top-decile yield for the area; either an underpriced asset or a hidden risk that comps aren't pricing in. Stress-test before assuming the spread holds.
Location & tenants
- Location reads 81/100 on livability (#3 in LA, #1,383 nationally) — a professional / high-income tenant draw. Strengths: amenities A+, commute A+, health & safety A+; Watch: crime C-, employment D.
- Orleans Parish (urban): math 11% / reading 27% proficiency, ranked #69 of 98 in LA (top 70%) — low school quality limits family demand, transient renter base, plan for 1-2y turnover; 68% free/reduced lunch — lower-income household profile, screen leases tightly.
- Market conditions: Rents flat; 350 active listings in the ZIP; 40 comparable units currently listed for rent nearby; rentals at typical pace (median 24d on market — plan ~3-4 weeks tenant-placement turnaround); 40% of comp listings sitting > 30 days — soft ceiling on asking rent; 710 units permitted in Orleans Parish in 2024 (244 in 5+ unit buildings).
- At $3,272/mo this rent would consume 75% of the median local household income ($52k/yr) (locally 1001% of renters already pay >50% of income on rent) — very limited rent-growth headroom before tenants either downsize or default.
Forward outlook
- Local home prices are declining (-3.0%/yr); year-one equity from $2k of loan paydown is wiped out by about $8k of value loss. Plan a longer hold.
- Orleans County population projected at +61% by 2050 — long-run rental-demand tailwind backs the buy-and-hold thesis.
Negotiation context
- Only 9 days on market — expect competitive offers; lowballing is unlikely to land.
- 10 sale attempts since 19y ago with the ask held roughly flat each time — persistent listings suggest the price (not the market) is what's stuck; bring a comps-based counter.
- Current owner paid $205k; 37% above their basis — modest negotiation headroom, anchor on the comps not their cost.
Risks & watch-outs
- Watch-outs: flood insurance adds $66/mo; built in 1920 — expect roof / HVAC / electrical / plumbing capex.
- Climate carrying-cost: major flood risk; severe wind risk, 99% chance of damaging wind over 30y; extreme-heat days projected 7→21/yr by 2055 (HVAC capex compounding) — expect insurance premiums to compound above CPI over the hold.
Questions for the listing agent
- Built in 1920 — when were the roof, HVAC, electrical panel, plumbing, and water heater last replaced?
- What's the actual annual flood-insurance premium (NFIP or private), and is the property in a SFHA with mandatory coverage?
- Any open or pending special assessments — roof, HVAC, plumbing, elevator, façade? What's the per-unit balance and payoff schedule, and is the seller paying it off at close or rolling it to the buyer?
- Is there a deadline driving the sale (1031 exchange, divorce, estate, relocation)? That informs how much negotiation room exists.
- What's the average days-on-market for RENTAL listings here right now (not sales)? A rising rental-DOM trend means longer vacancies and softer asking-rent achievability than the comps imply.
- What's the recent tenant-quality profile in this submarket — average credit score on applications, eviction rate, late-payment / NSF rate, and stable-employment percentage? A property-management company in the area should have these aggregated.
- How much new apartment / multifamily construction is in the pipeline within 1–3 miles? Heavy new supply (>2% of stock underway) typically softens rents 12–24 months out; light construction supports rent growth.
Investment metrics
- 1% rule
- 1.17% ✓
- Cap rate
- 8.92%
- Cash-on-cash
- 9.37%
- DSCR
- 1.42
- GRM
- 7.1
CMA / ARV
No comps found within radius.
Projected returns pro-forma
-3.0% appreciation · 0.18% rent growth · sell at horizon
- IRR
- -6.9%
- Equity multiple
- 0.75×
- Total profit
- $-19,536
- Equity at exit
- $41,749
- IRR
- -1.5%
- Equity multiple
- 0.91×
- Total profit
- $-6,819
- Equity at exit
- $24,209
Cash invested: $78,400 (down + closing). Projections, not guarantees.
Landlord ↔ Tenant lean methodology
- Overall (STATE)
- 90 Strongly Landlord-Friendly
- State Louisiana
- 90 Strongly Landlord-Friendly · R+12
- County
- — inherits STATE
- City
- — inherits STATE
ZIP-level market 70116
- Home prices YoY
- -34.5%
- Rents YoY
- 0.2%
- Active inventory
- 350
- Price-to-rent
- 7.1×
Monthly cashflow live
- Estimated rent
- $3,272 high interval (Pro) →
- Mortgage (P&I)
- −$1,468
- Tax from tax record
- −$388 /mo · $4,650/yr
- Insurance
- −$117
- Flood insurance flood zone
- −$66 /mo · $798/yr
- HOA
- −$0
- Vacancy / Maint / Mgmt
- −$687
- Net cashflow
- $546
Break-even live
UW: 25.0% down · 7.5% · 30yr · 1.5% tax · 5.0% vac · 8.0% maint · 8.0% mgmt
Financing live
Cash to close
- Down payment
- $70,000
- Closing costs
- $8,400
- Reserves months
- —
- Total cash needed
- —
Loan-product check · same deal, 3 products live
Conventional
25% down · 7.5% · 30yr
- Down + closing
- —
- Monthly P&I
- —
- Monthly cashflow
- —
- DSCR
- —
- Eligible?
- —
Personal DTI + credit; lowest rate.
DSCR
20% down · 8.5% · 30yr
- Down + closing
- —
- Monthly P&I
- —
- Monthly cashflow
- —
- DSCR
- —
- Eligible?
- —
No personal income docs; deal must DSCR.
Hard money
10% down · 12.0% · 12mo
- Down + closing
- —
- Monthly P&I
- —
- Monthly cashflow
- —
- DSCR
- —
- Eligible?
- —
Short-term bridge; refi at stabilization.
Rent comps 40 comps
| Address | Beds | Baths | Sqft | Rent | $/sqft | DOM | Units | Dist |
|---|---|---|---|---|---|---|---|---|
| 1423 N Villere St Unit A New Orleans, LA | 2.0 | 3.0 | 1964 | $2,500 | $1.27 | 43d | 1 | 0.04mi |
| 1433 Esplanade Ave New Orleans, LA | 3.0 | 2.0 | 2411 | $5,000 | $2.07 | 2d | 1 | 0.09mi |
| 1301 N Rampart St New Orleans, LA | 2.0 | 2.0–2.5 | 2929 | $7,750 | $2.65 | 19d | 2 | 0.26mi |
| 1022 Barracks St New Orleans, LA | 1.0–2.0 | 1.0–2.0 | 1233 | $4,400 | $3.57 | 43d | 1 | 0.32mi |
| 1021 Henriette Delille St New Orleans, LA | 3.0 | 2.0 | 2012 | $2,250 | $1.12 | 17d | 1 | 0.34mi |
| 928 Kerlerec St New Orleans, LA | 3.0 | 3.5 | 1684 | $2,750 | $1.63 | 3d | 1 | 0.35mi |
| 928 Kerlerec St New Orleans, LA | 3.0 | 3.5 | 1684 | $2,750 | $1.63 | 3d | 1 | 0.35mi |
| 817 Esplanade Ave Unit 1A New Orleans, LA | 2.0 | 2.5 | 1586 | $4,000 | $2.52 | 3d | 1 | 0.43mi |
| 1136 Frenchmen St New Orleans, LA | 2.0 | 1.0 | 1800 | $1,650 | $0.92 | 23d | 1 | 0.46mi |
| 1000 Saint Philip St New Orleans, LA | 3.0 | 2.5 | 2650 | $4,800 | $1.81 | 43d | 1 | 0.46mi |
| 839 Dumaine St New Orleans, LA | 3.0 | 4.0 | 2740 | $6,500 | $2.37 | 43d | 1 | 0.56mi |
| 1936 N Johnson St Unit 36 New Orleans, LA | 3.0 | 2.0 | 1844 | $2,400 | $1.30 | 23d | 1 | 0.60mi |
| 1938 N Johnson St Unit 38 New Orleans, LA | 3.0 | 2.0 | 1844 | $2,400 | $1.30 | 23d | 1 | 0.60mi |
| 1837 Touro St New Orleans, LA | 3.0 | 1.0 | 1994 | $2,000 | $1.00 | 23d | 1 | 0.64mi |
| 618 N Rampart St #204 New Orleans, LA | 3.0 | 2.5 | 1904 | $4,500 | $2.36 | 43d | 1 | 0.64mi |
| 2331 Columbus St New Orleans, LA | 3.0 | 1.0 | 1976 | $1,850 | $0.94 | 23d | 1 | 0.67mi |
| 2317 N Rampart St Unit 1272378P New Orleans, LA | 3.0–6.0 | 2.0–4.0 | 1581 | $2,165 | $1.37 | 3d | 2 | 0.67mi |
| 2320 N Rampart St New Orleans, LA | 3.0 | 3.0 | 2317 | $3,700 | $1.60 | 43d | 1 | 0.68mi |
| 824 Royal St Unit G New Orleans, LA | 2.0 | 2.0 | 2080 | $3,300 | $1.59 | 43d | 1 | 0.69mi |
| 1831 N Miro St New Orleans, LA | 3.0 | 2.0 | 1882 | $2,500 | $1.33 | 43d | 1 | 0.72mi |
| 751 Chartres St New Orleans, LA | 2.0–3.0 | 2.0 | 1461 | $2,610 | $1.79 | 43d | 1 | 0.76mi |
| 627 St Peter New Orleans, LA | 2.0 | 2.5 | 2174 | $5,500 | $2.53 | 23d | 1 | 0.77mi |
| 527 Saint Ann St Unit 3 New Orleans, LA | 3.0 | 2.0 | 1687 | $3,500 | $2.07 | 43d | 1 | 0.78mi |
| 515 Saint Ann St Unit 3 New Orleans, LA | 3.0 | 2.0 | 1644 | $3,600 | $2.19 | 44d | 1 | 0.80mi |
| 324 N Roman St New Orleans, LA | 3.0 | 3.0 | 2100 | $2,500 | $1.19 | 43d | 1 | 0.82mi |
| 535 Decatur St Unit 3 New Orleans, LA | 3.0 | 2.0 | 1600 | $2,800 | $1.75 | 11d | 1 | 0.91mi |
| 939 Iberville St New Orleans, LA | 1.0–3.0 | 1.0 | 1502 | $3,100 | $2.06 | 11d | 7 | 0.94mi |
| 2664 Lepage St New Orleans, LA | 3.0 | 2.0 | 1750 | $2,725 | $1.56 | 43d | 1 | 0.97mi |
| 324 Chartres St Unit B New Orleans, LA | 2.0 | 2.0 | 1750 | $2,250 | $1.29 | 17d | 1 | 0.99mi |
| 1011 Canal St Unit 1513926P New Orleans, LA | 1.0–4.0 | 1.0–4.0 | 1016 | $9,602 | $9.45 | 1d | 2 | 0.99mi |
| 124 N Galvez St Unit 1 New Orleans, LA | 2.0 | 2.0 | 2200 | $2,200 | $1.00 | 23d | 1 | 1.03mi |
| 215 Decatur St Unit 405 New Orleans, LA | 2.0 | 2.5 | 1650 | $3,450 | $2.09 | 43d | 1 | 1.07mi |
| 210 Baronne St New Orleans, LA | 1.0–2.0 | 1.0–2.5 | 1530 | $5,000 | $3.27 | 2d | 26 | 1.16mi |
| 2130 N Broad St New Orleans, LA | 2.0 | 1.0 | 1579 | $1,350 | $0.85 | 23d | 1 | 1.17mi |
| 522 Montegut St New Orleans, LA | 1.0–2.0 | 1.0–2.0 | 1256 | $3,500 | $2.79 | 2d | 12 | 1.18mi |
| 1038 Montegut St New Orleans, LA | 3.0 | 2.5 | 2250 | $4,200 | $1.87 | 23d | 1 | 1.19mi |
| 1038 Montegut St New Orleans, LA | 3.0 | 2.5 | 2250 | $4,200 | $1.87 | 43d | 1 | 1.19mi |
| 2228 Arts St New Orleans, LA | 3.0 | 2.0 | 2270 | $1,675 | $0.74 | 3d | 1 | 1.20mi |
| 1928 Franklin Ave New Orleans, LA | 2.0 | 2.5 | 2840 | $2,500 | $0.88 | 10d | 1 | 1.21mi |
| 3024 Esplanade Ave New Orleans, LA | 3.0 | 2.5 | 2300 | $4,500 | $1.96 | 43d | 1 | 1.23mi |
HOA detail condo
- Monthly dues
- $0 · $0/yr
- Assessments
- None detected in remarks — confirm with the listing agent.
Listing history 8 events
-
2026-06-18status $280,000 Pending 9 DOM
-
2026-06-18days on market $280,000 Active 9 DOM
-
2026-06-17days on market $280,000 Active 8 DOM
-
2026-06-16days on market $280,000 Active 7 DOM
-
2026-06-15days on market $280,000 Active 6 DOM
-
2026-06-13days on market $280,000 Active 4 DOM
-
2026-06-10remarks 699-char remark
-
2026-06-10$280,000 Active 1 DOM
ⓘ Source: listings_history table (triggers on properties + properties_extension) + one-shot
backfill from property_details.listing_events for pre-trigger history.
Tax reassessment forecast LA · Resets to sale price
- Current annual tax
- $4,650 · $388/mo
- Projected year-2 tax
- $4,650 · $388/mo
- Expected delta
- $0/yr ($0/mo · 0.0%)
ⓘ Screening estimate from a state-policy table — verify with the county assessor before closing.
Climate risk First Street
- Flood 7/10 Severe FEMA zone X · 60% chance over 30 yrs
- Wildfire 1/10 Low
- Heat 10/10 Extreme 7 d/yr ≥108°F today · 21 d/yr by 30 yrs out
- Wind 10/10 Extreme 99% chance of damaging wind over 30 yrs
- Air quality 4/10 Moderate 4 unhealthy d/yr today · 4 by 30 yrs out
Nearby sold comps map
Loading sold comps map…
Walkable amenities ~0.75 mi
Loading nearby amenities…
Taxation est. · year 1
- Rental income
- $39,261
- − Mortgage interest
- −$15,684
- − Property taxes
- −$4,650
- − Insurance
- −$2,198
- − Repairs & maintenance
- −$3,141
- − Management
- −$3,141
- − Depreciation
- −$8,145
- Taxable income
- $2,301
- Est. tax owed @ 24.0%
- −$552
- After-tax cash flow
- $5,995/yr
For passive investors: Depreciation is non-cash, so a rental often shows a tax loss while cash-flowing — sheltering income. Rental losses are passive: they offset passive income freely, and up to $25,000/yr can offset ordinary (W-2) income if you actively participate and your MAGI is under $100k (phasing out to $0 by $150k); unused losses carry forward. On sale, claimed depreciation is recaptured at up to 25%, and gains may owe capital-gains tax (a 1031 exchange can defer both). Figures are a year-1 estimate at your 24.0% rate — not tax advice; consult a CPA.
Schools (NCES district)
- District
- Orleans Parish
- NCES district ID
- 2201170
- Math proficiency
- 11% ▼ -52.00%
- Reading proficiency
- 27% ▼ -46.00%
- Median HH income
- $37,011
- Composite
- 15.78/100
- National rank
- #9271
- State rank
- #69 of 98 in LA
Livability — New Orleans
- Score
- 81/100
- State rank
- #3
- US rank
- #1383
Category grades
Schools grade is shown separately in the Schools card above.
Census & demographics
- Census place
- New Orleans, LA
- County
- Orleans Parish · 338,817 people
- City population
- 338,817
- Metro
- New Orleans-Metairie, LA
- Population (ZIP)
- 10,404
- Household income
- $52,306
- Rent vs Own
- Severe rent burden
- 1001.0
Population outlook (Orleans County) Hauer SSP2
- Today (2025)
- 513,025 people
- By 2030
- 575,781 · +12.2%
- By 2040
- 700,174 · +36.5%
- By 2050
- 826,541 · +61.1%
- By 2075
- 1,123,374 · +119.0%
- By 2100
- 1,355,609 · +164.2%
Race, ethnicity, and origin ACS 2023
- Neighborhood character
- Diverse neighborhood (Simpson 0.63)
- Race & ethnicity
- White 45% Black 40% Hispanic / Latino 10% Two or more races 8%
- Hispanic origin (detail)
- Mexican 1% Cuban 3%
- Common ancestry
- Lithuanian 6% Slovak 3% Romanian 3%
- Foreign-born
- 5% · Canada
- Languages at home
- 90% English-only · Spanish 6% French/Haitian/Cajun 2%
Political lean MEDSL · Orleans
- 2024 margin
- Solid D (+67.0) · D 82.2% · R 15.2% · Other 2.7%
- 2008→2024 swing
- +6.7pp toward D · 2008: 60.3pp · 2024: 67.0pp
- All cycles
- 2024: D+67.0 2020: D+68.2 2016: D+66.2 2012: D+62.5 2008: D+60.3
Not yet ingested
- Civics
- —
Market trends
- HPI YoY
- ▼ -144.83%
- Current HPI
- 275.5453
- Rent YoY
- ▲ 0.18%
- Metro
- New Orleans-Metairie, LA
- State GDP YoY
- ▲ 3.29%
- F500 in state
- 10
Industry mix (Fortune 500 HQ in LA)
| Industry | F500 HQs | Revenue |
|---|---|---|
| Telecommunications | 2 | $23B |
|
||
| Utilities | 1 | $12B |
|
||
| Wholesale / Distribution | 1 | $5B |
|
||
| Advertising | 1 | $2B |
|
||
Price history
+211.1% since first listed16 events — show timeline
- 2026-06-09 Listed $280,000 AcadianaMLS
- 2026-06-09 Listed $280,000 GSREIN
- 2024-12-17 Price Changed $330,000 AcadianaMLS
- 2024-12-13 Price Changed $330,000 GSREIN
- 2024-09-13 Price Changed $350,000 GSREIN
- 2024-08-05 Price Changed $380,000 GSREIN
- 2024-07-10 Listed $350,000 AcadianaMLS
- 2011-08-23 Sold (MLS) $205,000 GSREIN
- 2011-03-03 Listed $195,000 GSREIN
- 2011-03-03 Listed $195,000 AcadianaMLS
- 2011-01-03 Listed $195,000 GSREIN
- 2011-01-03 Listed $195,000 AcadianaMLS
- 2010-07-09 Listed $195,000 GSREIN
- 2010-07-09 Listed $195,000 AcadianaMLS
- 2007-03-22 Sold (MLS) $90,000 GSREIN
- 2007-02-22 Listed $90,000 GSREIN
Property tax history
+3.9%/yrLatest (2026): $4,650 · +1.1% YoY. Source: county tax records.
Cash-flow waterfall
monthlySold comps — $/sqft
last 12 mo · ≤1 miLoading sold comps…