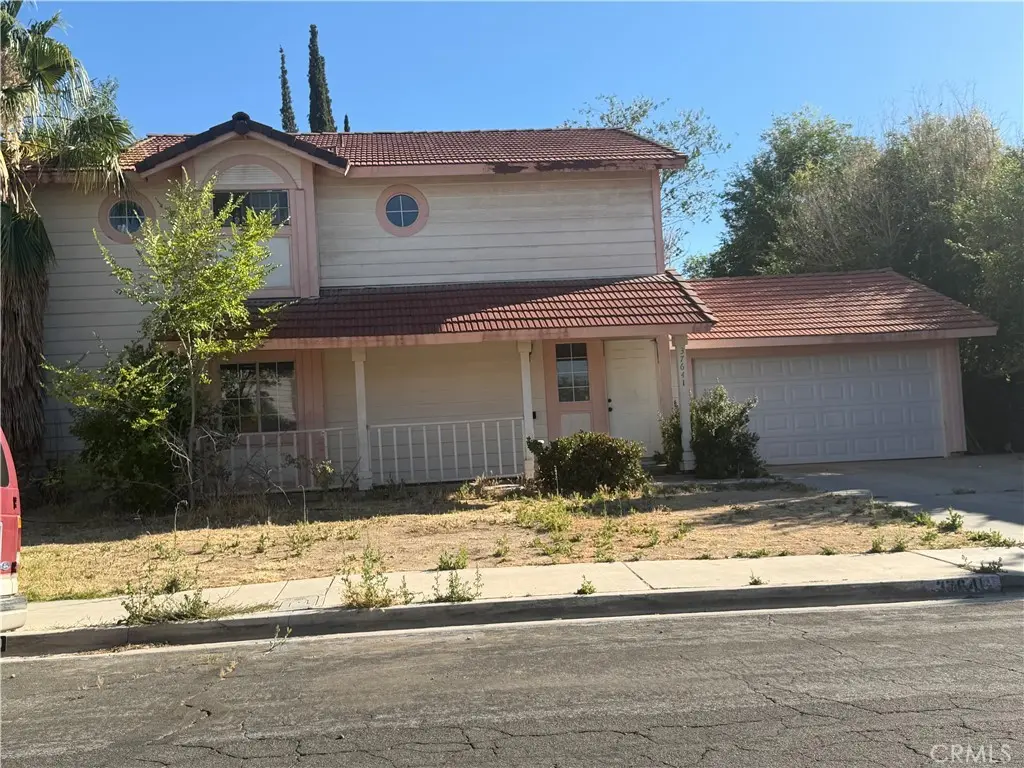
37641 Sandra · Palmdale, CA
Flood risk 1/10 · Minimal
- FEMA flood zone
- X (unshaded)
- Chance of flooding over 30 yrs
- 0.0%
- Est. flood insurance / yr
- $507 – $1,088
Fire risk 8/10 · Major
- Est. fire insurance / yr
- $659 – $1,223
Heat risk 6/10 · Moderate
- Hot days now (above 100°F)
- 5 days/yr
- Hot days in 30 yrs
- 13 days/yr
Wind risk 1/10 · Minimal
- Chance of severe wind over 30 yrs
- —
Air-quality risk 10/10 · Severe
- Unhealthy air days now
- 25 days/yr
- Unhealthy air days in 30 yrs
- 29 days/yr
Risk factors via First Street. Map © Google.
Why this score? — see what drove the D+ grade
The composite is a weighted blend of 9 inputs, each scored 0–100. Each bar is that input's sub-score; the figure is the points it added to the 100-point composite (weight × sub-score).
- ARV discount +15.0/15.0
- Cash flow +13.7/30.0
- DSCR +4.1/10.0
- 1% rule +3.1/10.0
- Rent growth +2.9/5.0
- Livability +2.8/5.0
- Schools +2.5/10.0
- Condition / age +2.5/5.0
- Appreciation +0.0/10.0
$349,000
🖨 Deal sheet (PDF) 📄 Offer letter ✓ Due diligence
Listing remarks
PROBATE SALE – INVESTOR SPECIAL! Opportunity knocks at 37641 Sandra Lane in Palmdale. This 3-bedroom, 3-bath home is a major fixer with significant deferred maintenance and repairs needed throughout. Ideal for investors, contractors, flippers, or cash buyers looking for their next project. The property offers a functional floor plan and ample potential for renovation, value-add improvements, or long-term investment. Sold in its present "AS-IS" condition with no repairs, credits, or warranties from the seller. Buyer to conduct their own investigations regarding condition, permits, zoning, and all aspects of the property. Subject to Probate Court requirements, if applicable. B
Key facts
- 6,978 sq ft lot
- 2 garage spots
- Built 1984
Property features AI
Finance
- Financial info: Total units: 1; Assessments: Unknown
- HOA & community: Street lighting; Sidewalks
Exterior
- Parking: Attached garage; Two garage spaces (two total parking spaces)
- Utilities: Public sewer; District/public water
- Home design: Two total stories; Single-family house; No accessory dwelling unit
- Construction: Year built per assessor; No common walls
- Exterior features: House; No pool; Lot characterized as 0-1 unit/acre; Lot size and elevation per assessor's data
Interior
- Bedrooms: One bedroom on the main level
- Bathrooms: Three full bathrooms total; One full bathroom on the main level
- Heating & cooling: Central furnace heating; Cooling available (see remarks)
- Interior features: Two-story layout; Main-level entry; Main level has one bedroom and one bathroom
- Laundry & utility: Laundry available (details in remarks)
Neighborhood map
What this means for you Summary
Snapshot
- This is a 3-bed/3.0-bath single-family listed at $349k.
Deal economics
- At list price, monthly cash flow is $26 ($312/yr) — positive.
- The deal already cash-flows at list — no discount required.
- To meet the 1% rule (rent ≥ 1% of price), the offer needs to be $282k (19.3% below list).
- Recommended offer: $282k (19.3% below list) — sets the bar for 1% rule.
- Cap rate 6.4% vs local median 4.5% in Palmdale — top-decile yield for the area; either an underpriced asset or a hidden risk that comps aren't pricing in. Stress-test before assuming the spread holds.
Location & tenants
- Location reads 55/100 on livability (#861 in CA) — a working-class tenant base; expect higher turnover. Strengths: housing A+; Watch: schools F, crime F, amenities F.
- Palmdale Elementary (suburban): math 20% / reading 31% proficiency, ranked #1,147 of 1,400 in CA (top 82%) — low school quality limits family demand, transient renter base, plan for 1-2y turnover; 69% free/reduced lunch — lower-income household profile, screen leases tightly.
- Market conditions: Rents rising (+1.8%/yr); 408 active listings in the ZIP; 10 comparable units currently listed for rent nearby; rentals leasing fast (median 0d on market — plan ~1-2 weeks tenant-placement turnaround); 19,697 units permitted in Los Angeles County in 2024 (9,426 in 5+ unit buildings).
- At $2,818/mo this rent would consume 54% of the median local household income ($62k/yr) (locally 4384% of renters already pay >50% of income on rent) — very limited rent-growth headroom before tenants either downsize or default.
Forward outlook
- Local home prices are declining (-3.0%/yr); year-one equity from $2k of loan paydown is wiped out by about $10k of value loss. Plan a longer hold.
- Los Angeles County population projected at +9% by 2050 — modest demand growth; plan on rents tracking national, not racing it.
Negotiation context
- Only 10 days on market — expect competitive offers; lowballing is unlikely to land.
- 2 sale attempts since 31y ago with the ask held roughly flat each time — persistent listings suggest the price (not the market) is what's stuck; bring a comps-based counter.
- Current owner paid $73k; list at $349k implies a 378% gain — meaningful room to come down on a strong offer.
Risks & watch-outs
- Climate carrying-cost: severe wildfire risk; extreme-heat days projected 5→13/yr by 2055 (HVAC capex compounding) — expect insurance premiums to compound above CPI over the hold.
Questions for the listing agent
- Is there a deadline driving the sale (1031 exchange, divorce, estate, relocation)? That informs how much negotiation room exists.
- Schools are F-rated, which usually means shorter tenancies and higher turnover. Who's the typical renter profile here, and what's been the actual vacancy rate?
- Crime grade is F in this area — have there been break-ins, vandalism, or insurance claims at this property in the last 3 years? What carrier currently insures it and at what premium?
- The area grade is low — what's the realistic commute time and amenity access for the typical tenant pool here? Any planned neighborhood developments (good or bad) we should know about?
- What's the average days-on-market for RENTAL listings here right now (not sales)? A rising rental-DOM trend means longer vacancies and softer asking-rent achievability than the comps imply.
- What's the recent tenant-quality profile in this submarket — average credit score on applications, eviction rate, late-payment / NSF rate, and stable-employment percentage? A property-management company in the area should have these aggregated.
- How much new for-sale + rental construction is in the pipeline within 1–3 miles? Heavy new supply typically softens prices + rents 12–24 months out; constrained supply supports both.
Investment metrics
- 1% rule
- 0.81% ✗
- Cap rate
- 6.38%
- Cash-on-cash
- 0.32%
- DSCR
- 1.01
- GRM
- 10.3
CMA / ARV
- ARV (on-the-fly)
- $492,012
- Comps found
- 12
Show comp detail 12 sales within ~0.75 mi
| Address | Dist | Beds/Ba | Sqft | Sold | Price | $/sf | Match |
|---|---|---|---|---|---|---|---|
| 37727 Dixie Dr | 0.14mi | 3/3.0 | 1,470 (-6%) | 10mo | $490,000 | $333 | 76 |
| 37707 Dixie Dr | 0.11mi | 3/2.0 | 1,470 (-6%) | 8mo | $465,000 | $316 | 75 |
| 130 Mountainside Dr | 0.21mi | 3/2.0 | 1,426 (-8%) | 0mo | $505,000 | $354 | 72 |
| 234 Tahquitz | 0.15mi | 3/3.0 | 1,732 (+11%) | 7mo | $455,000 | $263 | 68 |
| 37437 Conifer | 0.49mi | 3/2.0 | 1,509 (-3%) | 0mo | $310,000 | $205 | 68 |
| 125 E Avenue R4 | 0.18mi | 3/2.5 | 1,737 (+12%) | 12mo | $468,000 | $269 | 60 |
| 206 Tahquitz Pl | 0.14mi | 3/2.0 | 1,346 (-14%) | 11mo | $430,000 | $319 | 58 |
| 37825 E 5th St | 0.39mi | 3/2.0 | 1,366 (-12%) | 1mo | $460,000 | $337 | 57 |
| 555 Conifer Dr | 0.56mi | 4/2.0 (+1) | 1,509 (-3%) | 9mo | $510,000 | $338 | 52 |
| 38248 Gunton Dr | 0.74mi | 3/2.0 | 1,550 (-0%) | 10mo | $450,000 | $290 | 52 |
| 37457 3rd St E | 0.24mi | 4/2.0 (+1) | 1,748 (+12%) | 13mo | $537,000 | $307 | 49 |
| 38225 Gunton Dr | 0.70mi | 3/2.0 | 1,700 (+9%) | 11mo | $434,900 | $256 | 39 |
Match score weights: distance 35% · size 25% · config 20% · recency 20%. Top-matched comps best support the ARV.
Projected returns pro-forma
-3.0% appreciation · 1.76% rent growth · sell at horizon
- IRR
- -17.1%
- Equity multiple
- 0.40×
- Total profit
- $-58,456
- Equity at exit
- $52,037
- IRR
- -11.3%
- Equity multiple
- 0.36×
- Total profit
- $-63,024
- Equity at exit
- $30,175
Cash invested: $97,720 (down + closing). Projections, not guarantees.
Landlord ↔ Tenant lean methodology
- Overall (STATE)
- 18 Strongly Tenant-Friendly
- State California
- 18 Strongly Tenant-Friendly · D+13
- County
- — inherits STATE
- City
- — inherits STATE
ZIP-level market 93550
- Home prices YoY
- -29.4%
- Rents YoY
- 1.8%
- Active inventory
- 408
- Price-to-rent
- 10.3×
Monthly cashflow live
- Estimated rent
- $2,818 high interval (Pro) →
- Mortgage (P&I)
- −$1,830
- Tax from tax record
- −$224 /mo · $2,690/yr
- Insurance
- −$145
- HOA
- −$0
- Vacancy / Maint / Mgmt
- −$592
- Net cashflow
- $26
Break-even live
Sensitivity live
| Price | -10% $224 | -5% $125 | +0% $26 | +5% $-73 | +10% $-172 |
|---|---|---|---|---|---|
| Rent | -10% $-197 | -5% $-85 | +0% $26 | +5% $137 | +10% $249 |
| Rate | -1.0pp $202 | -0.5pp $115 | base $26 | +0.5pp $-64 | +1.0pp $-156 |
UW: 25.0% down · 7.5% · 30yr · 1.5% tax · 5.0% vac · 8.0% maint · 8.0% mgmt
Financing live
Cash to close
- Down payment
- $87,250
- Closing costs
- $10,470
- Reserves months
- —
- Total cash needed
- —
Loan-product check · same deal, 3 products live
Conventional
25% down · 7.5% · 30yr
- Down + closing
- —
- Monthly P&I
- —
- Monthly cashflow
- —
- DSCR
- —
- Eligible?
- —
Personal DTI + credit; lowest rate.
DSCR
20% down · 8.5% · 30yr
- Down + closing
- —
- Monthly P&I
- —
- Monthly cashflow
- —
- DSCR
- —
- Eligible?
- —
No personal income docs; deal must DSCR.
Hard money
10% down · 12.0% · 12mo
- Down + closing
- —
- Monthly P&I
- —
- Monthly cashflow
- —
- DSCR
- —
- Eligible?
- —
Short-term bridge; refi at stabilization.
Rent comps 10 comps
| Address | Beds | Baths | Sqft | Rent | $/sqft | DOM | Units | Dist |
|---|---|---|---|---|---|---|---|---|
| 239 Katherine Ct Palmdale, CA | 3.0 | 3.0 | 1386 | $2,900 | $2.09 | 0d | 1 | 0.07mi |
| 38232 Delacour Dr Palmdale, CA | 3.0 | 2.0 | 1328 | $3,000 | $2.26 | 0d | 1 | 0.67mi |
| 38225 9th St E Unit 1 Palmdale, CA | 2.0 | 2.5 | 1500 | $2,500 | $1.67 | 0d | 1 | 0.96mi |
| 38457 Sumac Ave Palmdale, CA | 3.0 | 2.0 | 1125 | $2,900 | $2.58 | 0d | 1 | 1.02mi |
| 38454 Sumac Ave Palmdale, CA | 4.0 | 2.0 | 1433 | $2,990 | $2.09 | 0d | 1 | 1.03mi |
| 38508 Sumac Ave Palmdale, CA | 3.0 | 2.0 | 1125 | $2,300 | $2.04 | 0d | 1 | 1.08mi |
| 1138 E Avenue R7 Palmdale, CA | 3.0 | 2.0 | 1264 | $2,455 | $1.94 | 14d | 1 | 1.09mi |
| 37938 Palm Vista Ave Unit A Palmdale, CA | 3.0 | 1.0 | 1223 | $2,150 | $1.76 | 0d | 1 | 1.13mi |
| 504 East Avenue Q3 Apt 3 Palmdale, CA | 2.0 | 1.5 | 1150 | $1,650 | $1.43 | 0d | 1 | 1.23mi |
| 144 E Avenue Q Palmdale, CA | 4.0 | 1.5 | 1150 | $2,499 | $2.17 | 0d | 1 | 1.37mi |
Listing history 8 events
-
2026-06-21days on market $349,000 Active 10 DOM
-
2026-06-18days on market $349,000 Active 7 DOM
-
2026-06-17days on market $349,000 Active 6 DOM
-
2026-06-16days on market $349,000 Active 5 DOM
-
2026-06-15days on market $349,000 Active 4 DOM
-
2026-06-13days on market $349,000 Active 2 DOM
-
2026-06-13remarks 683-char remark
-
2026-06-13$349,000 Active 1 DOM
ⓘ Source: listings_history table (triggers on properties + properties_extension) + one-shot
backfill from property_details.listing_events for pre-trigger history.
Tax reassessment forecast CA · Resets to sale price
- Current annual tax
- $2,690 · $224/mo
- Projected year-2 tax
- $2,690 · $224/mo
- Expected delta
- $0/yr ($0/mo · 0.0%)
ⓘ Screening estimate from a state-policy table — verify with the county assessor before closing.
Climate risk First Street
- Flood 1/10 Low FEMA zone X (unshaded) · 0% chance over 30 yrs
- Wildfire 8/10 Severe
- Heat 6/10 Major 5 d/yr ≥100°F today · 13 d/yr by 30 yrs out
- Wind 1/10 Low
- Air quality 10/10 Extreme 25 unhealthy d/yr today · 29 by 30 yrs out
Nearby sold comps map
Loading sold comps map…
Walkable amenities ~0.75 mi
Loading nearby amenities…
Taxation est. · year 1
- Rental income
- $33,810
- − Mortgage interest
- −$19,549
- − Property taxes
- −$2,690
- − Insurance
- −$1,745
- − Repairs & maintenance
- −$2,705
- − Management
- −$2,705
- − Depreciation
- −$10,153
- Taxable loss
- −$5,737
- Est. tax savings @ 24.0%
- +$1,377
- After-tax cash flow
- $1,689/yr
For passive investors: Depreciation is non-cash, so a rental often shows a tax loss while cash-flowing — sheltering income. Rental losses are passive: they offset passive income freely, and up to $25,000/yr can offset ordinary (W-2) income if you actively participate and your MAGI is under $100k (phasing out to $0 by $150k); unused losses carry forward. On sale, claimed depreciation is recaptured at up to 25%, and gains may owe capital-gains tax (a 1031 exchange can defer both). Figures are a year-1 estimate at your 24.0% rate — not tax advice; consult a CPA.
Schools (NCES district)
- District
- Palmdale Elementary
- NCES district ID
- 0629580
- Math proficiency
- 20% ▲ 1.00%
- Reading proficiency
- 31% ▲ 1.00%
- Median HH income
- $48,652
- Composite
- 25.34/100
- National rank
- #12888
- State rank
- #1147 of 1400 in CA
Livability — Palmdale
- Score
- 55/100
- State rank
- #861
- US rank
- #23501
Category grades
Schools grade is shown separately in the Schools card above.
Census & demographics
- Census place
- Palmdale, CA
- County
- Los Angeles County · 9,444,647 people
- City population
- 177,644
- Metro
- Los Angeles-Long Beach-Anaheim, CA
- Population (ZIP)
- 80,645
- Household income
- $62,078
- Rent vs Own
- Severe rent burden
- 4384.0
Population outlook (Los Angeles County) Hauer SSP2
- Today (2025)
- 10,940,515 people
- By 2030
- 11,256,481 · +2.9%
- By 2040
- 11,729,929 · +7.2%
- By 2050
- 11,948,407 · +9.2%
- By 2075
- 11,818,114 · +8.0%
- By 2100
- 10,842,928 · -0.9%
Race, ethnicity, and origin ACS 2023
- Neighborhood character
- Predominantly Hispanic (69%)
- Race & ethnicity
- Hispanic / Latino 69% Two or more races 15% Black 14% White 12% Asian 3% Native American 2%
- Hispanic origin (detail)
- Mexican 52%
- Foreign-born
- 26% · Canada
- Languages at home
- 42% English-only · Spanish 55% Tagalog/Filipino 1% Other Asian/Pacific 1%
Political lean MEDSL · Los Angeles
- 2024 margin
- Solid D (+32.9) · D 64.8% · R 31.9% · Other 3.3%
- 2008→2024 swing
- -7.4pp toward R · 2008: 40.4pp · 2024: 32.9pp
- All cycles
- 2024: D+32.9 2020: D+44.2 2016: D+48.0 2012: D+40.0 2008: D+40.4
Not yet ingested
- Civics
- —
Market trends
- HPI YoY
- ▼ -183.38%
- Current HPI
- 440.8844
- Rent YoY
- ▲ 1.76%
- Metro
- Los Angeles-Long Beach-Anaheim, CA
- State GDP YoY
- ▲ 3.21%
- F500 in state
- 116
Industry mix (Fortune 500 HQ in CA)
| Industry | F500 HQs | Revenue |
|---|---|---|
| Technology | 27 | $1,492B |
|
||
| Financial Services | 3 | $174B |
|
||
| Retail | 3 | $44B |
|
||
| Insurance | 3 | $26B |
|
||
| Media / Entertainment | 2 | $115B |
|
||
| Pharmaceuticals / Biotech | 2 | $62B |
|
||
Price history
+326.1% since first listed4 events — show timeline
- 2026-06-11 Listed $349,000 CRMLS
- 2015-03-27 Listing Removed — AVMLS
- 1996-11-08 Sold (Public Records) $73,000 Public Records
- 1995-03-30 Listed $81,900 AVMLS
Property tax history
+3.2%/yrLatest (2025): $2,690 · +8.6% YoY. Source: county tax records.
Cash-flow waterfall
monthlySold comps — $/sqft
last 12 mo · ≤1 miLoading sold comps…