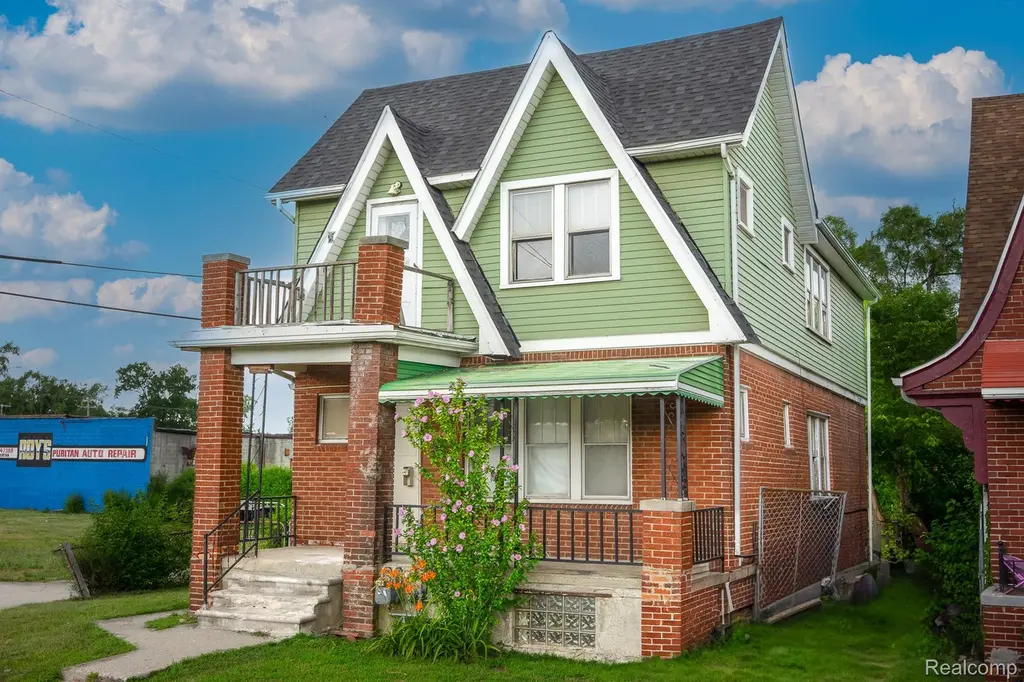
15930 Turner St · Detroit, MI
Flood risk 1/10 · Minimal
- FEMA flood zone
- X (unshaded)
- Chance of flooding over 30 yrs
- 0.0%
- Est. flood insurance / yr
- $473 – $860
Fire risk 1/10 · Minimal
- Est. fire insurance / yr
- $784 – $1,456
Heat risk 3/10 · Minor
- Hot days now (above 97°F)
- 7 days/yr
- Hot days in 30 yrs
- 15 days/yr
Wind risk 2/10 · Minimal
- Chance of severe wind over 30 yrs
- —
Air-quality risk 4/10 · Minor
- Unhealthy air days now
- 4 days/yr
- Unhealthy air days in 30 yrs
- 6 days/yr
Risk factors via First Street. Map © Google.
Why this score? — see what drove the C+ grade
The composite is a weighted blend of 9 inputs, each scored 0–100. Each bar is that input's sub-score; the figure is the points it added to the 100-point composite (weight × sub-score).
- Cash flow +30.0/30.0
- 1% rule +10.0/10.0
- DSCR +10.0/10.0
- Rent growth +4.0/5.0
- Livability +3.7/5.0
- Condition / age +2.5/5.0
- Schools +1.3/10.0
- ARV discount +0.0/15.0
- Appreciation +0.0/10.0
$99,800
🖨 Deal sheet 📄 Offer letter ✓ Due diligence
Listing remarks MLS
SELLER FINANCING / LAND CONTRACT TERMS AVAILABLE AT 115,000 PURCHASE PRICE, 30,000 DOWN PAYMENT, 8% INTEREST, 96 MONTH TERM. 1031 / MONTH. Seller financing available—terms negotiable! A diamond in the rough with key upgrades already done: brand new roof and newly built back steps/upper balcony. This 2-family property is the perfect foundation for your next flip, rental, or house-hack strategy. Conveniently located near highways, schools, parks, and shopping, it’s poised for future value with the right vision. Don’t miss out—schedule your showing today and make your move. Purchaser to pay 395 processing fee. As-is sale. * 2500 EMD to be held at the seller's title company *
Key facts
- 5,227 sq ft lot
- 2 parking spots
- Built 1927
Neighborhood map
What this means for you Summary
Snapshot
- This is a 6-bed/1.5-bath townhouse listed at $100k.
Deal economics
- At list price, monthly cash flow is $451 ($5k/yr) — positive.
- The deal already cash-flows at list — no discount required.
- Meets the 1% rule at list price ($2k rent vs $100k).
Location & tenants
- Location reads 73/100 on livability (#218 in MI) — a middle-class / working-renter tenant base. Strengths: amenities A+, commute A+, cost of living A+; Watch: schools F, crime F, employment F.
- Detroit Public Schools Community District (urban): math 10% / reading 24% proficiency, ranked #499 of 540 in MI (top 92%) — low school quality limits family demand, transient renter base, plan for 1-2y turnover; 90% free/reduced lunch — lower-income household profile, screen leases tightly.
- Market conditions: Rents rising fast (+6.1%/yr); 346 active listings in the ZIP; 1 comparable units currently listed for rent nearby; lower-income renter base — watch delinquency; 2,639 units permitted in Wayne County in 2024 (1,216 in 5+ unit buildings).
- At $1,664/mo this rent would consume 60% of the median local household income ($33k/yr) (locally 2172% of renters already pay >50% of income on rent) — very limited rent-growth headroom before tenants either downsize or default.
Forward outlook
- Local home prices are declining (-3.0%/yr); year-one equity from $690 of loan paydown is wiped out by about $3k of value loss. Plan a longer hold.
- Wayne County population projected at -17% by 2050 — secular population decline; favor cash flow + early exit over multi-decade hold.
- At projected returns (-3.0% appreciation + 6.1% rent growth), your $28k cash investment doubles in ~6 years — after that, you're playing with house money.
Negotiation context
- Only 1 days on market — expect competitive offers; lowballing is unlikely to land.
- 8 sale attempts since 4y ago with the ask held roughly flat each time — persistent listings suggest the price (not the market) is what's stuck; bring a comps-based counter.
Risks & watch-outs
- Watch-outs: property tax is 3.6% of price; built in 1927 — expect roof / HVAC / electrical / plumbing capex.
Questions for the listing agent
- Built in 1927 — when were the roof, HVAC, electrical panel, plumbing, and water heater last replaced?
- Property tax is high relative to price — has the assessment been appealed recently, and will the sale trigger a re-assessment?
- Is there a deadline driving the sale (1031 exchange, divorce, estate, relocation)? That informs how much negotiation room exists.
- Schools are F-rated, which usually means shorter tenancies and higher turnover. Who's the typical renter profile here, and what's been the actual vacancy rate?
- Crime grade is F in this area — have there been break-ins, vandalism, or insurance claims at this property in the last 3 years? What carrier currently insures it and at what premium?
- What's the average days-on-market for RENTAL listings here right now (not sales)? A rising rental-DOM trend means longer vacancies and softer asking-rent achievability than the comps imply.
- What's the recent tenant-quality profile in this submarket — average credit score on applications, eviction rate, late-payment / NSF rate, and stable-employment percentage? A property-management company in the area should have these aggregated.
- How much new for-sale + rental construction is in the pipeline within 1–3 miles? Heavy new supply typically softens prices + rents 12–24 months out; constrained supply supports both.
Investment metrics
- 1% rule
- 1.67% ✓
- Cap rate
- 11.72%
- Cash-on-cash
- 19.37%
- DSCR
- 1.86
- GRM
- 5.0
CMA / ARV
- ARV (median comp)
- $74,458
- List price
- $99,800
- Delta
- 34.04%
- Verdict
- OVERPRICED
- Comps
- 20 within 1.0 mi
Projected returns pro-forma
-3.0% appreciation · 6.14% rent growth · sell at horizon
- IRR
- 15.4%
- Equity multiple
- 1.65×
- Total profit
- $18,112
- Equity at exit
- $14,881
- IRR
- 26.7%
- Equity multiple
- 3.76×
- Total profit
- $77,034
- Equity at exit
- $8,629
Cash invested: $27,944 (down + closing). Projections, not guarantees.
Landlord ↔ Tenant lean methodology
- Overall (STATE)
- 62 Landlord-Friendly
- State Michigan
- 62 Landlord-Friendly · EVEN
- County
- — inherits STATE
- City
- — inherits STATE
ZIP-level market 48238
- Home prices YoY
- -14.4%
- Rents YoY
- 6.1%
- Active inventory
- 346
- Price-to-rent
- 5.0×
Monthly cashflow live
- Estimated rent
- $1,664 medium interval (Pro) →
- Mortgage (P&I)
- −$523
- Tax from tax record
- −$299 /mo · $3,582/yr
- Insurance
- −$42
- HOA
- −$0
- Vacancy / Maint / Mgmt
- −$349
- Net cashflow
- $451
Break-even live
UW: 25.0% down · 7.5% · 30yr · 1.5% tax · 5.0% vac · 8.0% maint · 8.0% mgmt
Financing live
Cash to close
- Down payment
- $24,950
- Closing costs
- $2,994
- Reserves months
- —
- Total cash needed
- —
Loan-product check · same deal, 3 products live
Conventional
25% down · 7.5% · 30yr
- Down + closing
- —
- Monthly P&I
- —
- Monthly cashflow
- —
- DSCR
- —
- Eligible?
- —
Personal DTI + credit; lowest rate.
DSCR
20% down · 8.5% · 30yr
- Down + closing
- —
- Monthly P&I
- —
- Monthly cashflow
- —
- DSCR
- —
- Eligible?
- —
No personal income docs; deal must DSCR.
Hard money
10% down · 12.0% · 12mo
- Down + closing
- —
- Monthly P&I
- —
- Monthly cashflow
- —
- DSCR
- —
- Eligible?
- —
Short-term bridge; refi at stabilization.
Rent comps 1 comps
| Address | Beds | Baths | Sqft | Rent | $/sqft | DOM | Units | Dist |
|---|---|---|---|---|---|---|---|---|
| 15756 Ohio St Detroit, MI | 5.0 | 2.0 | 1934 | $1,700 | $0.88 | 24d | 1 | 0.40mi |
Listing history 20 events
-
2026-06-07statusdays on market $99,800 Pending 1 DOM
-
2026-05-31days on market $99,800 Active 173 DOM
-
2025-12-09$99,800 Active 704-char remark
Show marketing remark (684 chars)
SELLER FINANCING / LAND CONTRACT TERMS AVAILABLE AT 115,000 PURCHASE PRICE, 30,000 DOWN PAYMENT, 8% INTEREST, 96 MONTH TERM. 1031 / MONTH. Seller financing available - terms negotiable! A diamond in the rough with key upgrades already done: brand new roof and newly built back steps/upper balcony. This 2-family property is the perfect foundation for your next flip, rental, or house-hack strategy. Conveniently located near highways, schools, parks, and shopping, it's poised for future value with the right vision. Don't miss out - schedule your showing today and make your move. Purchaser to pay 395 processing fee. As-is sale. * 2500 EMD to be held at the seller's title company *
-
2025-12-09$99,800 Active 684-char remark
Show marketing remark (684 chars)
SELLER FINANCING / LAND CONTRACT TERMS AVAILABLE AT 115,000 PURCHASE PRICE, 30,000 DOWN PAYMENT, 8% INTEREST, 96 MONTH TERM. 1031 / MONTH. Seller financing available - terms negotiable! A diamond in the rough with key upgrades already done: brand new roof and newly built back steps/upper balcony. This 2-family property is the perfect foundation for your next flip, rental, or house-hack strategy. Conveniently located near highways, schools, parks, and shopping, it's poised for future value with the right vision. Don't miss out - schedule your showing today and make your move. Purchaser to pay 395 processing fee. As-is sale. * 2500 EMD to be held at the seller's title company *
-
2025-12-01historical
-
2025-12-01historical
-
2025-07-21price $99,899
-
2025-07-21price $99,899
-
2024-11-08$99,900 Active
-
2024-11-08$99,900 Active
-
2023-10-27historical
-
2023-10-27historical
-
2023-04-30$69,500 Active
-
2023-04-30$69,500 Active
-
2023-03-01historical
-
2023-02-28historical
-
2023-02-02price $69,500
-
2023-02-01price $69,500
-
2022-10-27$79,900 Active
-
2022-10-27$79,900 Active
ⓘ Source: listings_history table (triggers on properties + properties_extension) + one-shot
backfill from property_details.listing_events for pre-trigger history.
Tax reassessment forecast MI · Partial reset (capped growth)
- Current annual tax
- $3,582 · $299/mo
- Projected year-2 tax
- $3,582 · $299/mo
- Expected delta
- $0/yr ($0/mo · 0.0%)
ⓘ Screening estimate from a state-policy table — verify with the county assessor before closing.
Climate risk First Street
- Flood 1/10 Low FEMA zone X (unshaded) · 0% chance over 30 yrs
- Wildfire 1/10 Low
- Heat 3/10 Moderate 7 d/yr ≥97°F today · 15 d/yr by 30 yrs out
- Wind 2/10 Low
- Air quality 4/10 Moderate 4 unhealthy d/yr today · 6 by 30 yrs out
Nearby sold comps map
Loading sold comps map…
Walkable amenities ~0.75 mi
Loading nearby amenities…
Taxation est. · year 1
- Rental income
- $19,968
- − Mortgage interest
- −$5,590
- − Property taxes
- −$3,582
- − Insurance
- −$499
- − Repairs & maintenance
- −$1,597
- − Management
- −$1,597
- − Depreciation
- −$2,903
- Taxable income
- $4,198
- Est. tax owed @ 24.0%
- −$1,008
- After-tax cash flow
- $4,405/yr
For passive investors: Depreciation is non-cash, so a rental often shows a tax loss while cash-flowing — sheltering income. Rental losses are passive: they offset passive income freely, and up to $25,000/yr can offset ordinary (W-2) income if you actively participate and your MAGI is under $100k (phasing out to $0 by $150k); unused losses carry forward. On sale, claimed depreciation is recaptured at up to 25%, and gains may owe capital-gains tax (a 1031 exchange can defer both). Figures are a year-1 estimate at your 24.0% rate — not tax advice; consult a CPA.
Schools (NCES district)
- District
- Detroit Public Schools Community District
- NCES district ID
- 2601103
- Math proficiency
- 10% ▼ -2.00%
- Reading proficiency
- 24% ▲ 6.00%
- Median HH income
- $25,815
- Composite
- 13.06/100
- National rank
- #9564
- State rank
- #499 of 540 in MI
Livability — Detroit
- Score
- 73/100
- State rank
- #218
- US rank
- #5427
Category grades
Schools grade is shown separately in the Schools card above.
Census & demographics
- Census place
- Detroit, MI
- County
- Wayne County · 1,562,939 people
- City population
- 572,865
- Metro
- Detroit-Warren-Dearborn, MI
- Population (ZIP)
- 24,731
- Household income
- $33,315
- Rent vs Own
- Severe rent burden
- 2172.0
Population outlook (Wayne County) Hauer SSP2
- Today (2025)
- 1,675,273 people
- By 2030
- 1,620,300 · -3.3%
- By 2040
- 1,502,341 · -10.3%
- By 2050
- 1,384,039 · -17.4%
- By 2075
- 1,124,592 · -32.9%
- By 2100
- 881,193 · -47.4%
Race, ethnicity, and origin ACS 2023
- Neighborhood character
- Predominantly Black (94%)
- Race & ethnicity
- Black 94% Two or more races 3% White 1%
- Foreign-born
- 1%
Political lean MEDSL · Wayne
- 2024 margin
- Strong D (+29.0) · D 62.7% · R 33.7% · Other 3.6%
- 2008→2024 swing
- -20.5pp toward R · 2008: 49.5pp · 2024: 29.0pp
- All cycles
- 2024: D+29.0 2020: D+38.1 2016: D+37.3 2012: D+46.9 2008: D+49.5
Not yet ingested
- Civics
- —
Market trends
- HPI YoY
- ▼ -31.96%
- Current HPI
- 189.6227
- Rent YoY
- ▲ 6.14%
- Metro
- Detroit-Warren-Dearborn, MI
- State GDP YoY
- ▲ 1.37%
- F500 in state
- 28
Industry mix (Fortune 500 HQ in MI)
| Industry | F500 HQs | Revenue |
|---|---|---|
| Automotive Parts | 3 | $48B |
|
||
| Automotive | 2 | $372B |
|
||
| Chemicals | 1 | $45B |
|
||
| Automotive Retail | 1 | $29B |
|
||
| Healthcare / Medical Devices | 1 | $23B |
|
||
| Automotive Technology | 1 | $20B |
|
||
Price history
+24.9% since first listed18 events — show timeline
- 2025-12-09 Listed $99,800 REALCOMP
- 2025-12-09 Listed $99,800 MiRealSource-MiMLS
- 2025-12-01 Listing Removed — MiRealSource-MiMLS
- 2025-12-01 Listing Removed — REALCOMP
- 2025-07-21 Price Changed $99,899 MiRealSource-MiMLS
- 2025-07-21 Price Changed $99,899 REALCOMP
- 2024-11-08 Listed $99,900 MiRealSource-MiMLS
- 2024-11-08 Listed $99,900 REALCOMP
- 2023-10-27 Listing Removed — MiRealSource-MiMLS
- 2023-10-27 Listing Removed — REALCOMP
- 2023-04-30 Listed $69,500 MiRealSource-MiMLS
- 2023-04-30 Listed $69,500 REALCOMP
- 2023-03-01 Listing Removed — MiRealSource-MiMLS
- 2023-02-28 Listing Removed — REALCOMP
- 2023-02-02 Price Changed $69,500 MiRealSource-MiMLS
- 2023-02-01 Price Changed $69,500 REALCOMP
- 2022-10-27 Listed $79,900 MiRealSource-MiMLS
- 2022-10-27 Listed $79,900 REALCOMP
Property tax history
+7.1%/yrLatest (2025): $3,582 · -10.5% YoY. Source: county tax records.
Cash-flow waterfall
monthlySold comps — $/sqft
last 12 mo · ≤1 miLoading sold comps…