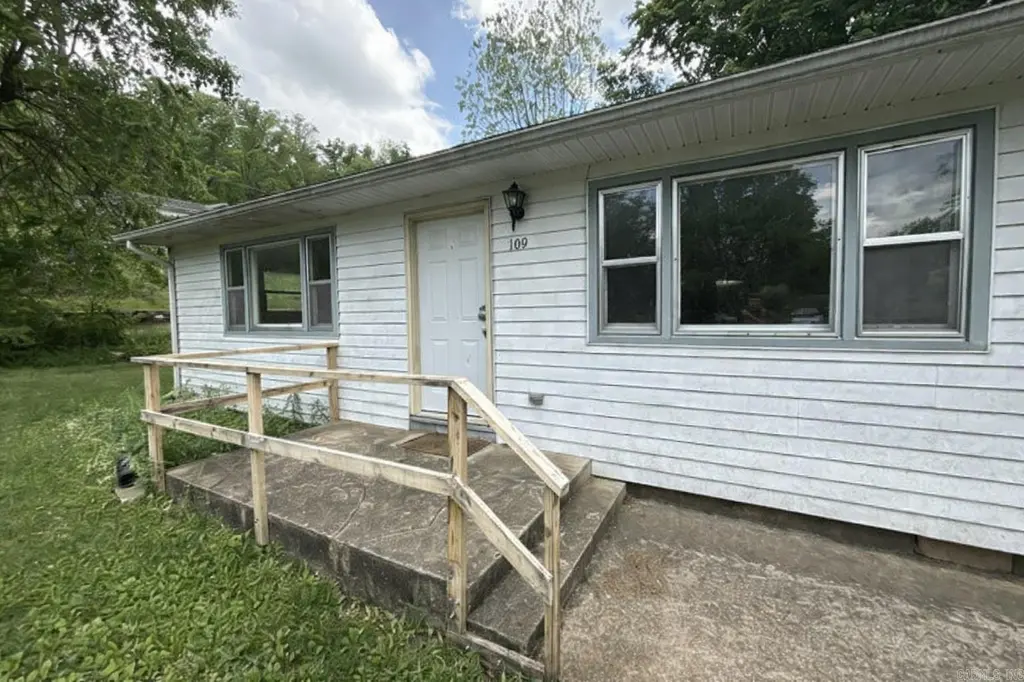
109 College St · Van Buren, MO
Flood risk No data
- FEMA flood zone
- —
- Chance of flooding over 30 yrs
- —
- Est. flood insurance / yr
- —
Fire risk No data
- Est. fire insurance / yr
- —
Heat risk No data
- Hot days now (above threshold)
- —
- Hot days in 30 yrs
- —
Wind risk No data
- Chance of severe wind over 30 yrs
- —
Air-quality risk No data
- Unhealthy air days now
- —
- Unhealthy air days in 30 yrs
- —
Risk factors via First Street. Map © Google.
Why this score? — see what drove the C+ grade
The composite is a weighted blend of 9 inputs, each scored 0–100. Each bar is that input's sub-score; the figure is the points it added to the 100-point composite (weight × sub-score).
- Cash flow +17.8/30.0
- ARV discount +15.0/15.0
- Appreciation +9.8/10.0
- DSCR +5.6/10.0
- 1% rule +3.6/10.0
- Schools +3.3/10.0
- Livability +3.0/5.0
- Rent growth +2.5/5.0
- Condition / age +2.5/5.0
$103,000
🖨 Deal sheet (PDF) 📄 Offer letter ✓ Due diligence
Listing remarks MLS
This charming 3-bedroom, 1-bath home offers a comfortable layout with a spacious living room, kitchen/dining combo, and a bright sunroom filled with natural light. Situated on 0.37 acres m/l, the property also features a carport, central heat and air, a shingled roof, and classic wood siding for timeless appeal. Whether you're looking for a place to call home or an investment opportunity, this property has plenty of potential. Don't miss your chance--schedule your showing today!
Key facts
- Central heat and air
- Carport
- Shingled roof
Tags
Property features AI
Finance
- Other: Lot approximately 158' x 92' (0.37 acre)
Exterior
- Parking: Carport for 1 car
- Utilities: Public sewer; Public water
- Home design: Single-family property; Entry level information not provided; Facing direction not provided
- Construction: Crawl space foundation
- Exterior features: Wood exterior; Composition roof; Paved road access; Level, corner lot
Interior
- Kitchen: Microwave; Dishwasher
- Flooring: Carpet; Laminate
- Bathrooms: 1 full bathroom
- Heating & cooling: Central electric heating; Central electric cooling
- Interior features: Carpet and laminate flooring; Sun room; Laundry room
- Laundry & utility: Laundry room
Neighborhood map
What this means for you Summary
Snapshot
- This is a 3-bed/1.0-bath other listed at $103k.
Deal economics
- At list price, monthly cash flow is $85 ($1k/yr) — positive.
- The deal already cash-flows at list — no discount required.
- To meet the 1% rule (rent ≥ 1% of price), the offer needs to be $88k (14.3% below list).
- Recommended offer: $88k (14.3% below list) — sets the bar for 1% rule.
- Cap rate 7.3% vs local median 1.9% in Van Buren — top-decile yield for the area; either an underpriced asset or a hidden risk that comps aren't pricing in. Stress-test before assuming the spread holds.
Location & tenants
- Location reads 59/100 on livability (#516 in MO) — a working-class tenant base; expect higher turnover. Strengths: cost of living A+, crime A-; Watch: housing C-, health & safety C-, amenities F.
- Van Buren R-I (rural): math 37% / reading 42% proficiency, ranked #169 of 324 in MO (top 52%) — families likely to look elsewhere, expect single-tenant / working-renter base with shorter leases.
- Zoned schools: Van Buren Elem. (math 47% / reading 42%, grade F, #413 of 1,115 statewide, top 42%, 291 students, 70% FRL); Van Buren High (math 22% / reading 37%, grade F, #382 of 521 statewide, top 78%, 225 students, 57% FRL).
- Market conditions: 108 active listings in the ZIP; 2 units permitted in Carter County in 2024 (0 in 5+ unit buildings).
Forward outlook
- In year one you build about $11k of equity ($712 loan paydown + $10k appreciation (9.5% local appreciation)).
- Carter County population projected to shrink 10% by 2050 — rents likely to lag national; underwrite the cash flow, not the appreciation.
- At projected returns (9.5% appreciation + 3.0% rent growth), your $29k cash investment doubles in ~3 years — after that, you're playing with house money.
- By year 4, paydown + projected appreciation supports a ~$37k cash-out refi (75% LTV) — recoverable capital for the next deal without selling this one.
Negotiation context
- It's been on market 39 days — a 3% lower offer ($100k) is reasonable based on typical stale-listing flexibility.
- 2 sale attempts with the ask held roughly flat each time — persistent listings suggest the price (not the market) is what's stuck; bring a comps-based counter.
Risks & watch-outs
- Watch-outs: built in 1955 — expect roof / HVAC / electrical / plumbing capex.
Questions for the listing agent
- It's been on market 39 days. Have you received any prior offers? Is the seller open to a 14% concession, seller financing, or rate buy-down credit?
- Built in 1955 — when were the roof, HVAC, electrical panel, plumbing, and water heater last replaced?
- Is there a deadline driving the sale (1031 exchange, divorce, estate, relocation)? That informs how much negotiation room exists.
- Schools are D-rated, which usually means shorter tenancies and higher turnover. Who's the typical renter profile here, and what's been the actual vacancy rate?
- What's the average days-on-market for RENTAL listings here right now (not sales)? A rising rental-DOM trend means longer vacancies and softer asking-rent achievability than the comps imply.
- What's the recent tenant-quality profile in this submarket — average credit score on applications, eviction rate, late-payment / NSF rate, and stable-employment percentage? A property-management company in the area should have these aggregated.
- How much new for-sale + rental construction is in the pipeline within 1–3 miles? Heavy new supply typically softens prices + rents 12–24 months out; constrained supply supports both.
Investment metrics
- 1% rule
- 0.86% ✗
- Cap rate
- 7.28%
- Cash-on-cash
- 3.54%
- DSCR
- 1.16
- GRM
- 9.7
CMA / ARV
- ARV (median comp)
- $151,578
- List price
- $103,000
- Delta
- -32.05%
- Verdict
- UNDERPRICED
- Comps
- 19 within 1.0 mi
Projected returns pro-forma
9.54% appreciation · 3.0% rent growth · sell at horizon
- IRR
- 25.9%
- Equity multiple
- 3.02×
- Total profit
- $58,231
- Equity at exit
- $89,344
- IRR
- 22.8%
- Equity multiple
- 6.77×
- Total profit
- $166,334
- Equity at exit
- $189,119
Cash invested: $28,840 (down + closing). Projections, not guarantees.
Landlord ↔ Tenant lean methodology
- Overall (STATE)
- 81 Strongly Landlord-Friendly
- State Missouri
- 81 Strongly Landlord-Friendly · R+10
- County
- — inherits STATE
- City
- — inherits STATE
ZIP-level market 63965
- Home prices YoY
- 6.2%
- Active inventory
- 108
- Price-to-rent
- 9.7×
Monthly cashflow live
- Estimated rent
- $883 medium interval (Pro) →
- Mortgage (P&I)
- −$540
- Tax from tax record
- −$29 /mo · $352/yr
- Insurance
- −$43
- HOA
- −$0
- Vacancy / Maint / Mgmt
- −$185
- Net cashflow
- $85
Break-even live
Sensitivity live
| Price | -10% $143 | -5% $114 | +0% $85 | +5% $56 | +10% $27 |
|---|---|---|---|---|---|
| Rent | -10% $15 | -5% $50 | +0% $85 | +5% $120 | +10% $155 |
| Rate | -1.0pp $137 | -0.5pp $111 | base $85 | +0.5pp $58 | +1.0pp $31 |
UW: 25.0% down · 7.5% · 30yr · 1.5% tax · 5.0% vac · 8.0% maint · 8.0% mgmt
Financing live
Cash to close
- Down payment
- $25,750
- Closing costs
- $3,090
- Reserves months
- —
- Total cash needed
- —
Loan-product check · same deal, 3 products live
Conventional
25% down · 7.5% · 30yr
- Down + closing
- —
- Monthly P&I
- —
- Monthly cashflow
- —
- DSCR
- —
- Eligible?
- —
Personal DTI + credit; lowest rate.
DSCR
20% down · 8.5% · 30yr
- Down + closing
- —
- Monthly P&I
- —
- Monthly cashflow
- —
- DSCR
- —
- Eligible?
- —
No personal income docs; deal must DSCR.
Hard money
10% down · 12.0% · 12mo
- Down + closing
- —
- Monthly P&I
- —
- Monthly cashflow
- —
- DSCR
- —
- Eligible?
- —
Short-term bridge; refi at stabilization.
Listing history 19 events
-
2026-06-21days on market $103,000 Active 39 DOM
-
2026-06-21days on market $103,000 Active 38 DOM
-
2026-06-18days on market $103,000 Active 36 DOM
-
2026-06-17days on market $103,000 Active 35 DOM
-
2026-06-16days on market $103,000 Active 34 DOM
-
2026-06-15days on market $103,000 Active 33 DOM
-
2026-06-13days on market $103,000 Active 31 DOM
-
2026-06-12days on market $103,000 Active 30 DOM
-
2026-06-09days on market $103,000 Active 27 DOM
-
2026-06-08days on market $103,000 Active 26 DOM
-
2026-06-07days on market $103,000 Active 25 DOM
-
2026-06-07days on market $103,000 Active 24 DOM
-
2026-06-04days on market $103,000 Active 21 DOM
-
2026-06-02days on market $103,000 Active 20 DOM
-
2026-06-01days on market $103,000 Active 19 DOM
-
2026-05-31days on market $103,000 Active 18 DOM
-
2026-05-12$103,000 Active 483-char remark
Show marketing remark (483 chars)
This charming 3-bedroom, 1-bath home offers a comfortable layout with a spacious living room, kitchen/dining combo, and a bright sunroom filled with natural light. Situated on 0.37 acres m/l, the property also features a carport, central heat and air, a shingled roof, and classic wood siding for timeless appeal. Whether you're looking for a place to call home or an investment opportunity, this property has plenty of potential. Don't miss your chance--schedule your showing today!
-
2026-05-12$103,000 New Listing 483-char remark
Show marketing remark (483 chars)
This charming 3-bedroom, 1-bath home offers a comfortable layout with a spacious living room, kitchen/dining combo, and a bright sunroom filled with natural light. Situated on 0.37 acres m/l, the property also features a carport, central heat and air, a shingled roof, and classic wood siding for timeless appeal. Whether you're looking for a place to call home or an investment opportunity, this property has plenty of potential. Don't miss your chance--schedule your showing today!
-
2022-08-05soldstatus
ⓘ Source: listings_history table (triggers on properties + properties_extension) + one-shot
backfill from property_details.listing_events for pre-trigger history.
Tax reassessment forecast MO · Resets to sale price
- Current annual tax
- $352 · $29/mo
- Projected year-2 tax
- $999 · $83/mo
- Expected delta
- +$647/yr (+$54/mo · 183.7%)
ⓘ Screening estimate from a state-policy table — verify with the county assessor before closing.
Nearby sold comps map
Loading sold comps map…
Walkable amenities ~0.75 mi
Loading nearby amenities…
Taxation est. · year 1
- Rental income
- $10,596
- − Mortgage interest
- −$5,770
- − Property taxes
- −$352
- − Insurance
- −$515
- − Repairs & maintenance
- −$848
- − Management
- −$848
- − Depreciation
- −$2,996
- Taxable loss
- −$733
- Est. tax savings @ 24.0%
- +$176
- After-tax cash flow
- $1,197/yr
For passive investors: Depreciation is non-cash, so a rental often shows a tax loss while cash-flowing — sheltering income. Rental losses are passive: they offset passive income freely, and up to $25,000/yr can offset ordinary (W-2) income if you actively participate and your MAGI is under $100k (phasing out to $0 by $150k); unused losses carry forward. On sale, claimed depreciation is recaptured at up to 25%, and gains may owe capital-gains tax (a 1031 exchange can defer both). Figures are a year-1 estimate at your 24.0% rate — not tax advice; consult a CPA.
Schools (NCES district)
- District
- Van Buren R-I
- NCES district ID
- 2930750
- Math proficiency
- 37% ▼ -7.00%
- Reading proficiency
- 42% ▼ -5.00%
- Median HH income
- $36,880
- Composite
- 32.81/100
- National rank
- #5624
- State rank
- #169 of 324 in MO
Livability — Van Buren
- Score
- 59/100
- State rank
- #516
- US rank
- #19632
Category grades
Schools grade is shown separately in the Schools card above.
Census & demographics
- Census place
- Van Buren, MO
- Population (ZIP)
- 2,433
Population outlook (Carter County) Hauer SSP2
- Today (2025)
- 6,169 people
- By 2030
- 6,050 · -1.9%
- By 2040
- 5,824 · -5.6%
- By 2050
- 5,583 · -9.5%
- By 2075
- 4,900 · -20.6%
- By 2100
- 4,002 · -35.1%
Race, ethnicity, and origin ACS 2023
- Neighborhood character
- Predominantly White (97%)
- Race & ethnicity
- White 97% Two or more races 3%
- Common ancestry
- Italian 3% Serbian 2% Romanian 2%
- Foreign-born
- 0%
Political lean MEDSL · Carter
- 2024 margin
- Solid R (+74.2) · D 12.7% · R 86.9%
- 2008→2024 swing
- -44.7pp toward R · 2008: -29.5pp · 2024: -74.2pp
- All cycles
- 2024: R+74.2 2020: R+70.2 2016: R+66.4 2012: R+43.7 2008: R+29.5
Not yet ingested
- Civics
- —
Market trends
- HPI YoY
- ▲ 9.54%
- Current HPI
- 162.5634
- Rent YoY
- —
- Metro
- —
- State GDP YoY
- ▲ 1.84%
- F500 in state
- 20
Industry mix (Fortune 500 HQ in MO)
| Industry | F500 HQs | Revenue |
|---|---|---|
| Healthcare | 1 | $163B |
|
||
| Insurance | 1 | $21B |
|
||
| Industrial Technology | 1 | $17B |
|
||
| Retail | 1 | $16B |
|
||
| Industrial Distribution | 1 | $10B |
|
||
| Utilities | 1 | $9B |
|
||
Price history
+0.0% since first listed3 events — show timeline
- 2026-05-12 Listed $103,000 SOMO
- 2026-05-12 Listed $103,000 CARMLS
- 2022-08-05 Sold (Public Records) — Public Records
Property tax history
+3.5%/yrLatest (2025): $352 · -0.1% YoY. Source: county tax records.
Cash-flow waterfall
monthlySold comps — $/sqft
last 12 mo · ≤1 miLoading sold comps…