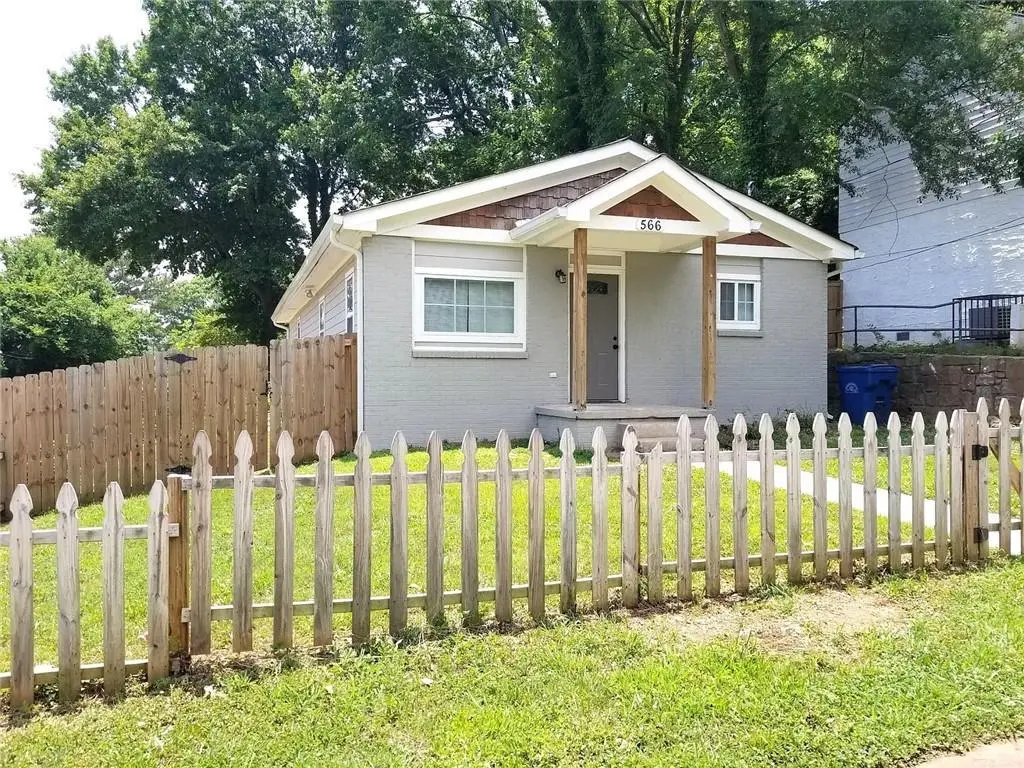
566 Rockwell St SW · Atlanta, GA
Flood risk 1/10 · Minimal
- FEMA flood zone
- X (unshaded)
- Chance of flooding over 30 yrs
- 0.0%
- Est. flood insurance / yr
- $473 – $860
Fire risk 1/10 · Minimal
- Est. fire insurance / yr
- $963 – $1,789
Heat risk 5/10 · Moderate
- Hot days now (above 104°F)
- 7 days/yr
- Hot days in 30 yrs
- 18 days/yr
Wind risk 5/10 · Moderate
- Chance of severe wind over 30 yrs
- 25.0%
Air-quality risk 4/10 · Minor
- Unhealthy air days now
- 4 days/yr
- Unhealthy air days in 30 yrs
- 6 days/yr
Risk factors via First Street. Map © Google.
Why this score? — see what drove the C- grade
The composite is a weighted blend of 9 inputs, each scored 0–100. Each bar is that input's sub-score; the figure is the points it added to the 100-point composite (weight × sub-score).
- ARV discount +14.7/15.0
- Cash flow +14.4/30.0
- DSCR +4.4/10.0
- Livability +4.2/5.0
- 1% rule +3.9/10.0
- Rent growth +3.2/5.0
- Schools +2.7/10.0
- Condition / age +2.5/5.0
- Appreciation +0.0/10.0
$279,900
🖨 Deal sheet 📄 Offer letter ✓ Due diligence
Listing remarks MLS
This is a single-story, garden-style home located in Fulton County, Georgia. It features 4 bedrooms and 3 full bathrooms, offering a practical layout for families. All rooms are on one level, making the home easily accessible. The property includes a well-kept garden area in the back, suitable for outdoor seating or light gardening. Located in an established neighborhood, the home is close to local schools, parks, shopping centers, and main roadways.
Key facts
- Main roadways
- Shopping centers
- Garden area
Tags
Neighborhood map
What this means for you Summary
Snapshot
- This is a 4-bed/2.0-bath single-family listed at $280k.
Deal economics
- At list price, monthly cash flow is $58 ($696/yr) — positive.
- The deal already cash-flows at list — no discount required.
- To meet the 1% rule (rent ≥ 1% of price), the offer needs to be $249k (11.1% below list).
- Recommended offer: $249k (11.1% below list) — sets the bar for 1% rule.
- Cap rate 6.5% vs local median 3.1% in Atlanta — top-decile yield for the area; either an underpriced asset or a hidden risk that comps aren't pricing in. Stress-test before assuming the spread holds.
Location & tenants
- Location reads 83/100 on livability (#6 in GA, #919 nationally) — a professional / high-income tenant draw. Strengths: amenities A+, commute A+, housing A+; Watch: schools C-, cost of living C-.
- Atlanta Public Schools (urban): math 28% / reading 35% proficiency, ranked #80 of 174 in GA (top 46%) — families likely to look elsewhere, expect single-tenant / working-renter base with shorter leases; 71% free/reduced lunch — lower-income household profile, screen leases tightly.
- Market conditions: Rents rising (+2.8%/yr); 452 active listings in the ZIP; 40 comparable units currently listed for rent nearby; rentals at typical pace (median 24d on market — plan ~3-4 weeks tenant-placement turnaround); 11,565 units permitted in Fulton County in 2024 (8,159 in 5+ unit buildings).
- At $2,489/mo this rent would consume 56% of the median local household income ($53k/yr) (locally 1676% of renters already pay >50% of income on rent) — very limited rent-growth headroom before tenants either downsize or default.
Forward outlook
- Local home prices are declining (-3.0%/yr); year-one equity from $2k of loan paydown is wiped out by about $8k of value loss. Plan a longer hold.
- Fulton County population projected at +38% by 2050 — long-run rental-demand tailwind backs the buy-and-hold thesis.
Negotiation context
- It's been on market 55 days — a 3% lower offer ($272k) is reasonable based on typical stale-listing flexibility.
- 20 sale attempts; this cycle's ask is 14670% above the opening price — seller raised mid-cycle; expect resistance to lowballs.
- Current owner paid $220k; 27% above their basis — modest negotiation headroom, anchor on the comps not their cost.
Risks & watch-outs
- Climate carrying-cost: moderate wind risk, 25% chance of damaging wind over 30y; extreme-heat days projected 7→18/yr by 2055 (HVAC capex compounding) — expect insurance premiums to compound above CPI over the hold.
Questions for the listing agent
- It's been on market 55 days. Have you received any prior offers? Is the seller open to a 11% concession, seller financing, or rate buy-down credit?
- Built in 1960 — when were the roof, HVAC, electrical panel, plumbing, and water heater last replaced?
- Is there a deadline driving the sale (1031 exchange, divorce, estate, relocation)? That informs how much negotiation room exists.
- What's the average days-on-market for RENTAL listings here right now (not sales)? A rising rental-DOM trend means longer vacancies and softer asking-rent achievability than the comps imply.
- What's the recent tenant-quality profile in this submarket — average credit score on applications, eviction rate, late-payment / NSF rate, and stable-employment percentage? A property-management company in the area should have these aggregated.
- How much new for-sale + rental construction is in the pipeline within 1–3 miles? Heavy new supply typically softens prices + rents 12–24 months out; constrained supply supports both.
Investment metrics
- 1% rule
- 0.89% ✗
- Cap rate
- 6.54%
- Cash-on-cash
- 0.89%
- DSCR
- 1.04
- GRM
- 9.4
CMA / ARV
- ARV (median comp)
- $333,522
- List price
- $279,900
- Delta
- -16.08%
- Verdict
- UNDERPRICED
- Comps
- 20 within 1.0 mi
Show comp detail 12 sales within ~0.75 mi
| Address | Dist | Beds/Ba | Sqft | Sold | Price | $/sf | Match |
|---|---|---|---|---|---|---|---|
| 802 Welch St SW | 0.14mi | 3/2.0 (-1) | 1,218 (-6%) | 1mo | $289,900 | $238 | 78 |
| 911 Smith St SW | 0.32mi | 3/2.0 (-1) | 1,266 (-2%) | 0mo | $185,000 | $146 | 76 |
| 762 Pearce St SW | 0.41mi | 3/2.0 (-1) | 1,328 (+2%) | 3mo | $488,500 | $368 | 70 |
| 881 Oakhill Ave SW | 0.20mi | 3/2.0 (-1) | 1,434 (+11%) | 1mo | $462,500 | $323 | 68 |
| 594 Fletcher St SW | 0.43mi | 3/2.0 (-1) | 1,276 (-2%) | 9mo | $204,000 | $160 | 65 |
| 1090 Coleman St SW | 0.47mi | 3/2.0 (-1) | 1,352 (+4%) | 8mo | $310,000 | $229 | 59 |
| 749 Bonnie Brae Ave SW | 0.36mi | 3/2.0 (-1) | 1,141 (-12%) | 1mo | $364,251 | $319 | 58 |
| 885 Rose Cir | 0.61mi | 3/1.0 (-1) | 1,259 (-3%) | 2mo | $195,000 | $155 | 56 |
| 882 Tift Ave SW | 0.24mi | 3/2.0 (-1) | 1,456 (+12%) | 9mo | $540,000 | $371 | 56 |
| 1149 Ira St SW | 0.66mi | 3/2.0 (-1) | 1,231 (-5%) | 3mo | $184,000 | $149 | 54 |
| 988 Mcdaniel St SW | 0.38mi | 3/2.5 (-1) | 1,484 (+14%) | 6mo | $392,800 | $265 | 46 |
| 641 Ira St SW | 0.52mi | 3/2.5 (-1) | 1,480 (+14%) | 3mo | $230,000 | $155 | 43 |
Match score weights: distance 35% · size 25% · config 20% · recency 20%. Top-matched comps best support the ARV.
Projected returns pro-forma
-3.0% appreciation · 2.77% rent growth · sell at horizon
- IRR
- -15.1%
- Equity multiple
- 0.46×
- Total profit
- $-42,214
- Equity at exit
- $41,734
- IRR
- -6.9%
- Equity multiple
- 0.56×
- Total profit
- $-34,262
- Equity at exit
- $24,201
Cash invested: $78,372 (down + closing). Projections, not guarantees.
Landlord ↔ Tenant lean methodology
- Overall (STATE)
- 90 Strongly Landlord-Friendly
- State Georgia
- 90 Strongly Landlord-Friendly · R+3
- County
- — inherits STATE
- City
- — inherits STATE
ZIP-level market 30310
- Home prices YoY
- -32.8%
- Rents YoY
- 2.8%
- Active inventory
- 452
- Price-to-rent
- 9.4×
Monthly cashflow live
- Estimated rent
- $2,489 high interval (Pro) →
- Mortgage (P&I)
- −$1,468
- Tax from tax record
- −$324 /mo · $3,883/yr
- Insurance
- −$117
- HOA
- −$0
- Vacancy / Maint / Mgmt
- −$523
- Net cashflow
- $58
Break-even live
UW: 25.0% down · 7.5% · 30yr · 1.5% tax · 5.0% vac · 8.0% maint · 8.0% mgmt
Financing live
Cash to close
- Down payment
- $69,975
- Closing costs
- $8,397
- Reserves months
- —
- Total cash needed
- —
Loan-product check · same deal, 3 products live
Conventional
25% down · 7.5% · 30yr
- Down + closing
- —
- Monthly P&I
- —
- Monthly cashflow
- —
- DSCR
- —
- Eligible?
- —
Personal DTI + credit; lowest rate.
DSCR
20% down · 8.5% · 30yr
- Down + closing
- —
- Monthly P&I
- —
- Monthly cashflow
- —
- DSCR
- —
- Eligible?
- —
No personal income docs; deal must DSCR.
Hard money
10% down · 12.0% · 12mo
- Down + closing
- —
- Monthly P&I
- —
- Monthly cashflow
- —
- DSCR
- —
- Eligible?
- —
Short-term bridge; refi at stabilization.
Rent comps 40 comps
| Address | Beds | Baths | Sqft | Rent | $/sqft | DOM | Units | Dist |
|---|---|---|---|---|---|---|---|---|
| 564 Hope St SW Unit A Atlanta, GA | 4.0 | 2.0 | 1188 | $2,300 | $1.94 | 24d | 1 | 0.12mi |
| 776 Metropolitan Pkwy SW Atlanta, GA | 2.0–3.0 | 2.0–3.0 | 1212 | $2,410 | $1.99 | 1d | 6 | 0.14mi |
| 802 Lowndes Ave SW Atlanta, GA | 3.0 | 2.0 | 1872 | $2,550 | $1.36 | 21d | 1 | 0.32mi |
| 404 Bass St SW Atlanta, GA | 3.0 | 2.0 | 1080 | $1,850 | $1.71 | 16d | 1 | 0.37mi |
| 906 Allene Ave SW Atlanta, GA | 3.0 | 2.0 | 1500 | $3,500 | $2.33 | 21d | 1 | 0.45mi |
| 1063 Metropolitan Pkwy SW Atlanta, GA | 4.0 | 2.0 | 1700 | $1,700 | $1.00 | 24d | 1 | 0.45mi |
| 610 Fletcher St SW Atlanta, GA | 3.0 | 2.5 | 1550 | $2,100 | $1.35 | 24d | 1 | 0.45mi |
| 685 Garibaldi St SW Atlanta, GA | 3.0 | 2.5 | 1868 | $1,900 | $1.02 | 18d | 1 | 0.48mi |
| 1040 Smith St SW Atlanta, GA | 3.0 | 2.5 | 1500 | $1,595 | $1.06 | 24d | 1 | 0.50mi |
| 706 Catherine St SW Atlanta, GA | 3.0 | 2.0 | 1352 | $2,200 | $1.63 | 7d | 1 | 0.51mi |
| 600 Mayland Ave SW Atlanta, GA | 3.0 | 2.0 | 1100 | $2,300 | $2.09 | 24d | 1 | 0.52mi |
| 1133 Mayland Cir SW Atlanta, GA | 3.0 | 2.0 | 1120 | $3,600 | $3.21 | 24d | 1 | 0.55mi |
| 827 Elbert St SW Atlanta, GA | 3.0 | 2.0 | 1300 | $2,900 | $2.23 | 24d | 1 | 0.56mi |
| 1135 Coleman St SW Atlanta, GA | 3.0 | 2.5 | 1353 | $1,795 | $1.33 | 24d | 1 | 0.56mi |
| 1151 Smith St SW Atlanta, GA | 3.0 | 2.5 | 1728 | $1,100 | $0.64 | 24d | 1 | 0.65mi |
| 1153 Smith St SW Atlanta, GA | 3.0 | 2.5 | 1728 | $2,023 | $1.17 | 12d | 1 | 0.65mi |
| 504 Dunbar St SW Atlanta, GA | 3.0 | 2.5 | 1728 | $1,625 | $0.94 | 24d | 1 | 0.65mi |
| 903 Beecher St SW Unit 905 Beecher Atlanta, GA | 3.0 | 2.0 | 1500 | $4,000 | $2.67 | 21d | 1 | 0.66mi |
| 903 Beecher St SW Atlanta, GA | 3.0 | 2.0 | 1500 | $7,500 | $5.00 | 24d | 1 | 0.66mi |
| 1141 Moton Ave SW Atlanta, GA | 3.0 | 3.0 | 1584 | $2,800 | $1.77 | 24d | 1 | 0.77mi |
| 547 Erin Ave SW Atlanta, GA | 3.0 | 2.0 | 1400 | $5,000 | $3.57 | 1d | 1 | 0.85mi |
| 547 Erin Ave SW Atlanta, GA | 3.0 | 2.0 | 1394 | $2,600 | $1.87 | 24d | 1 | 0.85mi |
| 72 Ormond St SW Atlanta, GA | 3.0 | 2.0 | 1664 | $3,800 | $2.28 | 24d | 1 | 0.91mi |
| 600 Greensferry Ave SW Atlanta, GA | 1.0–3.0 | 1.0–2.0 | 949 | $1,590 | $1.68 | 7d | 16 | 0.98mi |
| 821 Erin Ave SW Atlanta, GA | 3.0 | 2.0 | 1535 | $2,195 | $1.43 | 24d | 1 | 1.00mi |
| 1264 Hartford Ave SW Atlanta, GA | 3.0 | 2.0 | 1290 | $1,989 | $1.54 | 24d | 1 | 1.01mi |
| 875 Hank Aaron Dr SW Atlanta, GA | 1.0–3.0 | 1.0–2.0 | 916 | $1,688 | $1.84 | 24d | 1 | 1.03mi |
| 973 Lawton St SW Atlanta, GA | 3.0 | 1.0 | 912 | $1,575 | $1.73 | 7d | 1 | 1.04mi |
| 496 Shannon Dr SW Atlanta, GA | 3.0 | 2.0 | 1658 | $3,250 | $1.96 | 2d | 1 | 1.07mi |
| 496 Shannon Dr SW Atlanta, GA | 3.0 | 2.0 | 1658 | $2,900 | $1.75 | 1d | 1 | 1.07mi |
| 551 Lynnhaven Dr SW Atlanta, GA | 4.0 | 2.0 | 1597 | $2,450 | $1.53 | 24d | 1 | 1.09mi |
| 444 Shannon Dr SW Atlanta, GA | 3.0 | 2.0 | 1600 | $2,450 | $1.53 | 24d | 1 | 1.09mi |
| 549 Lynnhaven Dr SW Atlanta, GA | 4.0 | 2.0 | 1215 | $2,450 | $2.02 | 24d | 1 | 1.09mi |
| 565 Hank Aaron Dr SW Atlanta, GA | 1.0–3.0 | 1.0–2.0 | 1139 | $3,070 | $2.70 | 2d | 23 | 1.12mi |
| 490 Lynnhaven Dr SW Atlanta, GA | 3.0 | 2.0 | 1289 | $2,395 | $1.86 | 4d | 1 | 1.14mi |
| 51 Little St SE Atlanta, GA | 3.0 | 2.5 | 1478 | $2,995 | $2.03 | 24d | 1 | 1.14mi |
| 976 Dunning St SE Unit A Atlanta, GA | 3.0 | 2.5 | 1598 | $3,150 | $1.97 | 21d | 1 | 1.14mi |
| 1412 Allene Ave SW Atlanta, GA | 3.0 | 2.0 | 1705 | $2,500 | $1.47 | 24d | 1 | 1.14mi |
| 1443 Metropolitan Pkwy SW Atlanta, GA | 3.0 | 2.0 | 1518 | $2,200 | $1.45 | 24d | 1 | 1.15mi |
| 660 Queen St SW Unit B Atlanta, GA | 3.0 | 3.0 | 1840 | $3,250 | $1.77 | 24d | 1 | 1.16mi |
Listing history 45 events
-
2026-05-31days on market $279,900 Active 55 DOM
-
2026-05-13$1,895
-
2026-05-09historical $1,895
-
2026-04-07$1,895
-
2026-04-07historical $1,895
-
2026-04-06$279,900 New 460-char remark
Show marketing remark (460 chars)
This is a single-story, garden-style home located in Fulton County, Georgia. It features 4 bedrooms and 3 full bathrooms, offering a practical layout for families. All rooms are on one level, making the home easily accessible. The property includes a well-kept garden area in the back, suitable for outdoor seating or light gardening. Located in an established neighborhood, the home is close to local schools, parks, shopping centers, and main roadways.
-
2026-04-06$279,900 Active 460-char remark
Show marketing remark (460 chars)
This is a single-story, garden-style home located in Fulton County, Georgia. It features 4 bedrooms and 3 full bathrooms, offering a practical layout for families. All rooms are on one level, making the home easily accessible. The property includes a well-kept garden area in the back, suitable for outdoor seating or light gardening. Located in an established neighborhood, the home is close to local schools, parks, shopping centers, and main roadways.
-
2026-03-31historical
-
2026-03-31historical
-
2026-03-03status Back On Market
-
2026-03-02status Active
-
2026-02-28historical
-
2026-02-28historical
-
2026-01-30$1,895
-
2026-01-29historical $1,895
-
2026-01-21$1,895
-
2026-01-21historical $1,895
-
2026-01-04$1,895
-
2026-01-03historical $1,895
-
2026-01-02$279,900 Active
-
2026-01-02$279,900 New
-
2025-12-31$1,895
-
2025-12-31historical
-
2025-12-30historical $1,895
-
2025-12-23$1,895
-
2025-12-22historical $1,895
-
2025-12-16$1,895
-
2025-12-15historical $1,895
-
2025-12-13$1,895
-
2025-12-12historical $1,895
-
2025-12-04$1,895
-
2025-12-04historical $1,895
-
2025-11-27$1,895
-
2025-11-26historical $1,895
-
2025-10-28$1,895
-
2025-10-28historical $2,000
-
2025-10-22$2,000
-
2025-09-30$279,900 New
-
2022-03-15soldstatus $220,000
-
2019-12-04soldstatus $85,000
-
2007-01-08soldstatus $100,800
-
2005-06-15soldstatus $160,000
-
2005-05-09soldstatus $105,000
-
2005-04-15soldstatus $79,900
-
2002-06-26soldstatus $150,000
ⓘ Source: listings_history table (triggers on properties + properties_extension) + one-shot
backfill from property_details.listing_events for pre-trigger history.
Tax reassessment forecast GA · Resets to sale price
- Current annual tax
- $3,883 · $324/mo
- Projected year-2 tax
- $3,883 · $324/mo
- Expected delta
- $0/yr ($0/mo · 0.0%)
ⓘ Screening estimate from a state-policy table — verify with the county assessor before closing.
Climate risk First Street
- Flood 1/10 Low FEMA zone X (unshaded) · 0% chance over 30 yrs
- Wildfire 1/10 Low
- Heat 5/10 Major 7 d/yr ≥104°F today · 18 d/yr by 30 yrs out
- Wind 5/10 Major 25% chance of damaging wind over 30 yrs
- Air quality 4/10 Moderate 4 unhealthy d/yr today · 6 by 30 yrs out
Nearby sold comps map
Loading sold comps map…
Walkable amenities ~0.75 mi
Loading nearby amenities…
Taxation est. · year 1
- Rental income
- $29,865
- − Mortgage interest
- −$15,679
- − Property taxes
- −$3,883
- − Insurance
- −$1,400
- − Repairs & maintenance
- −$2,389
- − Management
- −$2,389
- − Depreciation
- −$8,143
- Taxable loss
- −$4,018
- Est. tax savings @ 24.0%
- +$964
- After-tax cash flow
- $1,660/yr
For passive investors: Depreciation is non-cash, so a rental often shows a tax loss while cash-flowing — sheltering income. Rental losses are passive: they offset passive income freely, and up to $25,000/yr can offset ordinary (W-2) income if you actively participate and your MAGI is under $100k (phasing out to $0 by $150k); unused losses carry forward. On sale, claimed depreciation is recaptured at up to 25%, and gains may owe capital-gains tax (a 1031 exchange can defer both). Figures are a year-1 estimate at your 24.0% rate — not tax advice; consult a CPA.
Schools (NCES district)
- District
- Atlanta Public Schools
- NCES district ID
- 1300120
- Math proficiency
- 28% ▼ -6.00%
- Reading proficiency
- 35% ▼ -2.00%
- Median HH income
- $48,306
- Composite
- 27.27/100
- National rank
- #7006
- State rank
- #80 of 174 in GA
Livability — Atlanta
- Score
- 83/100
- State rank
- #6
- US rank
- #919
Category grades
Schools grade is shown separately in the Schools card above.
Census & demographics
- Census place
- Atlanta, GA
- County
- Fulton County · 1,094,430 people
- City population
- 629,525
- Metro
- Atlanta-Sandy Springs-Alpharetta, GA
- Population (ZIP)
- 27,186
- Household income
- $53,037
- Rent vs Own
- Severe rent burden
- 1676.0
Population outlook (Fulton County) Hauer SSP2
- Today (2025)
- 1,203,707 people
- By 2030
- 1,299,706 · +8.0%
- By 2040
- 1,488,256 · +23.6%
- By 2050
- 1,664,580 · +38.3%
- By 2075
- 2,036,072 · +69.2%
- By 2100
- 2,222,402 · +84.6%
Race, ethnicity, and origin ACS 2023
- Neighborhood character
- Predominantly Black (76%)
- Race & ethnicity
- Black 76% White 14% Two or more races 4% Hispanic / Latino 4% Asian 2%
- Common ancestry
- Lithuanian 1% Slovak 1% Serbian 0%
- Foreign-born
- 5% · Canada, South Korea, Vietnam
- Languages at home
- 92% English-only · Spanish 4% French/Haitian/Cajun 1% Other Indo-European 1%
Political lean MEDSL · Fulton
- 2024 margin
- Solid D (+44.9) · D 71.9% · R 27.0% · Other 1.1%
- 2008→2024 swing
- +9.8pp toward D · 2008: 35.0pp · 2024: 44.9pp
- All cycles
- 2024: D+44.9 2020: D+46.4 2016: D+42.1 2012: D+29.6 2008: D+35.0
Not yet ingested
- Civics
- —
Market trends
- HPI YoY
- ▼ -204.00%
- Current HPI
- 418.7297
- Rent YoY
- ▲ 2.77%
- Metro
- Atlanta-Sandy Springs-Alpharetta, GA
- State GDP YoY
- ▲ 2.66%
- F500 in state
- 28
Industry mix (Fortune 500 HQ in GA)
| Industry | F500 HQs | Revenue |
|---|---|---|
| Paper / Packaging | 2 | $29B |
|
||
| Retail | 1 | $160B |
|
||
| Transportation / Logistics | 1 | $91B |
|
||
| Airlines | 1 | $62B |
|
||
| Consumer Goods | 1 | $47B |
|
||
| Utilities | 1 | $25B |
|
||
Price history
-98.7% since first listed44 events — show timeline
- 2026-05-13 Listed for Rent $1,895 RENTEC
- 2026-05-09 Rental Removed $1,895 FMLS
- 2026-04-07 Listed for Rent $1,895 FMLS
- 2026-04-07 Rental Removed $1,895 RENTEC
- 2026-04-06 Listed $279,900 FMLS
- 2026-04-06 Listed $279,900 GAMLS
- 2026-03-31 Listing Removed — GAMLS
- 2026-03-31 Listing Removed — FMLS
- 2026-03-03 Relisted — GAMLS
- 2026-03-02 Relisted — FMLS
- 2026-02-28 Listing Removed — GAMLS
- 2026-02-28 Listing Removed — FMLS
- 2026-01-30 Listed for Rent $1,895 RENTEC
- 2026-01-29 Rental Removed $1,895 FMLS
- 2026-01-21 Listed for Rent $1,895 FMLS
- 2026-01-21 Rental Removed $1,895 FMLS
- 2026-01-04 Listed for Rent $1,895 FMLS
- 2026-01-03 Rental Removed $1,895 RENTEC
- 2026-01-02 Listed $279,900 GAMLS
- 2026-01-02 Listed $279,900 FMLS
- 2025-12-31 Listed for Rent $1,895 RENTEC
- 2025-12-31 Listing Removed — GAMLS
- 2025-12-30 Rental Removed $1,895 FMLS
- 2025-12-23 Listed for Rent $1,895 FMLS
- 2025-12-22 Rental Removed $1,895 FMLS
- 2025-12-16 Listed for Rent $1,895 FMLS
- 2025-12-15 Rental Removed $1,895 RENTEC
- 2025-12-13 Listed for Rent $1,895 RENTEC
- 2025-12-12 Rental Removed $1,895 FMLS
- 2025-12-04 Listed for Rent $1,895 FMLS
- 2025-12-04 Rental Removed $1,895 RENTEC
- 2025-11-27 Listed for Rent $1,895 RENTEC
- 2025-11-26 Rental Removed $1,895 FMLS
- 2025-10-28 Listed for Rent $1,895 FMLS
- 2025-10-28 Rental Removed $2,000 RENTEC
- 2025-10-22 Listed for Rent $2,000 RENTEC
- 2025-09-30 Listed $279,900 GAMLS
- 2022-03-15 Sold (Public Records) $220,000 Public Records
- 2019-12-04 Sold (Public Records) $85,000 Public Records
- 2007-01-08 Sold (Public Records) $100,800 Public Records
- 2005-06-15 Sold (Public Records) $160,000 Public Records
- 2005-05-09 Sold (Public Records) $105,000 Public Records
- 2005-04-15 Sold (Public Records) $79,900 Public Records
- 2002-06-26 Sold (Public Records) $150,000 Public Records
Property tax history
+4.4%/yrLatest (2025): $3,883 · -5.9% YoY. Source: county tax records.
Cash-flow waterfall
monthlySold comps — $/sqft
last 12 mo · ≤1 miLoading sold comps…