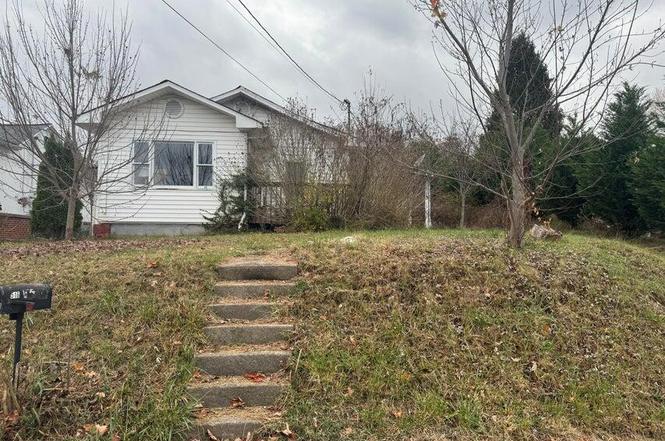
516 Stanley Ave · Johnson City, TN
Flood risk 1/10 · Minimal
- FEMA flood zone
- X (unshaded)
- Chance of flooding over 30 yrs
- 0.0%
- Est. flood insurance / yr
- $473 – $860
Fire risk 1/10 · Minimal
- Est. fire insurance / yr
- $949 – $1,763
Heat risk 4/10 · Minor
- Hot days now (above 98°F)
- 7 days/yr
- Hot days in 30 yrs
- 21 days/yr
Wind risk 2/10 · Minimal
- Chance of severe wind over 30 yrs
- —
Air-quality risk 2/10 · Minimal
- Unhealthy air days now
- 1 days/yr
- Unhealthy air days in 30 yrs
- 1 days/yr
Risk factors via First Street. Map © Google.
Why this score? — see what drove the B- grade
The composite is a weighted blend of 9 inputs, each scored 0–100. Each bar is that input's sub-score; the figure is the points it added to the 100-point composite (weight × sub-score).
- Cash flow +25.7/30.0
- ARV discount +15.0/15.0
- DSCR +8.6/10.0
- 1% rule +5.8/10.0
- Schools +3.9/10.0
- Livability +3.8/5.0
- Rent growth +2.9/5.0
- Condition / age +2.5/5.0
- Appreciation +0.0/10.0
$125,000
🖨 Deal sheet 📄 Offer letter ✓ Due diligence
Listing remarks
Single family home great as investment property or as a first home/retirement home, needs lots of TLC. Being sold AS-IS. Buyer/buyer's agent to verify all info within.
Key facts
- 0.24 acre lot
- Built 1935
- Listed 2 days
Neighborhood map
What this means for you Summary
Snapshot
- This is a 2-bed/1.0-bath single-family listed at $125k.
Deal economics
- At list price, monthly cash flow is $301 ($4k/yr) — positive.
- The deal already cash-flows at list — no discount required.
- Meets the 1% rule at list price ($1k rent vs $125k).
- Cap rate 9.2% vs local median 3.1% in Johnson City — top-decile yield for the area; either an underpriced asset or a hidden risk that comps aren't pricing in. Stress-test before assuming the spread holds.
Location & tenants
- Location reads 76/100 on livability (#8 in TN, #3,349 nationally) — a middle-class / working-renter tenant base. Strengths: amenities A+, cost of living A+, health & safety A; Watch: crime D, commute F, employment F.
- Johnson City (urban): math 46% / reading 47% proficiency, ranked #9 of 139 in TN (top 6%) — families likely to look elsewhere, expect single-tenant / working-renter base with shorter leases.
- Zoned schools: North Side Elementary (math 32% / reading 37%, grade F, #319 of 952 statewide, top 37%, 375 students, 0% FRL); Liberty Bell Middle School (math 43% / reading 38%, grade F, #42 of 333 statewide, top 13%, 898 students, 0% FRL); Science Hill High School (math 37% / reading 60%, grade D, #13 of 332 statewide, top 4%, 2,401 students, 0% FRL) — zoned schools average 0% FRL vs 44% district-wide (44 pts lower); this property's tenant base skews higher-income than the district average.
- Market conditions: Rents rising (+1.5%/yr); 207 active listings in the ZIP; 27 comparable units currently listed for rent nearby; rentals at typical pace (median 21d on market — plan ~3-4 weeks tenant-placement turnaround); 48% of comp listings sitting > 30 days — soft ceiling on asking rent; 1,155 units permitted in Washington County in 2024 (437 in 5+ unit buildings).
- This rent runs 31% of the median local income ($52k/yr) — at the standard rent-burdened threshold; future hikes will face affordability resistance.
Forward outlook
- Local home prices are declining (-3.0%/yr); year-one equity from $864 of loan paydown is wiped out by about $4k of value loss. Plan a longer hold.
- Washington County population projected at +9% by 2050 — modest demand growth; plan on rents tracking national, not racing it.
Negotiation context
- Only 2 days on market — expect competitive offers; lowballing is unlikely to land.
Risks & watch-outs
- Watch-outs: built in 1935 — expect roof / HVAC / electrical / plumbing capex.
Questions for the listing agent
- Built in 1935 — when were the roof, HVAC, electrical panel, plumbing, and water heater last replaced?
- Is there a deadline driving the sale (1031 exchange, divorce, estate, relocation)? That informs how much negotiation room exists.
- Crime grade is D in this area — have there been break-ins, vandalism, or insurance claims at this property in the last 3 years? What carrier currently insures it and at what premium?
- What's the average days-on-market for RENTAL listings here right now (not sales)? A rising rental-DOM trend means longer vacancies and softer asking-rent achievability than the comps imply.
- What's the recent tenant-quality profile in this submarket — average credit score on applications, eviction rate, late-payment / NSF rate, and stable-employment percentage? A property-management company in the area should have these aggregated.
- How much new for-sale + rental construction is in the pipeline within 1–3 miles? Heavy new supply typically softens prices + rents 12–24 months out; constrained supply supports both.
Investment metrics
- 1% rule
- 1.08% ✓
- Cap rate
- 9.18%
- Cash-on-cash
- 10.32%
- DSCR
- 1.46
- GRM
- 7.7
CMA / ARV
- ARV (on-the-fly)
- $226,096
- Comps found
- 12
Show comp detail 12 sales within ~0.75 mi
| Address | Dist | Beds/Ba | Sqft | Sold | Price | $/sf | Match |
|---|---|---|---|---|---|---|---|
| 916 Hillcrest Dr | 0.16mi | 2/2.0 | 1,066 (-2%) | 2mo | $301,000 | $282 | 84 |
| 922 Hillcrest Dr | 0.15mi | 3/1.0 (+1) | 1,062 (-2%) | 3mo | $240,000 | $226 | 82 |
| 314 8th Ave | 0.39mi | 3/1.0 (+1) | 1,102 (+1%) | 0mo | $133,000 | $121 | 74 |
| 204 Delaware St | 0.37mi | 2/1.0 | 1,011 (-7%) | 1mo | $210,000 | $208 | 70 |
| 1015 Knob Creek Rd | 0.45mi | 3/1.0 (+1) | 1,064 (-2%) | 3mo | $264,900 | $249 | 68 |
| 1011 Johnson Ave | 0.63mi | 3/1.5 (+1) | 1,080 (-1%) | 1mo | $240,000 | $222 | 62 |
| 304 1/2 Chilhowie Ave | 0.47mi | 3/2.0 (+1) | 1,000 (-8%) | 1mo | $232,000 | $232 | 55 |
| 423 Wilson Ave | 0.61mi | 2/1.0 | 975 (-10%) | 4mo | $174,000 | $178 | 51 |
| 1012 Lincoln Ave | 0.62mi | 3/1.0 (+1) | 1,178 (+8%) | 1mo | $225,000 | $191 | 51 |
| 507 Robinson Dr | 0.41mi | 3/1.0 (+1) | 936 (-14%) | 4mo | $180,000 | $192 | 50 |
| 621 Hamilton St | 0.64mi | 2/2.0 | 1,184 (+9%) | 6mo | $169,000 | $143 | 46 |
| 103 Harrison St | 0.68mi | 2/1.0 | 948 (-13%) | 5mo | $110,000 | $116 | 43 |
Match score weights: distance 35% · size 25% · config 20% · recency 20%. Top-matched comps best support the ARV.
Projected returns pro-forma
-3.0% appreciation · 1.51% rent growth · sell at horizon
- IRR
- -2.4%
- Equity multiple
- 0.91×
- Total profit
- $-3,110
- Equity at exit
- $18,638
- IRR
- 5.7%
- Equity multiple
- 1.40×
- Total profit
- $13,897
- Equity at exit
- $10,808
Cash invested: $35,000 (down + closing). Projections, not guarantees.
Landlord ↔ Tenant lean methodology
- Overall (STATE)
- 87 Strongly Landlord-Friendly
- State Tennessee
- 87 Strongly Landlord-Friendly · R+13
- County
- — inherits STATE
- City
- — inherits STATE
ZIP-level market 37604
- Home prices YoY
- -26.1%
- Rents YoY
- 1.5%
- Active inventory
- 207
- Price-to-rent
- 7.7×
Monthly cashflow live
- Estimated rent
- $1,345 high interval (Pro) →
- Mortgage (P&I)
- −$656
- Tax from tax record
- −$54 /mo · $648/yr
- Insurance
- −$52
- HOA
- −$0
- Vacancy / Maint / Mgmt
- −$282
- Net cashflow
- $301
Break-even live
UW: 25.0% down · 7.5% · 30yr · 1.5% tax · 5.0% vac · 8.0% maint · 8.0% mgmt
Financing live
Cash to close
- Down payment
- $31,250
- Closing costs
- $3,750
- Reserves months
- —
- Total cash needed
- —
Loan-product check · same deal, 3 products live
Conventional
25% down · 7.5% · 30yr
- Down + closing
- —
- Monthly P&I
- —
- Monthly cashflow
- —
- DSCR
- —
- Eligible?
- —
Personal DTI + credit; lowest rate.
DSCR
20% down · 8.5% · 30yr
- Down + closing
- —
- Monthly P&I
- —
- Monthly cashflow
- —
- DSCR
- —
- Eligible?
- —
No personal income docs; deal must DSCR.
Hard money
10% down · 12.0% · 12mo
- Down + closing
- —
- Monthly P&I
- —
- Monthly cashflow
- —
- DSCR
- —
- Eligible?
- —
Short-term bridge; refi at stabilization.
Rent comps 27 comps
| Address | Beds | Baths | Sqft | Rent | $/sqft | DOM | Units | Dist |
|---|---|---|---|---|---|---|---|---|
| 505 Stanley Ave Apt 03 Johnson City, TN | 2.0 | 1.0 | 800 | $950 | $1.19 | 44d | 1 | 0.06mi |
| 923 E Hillcrest Dr Unit 2 Johnson City, TN | 2.0 | 1.0 | 1100 | $1,500 | $1.36 | 13d | 1 | 0.13mi |
| 1220 Knob Creek Rd Unit 18 Johnson City, TN | 2.0 | 1.5 | 1200 | $1,200 | $1.00 | 13d | 1 | 0.39mi |
| 1408 Knob Creek Rd Unit 7 Johnson City, TN | 2.0 | 1.0 | 949 | $1,250 | $1.32 | 44d | 1 | 0.53mi |
| 722 Liberty Bell Blvd Unit 1397962P Johnson City, TN | 2.0 | 1.5 | 1194 | $3,434 | $2.88 | 13d | 1 | 0.64mi |
| 621 Hamilton St Johnson City, TN | 2.0 | 2.0 | 1184 | $1,725 | $1.46 | 21d | 1 | 0.65mi |
| 829 Hamilton St Johnson City, TN | 3.0 | 2.0 | 1324 | $2,100 | $1.59 | 21d | 1 | 0.69mi |
| 621 Lamont St Johnson City, TN | 3.0 | 1.0 | 925 | $1,500 | $1.62 | 13d | 1 | 0.72mi |
| 111 W Unaka Ave Apt 2 Johnson City, TN | 2.0 | 1.5 | 1150 | $1,450 | $1.26 | 44d | 1 | 0.72mi |
| 405 W Watauga Ave Unit WAT-34 Johnson City, TN | 1.0 | 1.0 | 872 | $1,150 | $1.32 | 44d | 1 | 0.73mi |
| 268 W Main St Unit WM-06 Johnson City, TN | 2.0 | 1.0 | 960 | $1,350 | $1.41 | 13d | 1 | 0.74mi |
| 608 W Watauga Ave Unit 3 Johnson City, TN | 2.0 | 1.5 | 1000 | $1,200 | $1.20 | 44d | 1 | 0.79mi |
| 250 W Main St Apt 7 Johnson City, TN | 1.0 | 1.0 | 700 | $750 | $1.07 | 13d | 1 | 0.81mi |
| 220 Highland Ave Unit 1397973P Johnson City, TN | 2.0 | 1.0 | 925 | $3,993 | $4.32 | 13d | 1 | 0.93mi |
| 1107 Miller St Johnson City, TN | 3.0 | 1.0 | 980 | $1,700 | $1.73 | 44d | 1 | 0.97mi |
| 234 Mockingbird Ln Johnson City, TN | 1.0–2.0 | 1.0–1.5 | 852 | $1,419 | $1.67 | 13d | 3 | 1.06mi |
| 116 E Market St Johnson City, TN | 2.0 | 2.5 | 1249 | $1,700 | $1.36 | 13d | 1 | 1.12mi |
| 616 W Maple St Unit 2 Johnson City, TN | 2.0 | 1.0 | 925 | $1,000 | $1.08 | 44d | 1 | 1.14mi |
| 1901 Knob Creek Rd Johnson City, TN | 1.0–2.0 | 1.0–1.5 | 650 | $1,495 | $2.30 | 44d | 1 | 1.15mi |
| 404 W Maple St Unit 1 Johnson City, TN | 2.0 | 1.0 | 1000 | $1,050 | $1.05 | 44d | 1 | 1.23mi |
| 407 S Roan St Johnson City, TN | 1.0 | 1.0 | 716 | $1,250 | $1.74 | 13d | 2 | 1.23mi |
| 703 E Unaka Ave Unit 1 Johnson City, TN | 2.0 | 1.0 | 1421 | $1,300 | $0.91 | 44d | 1 | 1.25mi |
| 701 W Locust St #22 Johnson City, TN | 2.0 | 1.5 | 1141 | $1,375 | $1.21 | 44d | 1 | 1.29mi |
| 1729 Mary St Johnson City, TN | 3.0 | 1.0 | 890 | $1,450 | $1.63 | 44d | 1 | 1.39mi |
| 1010 Buffalo St Unit 3 Johnson City, TN | 2.0 | 1.0 | 861 | $1,300 | $1.51 | 44d | 1 | 1.40mi |
| 611 E Mountcastle Dr Unit 4 Johnson City, TN | 2.0 | 1.5 | 1200 | $1,400 | $1.17 | 13d | 1 | 1.46mi |
| 2001 Indian Ridge Rd Johnson City, TN | 3.0 | 1.0 | 1236 | $1,800 | $1.46 | 13d | 1 | 1.47mi |
Listing history 2 events
-
2026-01-15status Pending
-
2026-01-13$125,000 Active
ⓘ Source: listings_history table (triggers on properties + properties_extension) + one-shot
backfill from property_details.listing_events for pre-trigger history.
Tax reassessment forecast TN · Resets to sale price
- Current annual tax
- $648 · $54/mo
- Projected year-2 tax
- $888 · $74/mo
- Expected delta
- +$240/yr (+$20/mo · 37.0%)
ⓘ Screening estimate from a state-policy table — verify with the county assessor before closing.
Climate risk First Street
- Flood 1/10 Low FEMA zone X (unshaded) · 0% chance over 30 yrs
- Wildfire 1/10 Low
- Heat 4/10 Moderate 7 d/yr ≥98°F today · 21 d/yr by 30 yrs out
- Wind 2/10 Low
- Air quality 2/10 Low 1 unhealthy d/yr today · 1 by 30 yrs out
Nearby sold comps map
Loading sold comps map…
Walkable amenities ~0.75 mi
Loading nearby amenities…
Taxation est. · year 1
- Rental income
- $16,142
- − Mortgage interest
- −$7,002
- − Property taxes
- −$648
- − Insurance
- −$625
- − Repairs & maintenance
- −$1,291
- − Management
- −$1,291
- − Depreciation
- −$3,636
- Taxable income
- $1,648
- Est. tax owed @ 24.0%
- −$395
- After-tax cash flow
- $3,217/yr
For passive investors: Depreciation is non-cash, so a rental often shows a tax loss while cash-flowing — sheltering income. Rental losses are passive: they offset passive income freely, and up to $25,000/yr can offset ordinary (W-2) income if you actively participate and your MAGI is under $100k (phasing out to $0 by $150k); unused losses carry forward. On sale, claimed depreciation is recaptured at up to 25%, and gains may owe capital-gains tax (a 1031 exchange can defer both). Figures are a year-1 estimate at your 24.0% rate — not tax advice; consult a CPA.
Schools (NCES district)
- District
- Johnson City
- NCES district ID
- 4702130
- Math proficiency
- 46% ▼ -14.00%
- Reading proficiency
- 47% ▼ -2.00%
- Median HH income
- $37,514
- Composite
- 38.69/100
- National rank
- #4143
- State rank
- #9 of 139 in TN
Livability — Johnson City
- Score
- 76/100
- State rank
- #8
- US rank
- #3349
Category grades
Schools grade is shown separately in the Schools card above.
Census & demographics
- Census place
- Johnson City, TN
- County
- Washington County · 129,006 people
- City population
- 99,926
- Metro
- Johnson City, TN
- Population (ZIP)
- 39,097
- Household income
- $52,345
- Rent vs Own
- Severe rent burden
- 2254.0
Population outlook (Washington County) Hauer SSP2
- Today (2025)
- 132,816 people
- By 2030
- 135,823 · +2.3%
- By 2040
- 140,897 · +6.1%
- By 2050
- 145,073 · +9.2%
- By 2075
- 156,386 · +17.7%
- By 2100
- 159,893 · +20.4%
Race, ethnicity, and origin ACS 2023
- Neighborhood character
- Predominantly White (83%)
- Race & ethnicity
- White 83% Hispanic / Latino 6% Black 6% Two or more races 5% Asian 1%
- Hispanic origin (detail)
- Mexican 3%
- Common ancestry
- Slovak 3% Serbian 3% Italian 3%
- Foreign-born
- 4% · Canada
- Languages at home
- 94% English-only · Spanish 4% Other Indo-European 1%
Political lean MEDSL · Washington
- 2024 margin
- Solid R (+39.5) · D 29.6% · R 69.1% · Other 1.3%
- 2008→2024 swing
- -6.0pp toward R · 2008: -33.5pp · 2024: -39.5pp
- All cycles
- 2024: R+39.5 2020: R+36.2 2016: R+42.9 2012: R+38.5 2008: R+33.5
Not yet ingested
- Civics
- —
Market trends
- HPI YoY
- ▼ -97.73%
- Current HPI
- 277.1137
- Rent YoY
- ▲ 1.51%
- Metro
- Johnson City, TN
- State GDP YoY
- ▲ 2.78%
- F500 in state
- 22
Industry mix (Fortune 500 HQ in TN)
| Industry | F500 HQs | Revenue |
|---|---|---|
| Healthcare | 3 | $91B |
|
||
| Retail | 3 | $72B |
|
||
| Transportation / Logistics | 1 | $88B |
|
||
| Paper / Packaging | 1 | $19B |
|
||
| Insurance | 1 | $13B |
|
||
| Energy | 1 | $12B |
|
||
Price history
2 events — show timeline
- 2026-01-15 Pending — TVRMLS
- 2026-01-13 Listed $125,000 TVRMLS
Property tax history
-0.4%/yrLatest (2025): $648 · +0.0% YoY. Source: county tax records.
Cash-flow waterfall
monthlySold comps — $/sqft
last 12 mo · ≤1 miLoading sold comps…