 Multi-family
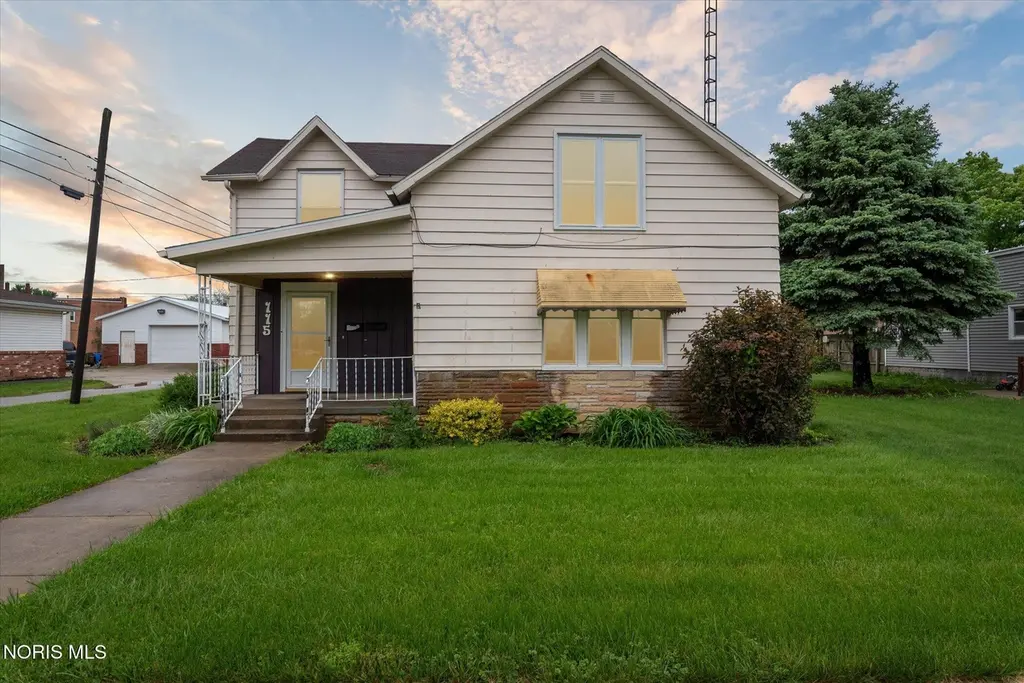
115 S 2nd St · North Baltimore, OH
Flood risk 1/10 · Minimal
- FEMA flood zone
- X (unshaded)
- Chance of flooding over 30 yrs
- 0.0%
- Est. flood insurance / yr
- $507 – $1,088
Fire risk 1/10 · Minimal
- Est. fire insurance / yr
- $713 – $1,323
Heat risk 3/10 · Minor
- Hot days now (above 99°F)
- 7 days/yr
- Hot days in 30 yrs
- 17 days/yr
Wind risk 2/10 · Minimal
- Chance of severe wind over 30 yrs
- —
Air-quality risk 2/10 · Minimal
- Unhealthy air days now
- 1 days/yr
- Unhealthy air days in 30 yrs
- 2 days/yr
Risk factors via First Street. Map © Google.
Why this score? — see what drove the D+ grade
The composite is a weighted blend of 9 inputs, each scored 0–100. Each bar is that input's sub-score; the figure is the points it added to the 100-point composite (weight × sub-score).
- Cash flow +23.3/30.0
- DSCR +7.5/10.0
- 1% rule +5.3/10.0
- Schools +4.4/10.0
- Livability +3.9/5.0
- Rent growth +2.5/5.0
- Condition / age +2.5/5.0
- ARV discount +0.0/15.0
- Appreciation +0.0/10.0
$209,900
🖨 Deal sheet 📄 Offer letter ✓ Due diligence
Multi-family units
County records classify this as Multi-Family (2-4 Unit). Listing-text estimate: 1 unit. estimate disagrees with records
Listing remarks MLS
2 separate homes on 1 lot. All utilities split. Ranch 2bed home on back with 1 car garage (newer). 3 bed home on front of the lot. Check with your lender for financing this unique property. Both tenants are month to month. No Deposits or leases. Put this in your rental portfolio or live in one and rent the other out!!
Key facts
- 0.24 acre lot
- 5 parking spots
- Built 1900
Property features AI
Finance
- Financial info: Residential income with 2 total units (both currently leased); 2 buildings; Tenants pay all utilities; Owner pays exterior maintenance, pest control, roof maintenance, trash collection, insurance, snow removal and taxes
Exterior
- Parking: Parking for 5 vehicles; Alley access; Driveway; Off-street parking; Shared driveway
- Utilities: Electricity connected; Natural gas connected; Public water; Public sewer; Trash service fee applies
- Home design: Residential income property (duplex); One and one half levels; 1 story reported
- Construction: Vinyl siding; Crawl space foundation
- Exterior features: Asphalt roof
Interior
- Kitchen: No appliances included
- Flooring: Carpet; Luxury vinyl
- Heating & cooling: Forced air heating; Radiant heating; Central air conditioning; Window units
- Interior features: Other
- Laundry & utility: Washer hookup; Electric dryer hookup
Neighborhood map
What this means for you Summary
Snapshot
- This is a 3-bed/2.0-bath multifamily listed at $210k.
Deal economics
- At list price, monthly cash flow is $383 ($5k/yr) — positive.
- The deal already cash-flows at list — no discount required.
- Meets the 1% rule at list price ($2k rent vs $210k).
- Recommended offer: $204k (3.0% below list) — sets the bar for market timing.
- Cap rate 8.5% vs local median 5.9% in North Baltimore — top-decile yield for the area; either an underpriced asset or a hidden risk that comps aren't pricing in. Stress-test before assuming the spread holds.
Location & tenants
- Location reads 78/100 on livability (#159 in OH, #2,395 nationally) — a middle-class / working-renter tenant base. Strengths: cost of living A+, housing A+, health & safety A+; Watch: amenities F, commute F.
- North Baltimore Local (town): math 45% / reading 58% proficiency, ranked #424 of 656 in OH (top 65%) — acceptable for families but not a draw, mixed tenant base, ~2y average lease.
- Zoned schools: E A Powell Elementary School (math 47% / reading 57%, grade C-, #851 of 1,584 statewide, top 56%, 367 students, 46% FRL); North Baltimore Middle School (math 52% / reading 57%, grade B-, #342 of 654 statewide, top 54%, 95 students, 0% FRL); North Baltimore High School (math 34% / reading 74%, grade C-, #303 of 781 statewide, top 42%, 136 students, 84% FRL) — zoned schools at 43% FRL track the district average.
- Market conditions: 32 active listings in the ZIP; 493 units permitted in Wood County in 2024 (48 in 5+ unit buildings).
- This rent runs 42% of the median local income ($62k/yr) — at the standard rent-burdened threshold; future hikes will face affordability resistance.
Forward outlook
- Local home prices are declining (-3.0%/yr); year-one equity from $1k of loan paydown is wiped out by about $6k of value loss. Plan a longer hold.
- Wood County population projected at +14% by 2050 — modest demand growth; plan on rents tracking national, not racing it.
Negotiation context
- It's been on market 45 days — a 3% lower offer ($204k) is reasonable based on typical stale-listing flexibility.
- 4 sale attempts since 5y ago with the ask held roughly flat each time — persistent listings suggest the price (not the market) is what's stuck; bring a comps-based counter.
- Current owner paid $115k; list at $210k implies a 83% gain — meaningful room to come down on a strong offer.
Risks & watch-outs
- Watch-outs: built in 1900 — expect roof / HVAC / electrical / plumbing capex.
Questions for the listing agent
- It's been on market 45 days. Have you received any prior offers? Is the seller open to a 3% concession, seller financing, or rate buy-down credit?
- Built in 1900 — when were the roof, HVAC, electrical panel, plumbing, and water heater last replaced?
- Is there a deadline driving the sale (1031 exchange, divorce, estate, relocation)? That informs how much negotiation room exists.
- Schools are B-rated — typically a magnet for longer-tenancy family renters. What's the average tenant stay here, and is there a school-zone premium baked into asking?
- The area grade is low — what's the realistic commute time and amenity access for the typical tenant pool here? Any planned neighborhood developments (good or bad) we should know about?
- What's the average days-on-market for RENTAL listings here right now (not sales)? A rising rental-DOM trend means longer vacancies and softer asking-rent achievability than the comps imply.
- What's the recent tenant-quality profile in this submarket — average credit score on applications, eviction rate, late-payment / NSF rate, and stable-employment percentage? A property-management company in the area should have these aggregated.
- How much new apartment / multifamily construction is in the pipeline within 1–3 miles? Heavy new supply (>2% of stock underway) typically softens rents 12–24 months out; light construction supports rent growth.
Investment metrics
- 1% rule
- 1.03% ✓
- Cap rate
- 8.48%
- Cash-on-cash
- 7.81%
- DSCR
- 1.35
- GRM
- 8.1
CMA / ARV
- ARV (median comp)
- $163,637
- List price
- $209,900
- Delta
- 28.27%
- Verdict
- OVERPRICED
- Comps
- 1 within 2.0 mi
Projected returns pro-forma
-3.0% appreciation · 3.0% rent growth · sell at horizon
- IRR
- -4.4%
- Equity multiple
- 0.84×
- Total profit
- $-9,689
- Equity at exit
- $31,297
- IRR
- 5.3%
- Equity multiple
- 1.39×
- Total profit
- $22,776
- Equity at exit
- $18,148
Cash invested: $58,772 (down + closing). Projections, not guarantees.
Landlord ↔ Tenant lean methodology
- Overall (STATE)
- 73 Landlord-Friendly
- State Ohio
- 73 Landlord-Friendly · R+6
- County
- — inherits STATE
- City
- — inherits STATE
ZIP-level market 45872
- Home prices YoY
- -11.5%
- Active inventory
- 32
- Price-to-rent
- 15.1×
Monthly cashflow live
- Estimated rent
- $2,172 medium interval (Pro) →
- Mortgage (P&I)
- −$1,101
- Tax from tax record
- −$145 /mo · $1,742/yr
- Insurance
- −$87
- HOA
- −$0
- Vacancy / Maint / Mgmt
- −$456
- Net cashflow
- $383
Break-even live
2-unit breakdown (identical units grouped — click to expand)
| Units | Beds | Baths | Est. rent |
|---|---|---|---|
| 1× unit | 3 | 1.5 | $1,155 |
| 1× unit | 2 | 1 | $1,017 |
| Total (2 units) | $2,172 | ||
UW: 25.0% down · 7.5% · 30yr · 1.5% tax · 5.0% vac · 8.0% maint · 8.0% mgmt
Financing live
Cash to close
- Down payment
- $52,475
- Closing costs
- $6,297
- Reserves months
- —
- Total cash needed
- —
Loan-product check · same deal, 3 products live
Conventional
25% down · 7.5% · 30yr
- Down + closing
- —
- Monthly P&I
- —
- Monthly cashflow
- —
- DSCR
- —
- Eligible?
- —
Personal DTI + credit; lowest rate.
DSCR
20% down · 8.5% · 30yr
- Down + closing
- —
- Monthly P&I
- —
- Monthly cashflow
- —
- DSCR
- —
- Eligible?
- —
No personal income docs; deal must DSCR.
Hard money
10% down · 12.0% · 12mo
- Down + closing
- —
- Monthly P&I
- —
- Monthly cashflow
- —
- DSCR
- —
- Eligible?
- —
Short-term bridge; refi at stabilization.
Listing history 28 events
-
2026-06-18days on market $209,900 Active 45 DOM
-
2026-06-17days on market $209,900 Active 44 DOM
-
2026-06-16days on market $209,900 Active 43 DOM
-
2026-06-15days on market $209,900 Active 42 DOM
-
2026-06-13days on market $209,900 Active 40 DOM
-
2026-06-12days on market $209,900 Active 39 DOM
-
2026-06-09days on market $209,900 Active 36 DOM
-
2026-06-08days on market $209,900 Active 35 DOM
-
2026-06-08days on market $209,900 Active 34 DOM
-
2026-06-07days on market $209,900 Active 33 DOM
-
2026-06-04pricedays on market $209,900 Active 30 DOM
-
2026-06-02days on market $219,900 Active 29 DOM
-
2026-06-01days on market $219,900 Active 28 DOM
-
2026-05-31days on market $219,900 Active 27 DOM
-
2026-04-29$219,900 Active 436-char remark
-
2026-03-22historical
-
2026-02-03$219,900 Active
-
2025-10-14price $115,000
Show marketing remark (327 chars)
2 separate homes on 1 lot. All utilities split. Ranch 2bed home on back with 1 car garage (newer). 3 bed home on front of the lot. Check with your lender for financing this unique property. Both tenants are month to month. No Deposits or leases. Put this in your rental portfolio or live in one and rent the other out!!
-
2025-06-23historical
-
2025-06-17price $219,900
-
2025-06-05price $229,900
-
2025-05-23$239,900 Active
-
2022-01-28soldstatus $115,000 Closed
Show marketing remark (327 chars)
2 separate homes on 1 lot. All utilities split. Ranch 2bed home on back with 1 car garage (newer). 3 bed home on front of the lot. Check with your lender for financing this unique property. Both tenants are month to month. No Deposits or leases. Put this in your rental portfolio or live in one and rent the other out!!
-
2022-01-28soldstatus $115,000
Show marketing remark (327 chars)
2 separate homes on 1 lot. All utilities split. Ranch 2bed home on back with 1 car garage (newer). 3 bed home on front of the lot. Check with your lender for financing this unique property. Both tenants are month to month. No Deposits or leases. Put this in your rental portfolio or live in one and rent the other out!!
-
2022-01-20status Pending
Show marketing remark (327 chars)
2 separate homes on 1 lot. All utilities split. Ranch 2bed home on back with 1 car garage (newer). 3 bed home on front of the lot. Check with your lender for financing this unique property. Both tenants are month to month. No Deposits or leases. Put this in your rental portfolio or live in one and rent the other out!!
-
2021-10-15historical Contingent
Show marketing remark (327 chars)
2 separate homes on 1 lot. All utilities split. Ranch 2bed home on back with 1 car garage (newer). 3 bed home on front of the lot. Check with your lender for financing this unique property. Both tenants are month to month. No Deposits or leases. Put this in your rental portfolio or live in one and rent the other out!!
-
2021-09-02$119,000 Active
Show marketing remark (327 chars)
2 separate homes on 1 lot. All utilities split. Ranch 2bed home on back with 1 car garage (newer). 3 bed home on front of the lot. Check with your lender for financing this unique property. Both tenants are month to month. No Deposits or leases. Put this in your rental portfolio or live in one and rent the other out!!
-
2021-08-31historical $119,000
Show marketing remark (327 chars)
2 separate homes on 1 lot. All utilities split. Ranch 2bed home on back with 1 car garage (newer). 3 bed home on front of the lot. Check with your lender for financing this unique property. Both tenants are month to month. No Deposits or leases. Put this in your rental portfolio or live in one and rent the other out!!
ⓘ Source: listings_history table (triggers on properties + properties_extension) + one-shot
backfill from property_details.listing_events for pre-trigger history.
Tax reassessment forecast OH · Partial reset (capped growth)
- Current annual tax
- $1,742 · $145/mo
- Projected year-2 tax
- $2,508 · $209/mo
- Expected delta
- +$766/yr (+$64/mo · 44.0%)
ⓘ Screening estimate from a state-policy table — verify with the county assessor before closing.
Climate risk First Street
- Flood 1/10 Low FEMA zone X (unshaded) · 0% chance over 30 yrs
- Wildfire 1/10 Low
- Heat 3/10 Moderate 7 d/yr ≥99°F today · 17 d/yr by 30 yrs out
- Wind 2/10 Low
- Air quality 2/10 Low 1 unhealthy d/yr today · 2 by 30 yrs out
Nearby sold comps map
Loading sold comps map…
Walkable amenities ~0.75 mi
Loading nearby amenities…
Taxation est. · year 1
- Rental income
- $26,064
- − Mortgage interest
- −$11,758
- − Property taxes
- −$1,742
- − Insurance
- −$1,050
- − Repairs & maintenance
- −$2,085
- − Management
- −$2,085
- − Depreciation
- −$6,106
- Taxable income
- $1,239
- Est. tax owed @ 24.0%
- −$297
- After-tax cash flow
- $4,293/yr
For passive investors: Depreciation is non-cash, so a rental often shows a tax loss while cash-flowing — sheltering income. Rental losses are passive: they offset passive income freely, and up to $25,000/yr can offset ordinary (W-2) income if you actively participate and your MAGI is under $100k (phasing out to $0 by $150k); unused losses carry forward. On sale, claimed depreciation is recaptured at up to 25%, and gains may owe capital-gains tax (a 1031 exchange can defer both). Figures are a year-1 estimate at your 24.0% rate — not tax advice; consult a CPA.
Schools (NCES district)
- District
- North Baltimore Local
- NCES district ID
- 3905070
- Math proficiency
- 45% ▼ -21.00%
- Reading proficiency
- 58% ▼ -12.00%
- Median HH income
- $47,242
- Composite
- 43.72/100
- National rank
- #2951
- State rank
- #424 of 656 in OH
Livability — North Baltimore
- Score
- 78/100
- State rank
- #159
- US rank
- #2395
Category grades
Schools grade is shown separately in the Schools card above.
Census & demographics
- Census place
- North Baltimore, OH
- County
- Wood · 127,168 people
- City population
- 4,572
- Metro
- Toledo, OH
- Population (ZIP)
- 4,572
- Household income
- $62,380
- Rent vs Own
- Severe rent burden
- 3.8
Population outlook (Wood County) Hauer SSP2
- Today (2025)
- 138,744 people
- By 2030
- 143,189 · +3.2%
- By 2040
- 150,896 · +8.8%
- By 2050
- 158,589 · +14.3%
- By 2075
- 182,166 · +31.3%
- By 2100
- 196,533 · +41.7%
Race, ethnicity, and origin ACS 2023
- Neighborhood character
- Predominantly White (94%)
- Race & ethnicity
- White 94% Hispanic / Latino 4% Two or more races 2% Black 2%
- Common ancestry
- Iranian 4% Romanian 2% Slovak 1%
- Foreign-born
- 0%
- Languages at home
- 98% English-only · Spanish 2%
Political lean MEDSL · Wood
- 2024 margin
- R (+10.2) · D 44.4% · R 54.6%
- 2008→2024 swing
- -17.3pp toward R · 2008: 7.1pp · 2024: -10.2pp
- All cycles
- 2024: R+10.2 2020: R+7.6 2016: R+8.5 2012: D+4.2 2008: D+7.1
Not yet ingested
- Civics
- —
Market trends
- HPI YoY
- ▼ -29.19%
- Current HPI
- 225.1072
- Rent YoY
- —
- Metro
- —
- State GDP YoY
- ▲ 1.98%
- F500 in state
- 48
Industry mix (Fortune 500 HQ in OH)
| Industry | F500 HQs | Revenue |
|---|---|---|
| Insurance | 3 | $145B |
|
||
| Industrial Machinery | 3 | $49B |
|
||
| Financial Services | 3 | $24B |
|
||
| Consumer Goods | 2 | $93B |
|
||
| Aerospace / Defense | 2 | $47B |
|
||
| Utilities | 2 | $33B |
|
||
Price history
+76.4% since first listed15 events — show timeline
- 2026-06-03 Price Changed $209,900 NORIS
- 2026-04-29 Listed $219,900 NORIS
- 2026-03-22 Listing Removed — NORIS
- 2026-02-03 Listed $219,900 NORIS
- 2025-10-14 Price Changed $115,000 NORIS
- 2025-06-23 Listing Removed — NORIS
- 2025-06-17 Price Changed $219,900 NORIS
- 2025-06-05 Price Changed $229,900 NORIS
- 2025-05-23 Listed $239,900 NORIS
- 2022-01-28 Sold (Public Records) $115,000 Public Records
- 2022-01-28 Sold (MLS) $115,000 NORIS
- 2022-01-20 Pending — NORIS
- 2021-10-15 Contingent — NORIS
- 2021-09-02 Listed $119,000 NORIS
- 2021-08-31 Coming Soon $119,000 NORIS
Property tax history
+3.0%/yrLatest (2025): $1,742 · +1.0% YoY. Source: county tax records.
Cash-flow waterfall
monthlySold comps — $/sqft
last 12 mo · ≤1 miLoading sold comps…