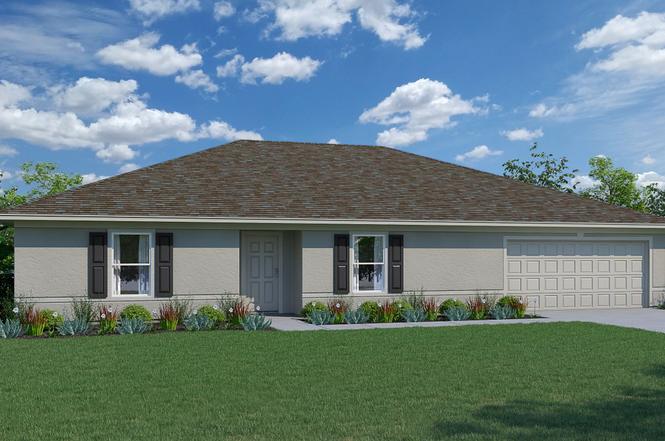
6454 Whelan St · Englewood, FL
Flood risk 5/10 · Moderate
- FEMA flood zone
- X (unshaded)
- Chance of flooding over 30 yrs
- 0.22%
- Est. flood insurance / yr
- $507 – $1,088
Fire risk 2/10 · Minimal
- Est. fire insurance / yr
- $947 – $1,759
Heat risk 10/10 · Severe
- Hot days now (above 107°F)
- 7 days/yr
- Hot days in 30 yrs
- 30 days/yr
Wind risk 10/10 · Severe
- Chance of severe wind over 30 yrs
- 99.0%
Air-quality risk 2/10 · Minimal
- Unhealthy air days now
- 1 days/yr
- Unhealthy air days in 30 yrs
- 1 days/yr
Risk factors via First Street. Map © Google.
Why this score? — see what drove the D grade
The composite is a weighted blend of 9 inputs, each scored 0–100. Each bar is that input's sub-score; the figure is the points it added to the 100-point composite (weight × sub-score).
- ARV discount +11.7/15.0
- Cash flow +10.9/30.0
- Schools +4.6/10.0
- Livability +3.7/5.0
- 1% rule +3.2/10.0
- DSCR +3.1/10.0
- Rent growth +2.5/5.0
- Condition / age +2.5/5.0
- Appreciation +0.0/10.0
$354,000
🖨 Deal sheet (PDF) 📄 Offer letter ✓ Due diligence
Key facts
- Open concept kitchen
- Digital thermostat
- A/c system
Tags
Property features AI
Finance
- Other: Address: 6454 Whelan St, Englewood FL 34224; List price $354,000; Listing provided by Zillow; Inventory type: Spec; Listing last modified May 21, 2026
Exterior
- Parking: 2 garage spaces (2 total parking spaces)
- Home design: Single-family property; Majestic floor plan
- Exterior features: Living area of 2,134 (listed)
Interior
- Bedrooms: 4 bedrooms
- Bathrooms: 2 full bathrooms
- Interior features: Spec home — Majestic plan; Active listing
Neighborhood map
What this means for you Summary
Snapshot
- This is a 4-bed/2.0-bath single-family listed at $354k.
Deal economics
- At list price, monthly cash flow is $-158 ($-2k/yr) — negative.
- To cash-flow at today's rent, offer at most $331k (6.5% below list).
- To meet the 1% rule (rent ≥ 1% of price), the offer needs to be $290k (18.2% below list).
- Recommended offer: $290k (18.2% below list) — sets the bar for 1% rule.
- Cap rate 5.8% vs local median 3.8% in Englewood — top-decile yield for the area; either an underpriced asset or a hidden risk that comps aren't pricing in. Stress-test before assuming the spread holds.
Location & tenants
- Location reads 73/100 on livability (#321 in FL) — a middle-class / working-renter tenant base. Strengths: housing A+, cost of living A, health & safety A; Watch: employment C-, amenities F, commute F.
- Charlotte (suburban): math 54% / reading 54% proficiency, ranked #22 of 73 in FL (top 30%) — acceptable for families but not a draw, mixed tenant base, ~2y average lease.
- Zoned schools: Vineland Elementary School (math 74% / reading 67%, grade A-, #333 of 2,144 statewide, top 16%, 579 students, 45% FRL); L. A. Ainger Middle School (math 65% / reading 53%, grade B, #144 of 571 statewide, top 26%, 720 students, 40% FRL); Lemon Bay High School (math 50% / reading 56%, grade C-, #148 of 667 statewide, top 23%, 1,360 students, 28% FRL) — zoned schools average 38% FRL vs 54% district-wide (16 pts lower); this property's tenant base skews higher-income than the district average.
- Market conditions: Rents soft (-0.1%/yr); 742 active listings in the ZIP; 9 comparable units currently listed for rent nearby; rentals at typical pace (median 24d on market — plan ~3-4 weeks tenant-placement turnaround); 4,585 units permitted in Charlotte County in 2024 (703 in 5+ unit buildings).
- At $2,897/mo this rent would consume 61% of the median local household income ($57k/yr) (locally 329% of renters already pay >50% of income on rent) — very limited rent-growth headroom before tenants either downsize or default.
Forward outlook
- Local home prices are declining (-3.0%/yr); year-one equity from $2k of loan paydown is wiped out by about $11k of value loss. Plan a longer hold.
- Charlotte County population projected at +24% by 2050 — long-run rental-demand tailwind backs the buy-and-hold thesis.
Negotiation context
- It's been on market 520 days — a 12% lower offer ($312k) is reasonable based on typical stale-listing flexibility.
Risks & watch-outs
- Climate carrying-cost: moderate flood risk; severe wind risk, 99% chance of damaging wind over 30y; extreme-heat days projected 7→30/yr by 2055 (HVAC capex compounding) — expect insurance premiums to compound above CPI over the hold.
Questions for the listing agent
- What do current leases actually rent for vs. the listed asking? Can we see a recent rent roll and the last 12 months of T-12 income?
- It's been on market 520 days. Have you received any prior offers? Is the seller open to a 18% concession, seller financing, or rate buy-down credit?
- Why hasn't it sold? Are there any deal-killer items the seller is aware of (foundation, flood, title, zoning, code violations)?
- Is there a deadline driving the sale (1031 exchange, divorce, estate, relocation)? That informs how much negotiation room exists.
- Schools are A-rated — typically a magnet for longer-tenancy family renters. What's the average tenant stay here, and is there a school-zone premium baked into asking?
- The area grade is low — what's the realistic commute time and amenity access for the typical tenant pool here? Any planned neighborhood developments (good or bad) we should know about?
- What's the average days-on-market for RENTAL listings here right now (not sales)? A rising rental-DOM trend means longer vacancies and softer asking-rent achievability than the comps imply.
- What's the recent tenant-quality profile in this submarket — average credit score on applications, eviction rate, late-payment / NSF rate, and stable-employment percentage? A property-management company in the area should have these aggregated.
- How much new for-sale + rental construction is in the pipeline within 1–3 miles? Heavy new supply typically softens prices + rents 12–24 months out; constrained supply supports both.
Investment metrics
- 1% rule
- 0.82% ✗
- Cap rate
- 5.76%
- Cash-on-cash
- -1.91%
- DSCR
- 0.91
- GRM
- 10.2
CMA / ARV
- ARV (on-the-fly)
- $390,522
- Comps found
- 8
Show comp detail 8 sales within ~0.75 mi
| Address | Dist | Beds/Ba | Sqft | Sold | Price | $/sf | Match |
|---|---|---|---|---|---|---|---|
| 9363 Steubenville Ave | 0.23mi | 3/2.0 (-1) | 1,985 (-7%) | 6mo | $475,000 | $239 | 68 |
| 10107 Tramore Ave | 0.58mi | 4/4.0 | 2,106 (-1%) | 1mo | $399,000 | $189 | 62 |
| 10107 Bentley Ave | 0.66mi | 4/2.0 | 2,133 (-0%) | 12mo | $390,000 | $183 | 59 |
| 7062 Spinnaker Blvd | 0.48mi | 3/2.0 (-1) | 2,057 (-4%) | 18mo | $340,000 | $165 | 52 |
| 9131 Berendo Ave | 0.72mi | 3/2.0 (-1) | 2,313 (+8%) | 8mo | $403,400 | $174 | 40 |
| 9015 Anita Ave | 0.57mi | 3/2.0 (-1) | 1,816 (-15%) | 4mo | $291,000 | $160 | 40 |
| 7048 Inland St | 0.57mi | 3/2.0 (-1) | 1,827 (-14%) | 11mo | $290,000 | $159 | 35 |
| 8527 Creekview Ln | 0.68mi | 3/2.0 (-1) | 1,922 (-10%) | 16mo | $420,000 | $219 | 34 |
Match score weights: distance 35% · size 25% · config 20% · recency 20%. Top-matched comps best support the ARV.
Projected returns pro-forma
-3.0% appreciation · 0.0% rent growth · sell at horizon
- IRR
- -22.9%
- Equity multiple
- 0.23×
- Total profit
- $-75,880
- Equity at exit
- $52,783
- IRR
- -27.7%
- Equity multiple
- -0.13×
- Total profit
- $-111,671
- Equity at exit
- $30,607
Cash invested: $99,120 (down + closing). Projections, not guarantees.
Landlord ↔ Tenant lean methodology
- Overall (STATE)
- 87 Strongly Landlord-Friendly
- State Florida
- 87 Strongly Landlord-Friendly · R+3
- County
- — inherits STATE
- City
- — inherits STATE
ZIP-level market 34224
- Home prices YoY
- -18.9%
- Rents YoY
- -0.1%
- Active inventory
- 742
- Price-to-rent
- 10.2×
Monthly cashflow live
- Estimated rent
- $2,897 high interval (Pro) →
- Mortgage (P&I)
- −$1,856
- Tax est. 1.5%
- −$442 /mo · $5,310/yr
- Insurance
- −$148
- HOA
- −$0
- Lot rent
- −$0
- Vacancy / Maint / Mgmt
- −$608
- Net cashflow
- $-158
Break-even live
Sensitivity live
| Price | -10% $87 | -5% $-36 | +0% $-158 | +5% $-280 | +10% $-403 |
|---|---|---|---|---|---|
| Rent | -10% $-387 | -5% $-273 | +0% $-158 | +5% $-44 | +10% $71 |
| Rate | -1.0pp $20 | -0.5pp $-68 | base $-158 | +0.5pp $-250 | +1.0pp $-343 |
UW: 25.0% down · 7.5% · 30yr · 1.5% tax · 5.0% vac · 8.0% maint · 8.0% mgmt
Financing live
Cash to close
- Down payment
- $88,500
- Closing costs
- $10,620
- Reserves months
- —
- Total cash needed
- —
Loan-product check · same deal, 3 products live
Conventional
25% down · 7.5% · 30yr
- Down + closing
- —
- Monthly P&I
- —
- Monthly cashflow
- —
- DSCR
- —
- Eligible?
- —
Personal DTI + credit; lowest rate.
DSCR
20% down · 8.5% · 30yr
- Down + closing
- —
- Monthly P&I
- —
- Monthly cashflow
- —
- DSCR
- —
- Eligible?
- —
No personal income docs; deal must DSCR.
Hard money
10% down · 12.0% · 12mo
- Down + closing
- —
- Monthly P&I
- —
- Monthly cashflow
- —
- DSCR
- —
- Eligible?
- —
Short-term bridge; refi at stabilization.
Rent comps 9 comps
| Address | Beds | Baths | Sqft | Rent | $/sqft | DOM | Units | Dist |
|---|---|---|---|---|---|---|---|---|
| 9400 New Martinsville Ave Englewood, FL | 3.0 | 2.0 | 1879 | $3,300 | $1.76 | 23d | 1 | 0.40mi |
| 7160 Carlsbad Ter Englewood, FL | 3.0 | 2.0 | 2061 | $4,500 | $2.18 | 23d | 1 | 0.48mi |
| 6320 Brookridge St Englewood, FL | 3.0 | 2.0 | 1445 | $5,550 | $3.84 | 23d | 1 | 0.55mi |
| 7344 Brookhaven Ter Englewood, FL | 3.0 | 2.0 | 1594 | $2,095 | $1.31 | 23d | 1 | 0.79mi |
| 10123 Bay Ave Englewood, FL | 3.0 | 2.0 | 2010 | $2,150 | $1.07 | 23d | 1 | 0.81mi |
| 10136 Willmington Blvd Englewood, FL | 3.0 | 2.0 | 1598 | $2,000 | $1.25 | 23d | 1 | 0.97mi |
| 502 Sunset Rd N Rotonda West, FL | 3.0 | 2.0 | 1636 | $2,100 | $1.28 | 23d | 1 | 1.19mi |
| 6305 Shaw St Englewood, FL | 3.0 | 2.0 | 1525 | $2,100 | $1.38 | 23d | 1 | 1.38mi |
| 7114 Sunnybrook Blvd Englewood, FL | 4.0 | 2.0 | 1636 | $2,297 | $1.40 | 23d | 1 | 1.49mi |
Listing history 16 events
-
2026-06-23days on market $354,000 Active 520 DOM
-
2026-06-22days on market $354,000 Active 519 DOM
-
2026-06-18days on market $354,000 Active 516 DOM
-
2026-06-17days on market $354,000 Active 515 DOM
-
2026-06-16days on market $354,000 Active 514 DOM
-
2026-06-15days on market $354,000 Active 513 DOM
-
2026-06-14days on market $354,000 Active 511 DOM
-
2026-06-13days on market $354,000 Active 510 DOM
-
2026-06-10days on market $354,000 Active 508 DOM
-
2026-06-09days on market $354,000 Active 507 DOM
-
2026-06-08days on market $354,000 Active 506 DOM
-
2026-06-05days on market $354,000 Active 502 DOM
-
2026-06-02days on market $354,000 Active 500 DOM
-
2026-06-01days on market $354,000 Active 499 DOM
-
2026-05-31days on market $354,000 Active 498 DOM
-
2026-05-30days on market $354,000 Active 497 DOM
ⓘ Source: listings_history table (triggers on properties + properties_extension) + one-shot
backfill from property_details.listing_events for pre-trigger history.
Climate risk First Street
- Flood 5/10 Major FEMA zone X (unshaded) · 22% chance over 30 yrs
- Wildfire 2/10 Low
- Heat 10/10 Extreme 7 d/yr ≥107°F today · 30 d/yr by 30 yrs out
- Wind 10/10 Extreme 99% chance of damaging wind over 30 yrs
- Air quality 2/10 Low 1 unhealthy d/yr today · 1 by 30 yrs out
Nearby sold comps map
Loading sold comps map…
Walkable amenities ~0.75 mi
Loading nearby amenities…
Taxation est. · year 1
- Rental income
- $34,759
- − Mortgage interest
- −$19,830
- − Property taxes
- −$5,310
- − Insurance
- −$1,770
- − Repairs & maintenance
- −$2,781
- − Management
- −$2,781
- − Depreciation
- −$10,298
- Taxable loss
- −$8,010
- Est. tax savings @ 24.0%
- +$1,922
- After-tax cash flow
- $25/yr
For passive investors: Depreciation is non-cash, so a rental often shows a tax loss while cash-flowing — sheltering income. Rental losses are passive: they offset passive income freely, and up to $25,000/yr can offset ordinary (W-2) income if you actively participate and your MAGI is under $100k (phasing out to $0 by $150k); unused losses carry forward. On sale, claimed depreciation is recaptured at up to 25%, and gains may owe capital-gains tax (a 1031 exchange can defer both). Figures are a year-1 estimate at your 24.0% rate — not tax advice; consult a CPA.
Schools (NCES district)
- District
- Charlotte
- NCES district ID
- 1200240
- Math proficiency
- 54% ▼ -6.00%
- Reading proficiency
- 54% ▼ -1.00%
- Median HH income
- $44,864
- Composite
- 45.62/100
- National rank
- #2586
- State rank
- #22 of 73 in FL
Livability — Englewood
- Score
- 73/100
- State rank
- #321
- US rank
- #5655
Category grades
Schools grade is shown separately in the Schools card above.
Census & demographics
- County
- Charlotte County · 196,994 people
- City population
- 35,420
- Metro
- Punta Gorda, FL
- Population (ZIP)
- 15,536
- Household income
- $57,281
- Rent vs Own
- Severe rent burden
- 329.0
Population outlook (Charlotte County) Hauer SSP2
- Today (2025)
- 198,646 people
- By 2030
- 210,507 · +6.0%
- By 2040
- 230,857 · +16.2%
- By 2050
- 247,148 · +24.4%
- By 2075
- 281,777 · +41.8%
- By 2100
- 293,609 · +47.8%
Race, ethnicity, and origin ACS 2023
- Neighborhood character
- Predominantly White (92%)
- Race & ethnicity
- White 92% Two or more races 5% Hispanic / Latino 3% Asian 1%
- Common ancestry
- Romanian 4% Slovak 4% Lithuanian 4%
- Foreign-born
- 9% · Canada
- Languages at home
- 92% English-only · Other Indo-European 2% Spanish 2% German/W. Germanic 1%
Political lean MEDSL · Charlotte
- 2024 margin
- Solid R (+34.0) · D 32.7% · R 66.7%
- 2008→2024 swing
- -26.7pp toward R · 2008: -7.2pp · 2024: -34.0pp
- All cycles
- 2024: R+34.0 2020: R+26.6 2016: R+27.8 2012: R+14.3 2008: R+7.2
Not yet ingested
- Civics
- —
Market trends
- HPI YoY
- ▼ -75.76%
- Current HPI
- 325.0345
- Rent YoY
- ▼ -0.11%
- Metro
- Punta Gorda, FL
- State GDP YoY
- ▲ 3.28%
- F500 in state
- 36
Industry mix (Fortune 500 HQ in FL)
| Industry | F500 HQs | Revenue |
|---|---|---|
| Industrial Technology | 2 | $29B |
|
||
| Insurance | 2 | $17B |
|
||
| Retail | 1 | $60B |
|
||
| Technology Distribution | 1 | $58B |
|
||
| Homebuilding | 1 | $35B |
|
||
| Technology Manufacturing | 1 | $35B |
|
||
Cash-flow waterfall
monthlySold comps — $/sqft
last 12 mo · ≤1 miLoading sold comps…