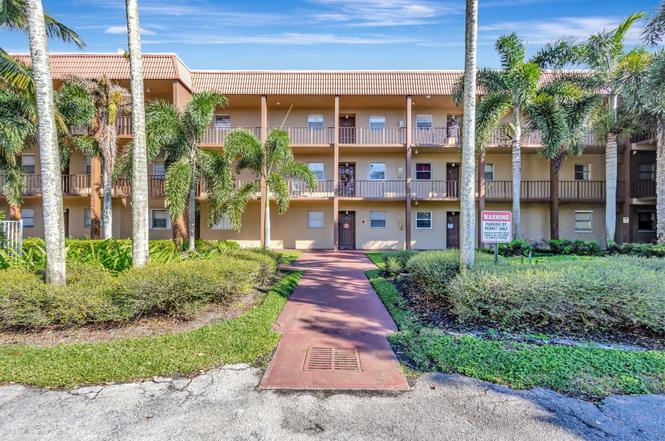
120 Sparrow Dr #213 · Royal Palm Beach, FL
Flood risk 1/10 · Minimal
- FEMA flood zone
- X (unshaded)
- Chance of flooding over 30 yrs
- 0.0%
- Est. flood insurance / yr
- $507 – $1,088
Fire risk 2/10 · Minimal
- Est. fire insurance / yr
- $947 – $1,759
Heat risk 9/10 · Severe
- Hot days now (above 107°F)
- 7 days/yr
- Hot days in 30 yrs
- 25 days/yr
Wind risk 10/10 · Severe
- Chance of severe wind over 30 yrs
- 99.0%
Air-quality risk 2/10 · Minimal
- Unhealthy air days now
- 0 days/yr
- Unhealthy air days in 30 yrs
- 1 days/yr
Risk factors via First Street. Map © Google.
Why this score? — see what drove the C- grade
The composite is a weighted blend of 9 inputs, each scored 0–100. Each bar is that input's sub-score; the figure is the points it added to the 100-point composite (weight × sub-score).
- Cash flow +11.3/30.0
- Appreciation +10.0/10.0
- ARV discount +7.5/15.0
- 1% rule +6.9/10.0
- Schools +4.3/10.0
- Livability +4.0/5.0
- DSCR +3.3/10.0
- Rent growth +2.7/5.0
- Condition / age +2.5/5.0
$170,000
🖨 Deal sheet 📄 Offer letter ✓ Due diligence
Listing remarks
Discover exceptional value in this 2-bedroom, 2-bathroom condo located on the 2nd floor of the desirable Park View at Palm Beach Condo community in Royal Palm Beach. Priced at just $175,000, this residence offers comfort, convenience, and an unbeatable location. Step inside to an inviting layout featuring a bright living area, a well-appointed kitchen, and two spacious bedrooms—each with its own full bathroom for added privacy. Enjoy serene views and refreshing breezes from the second-floor setting. Park View at Palm Beach offers a peaceful, well-maintained environment and is ideally situated directly across from Veterans Park, providing beautiful green spaces, walking paths, and comm
Key facts
- $450 HOA
- Community pool
- Built 1975
Neighborhood map
What this means for you Summary
Snapshot
- This is a 2-bed/2.0-bath condo listed at $170k.
Deal economics
- At list price, monthly cash flow is $-62 ($-740/yr) — negative.
- To cash-flow at today's rent, offer at most $159k (6.4% below list).
- Meets the 1% rule at list price ($2k rent vs $170k).
- Recommended offer: $155k (9.0% below list) — sets the bar for market timing.
Location & tenants
- Location reads 79/100 on livability (#135 in FL, #2,039 nationally) — a middle-class / working-renter tenant base. Strengths: employment A+, housing A+, health & safety A+; Watch: cost of living C-, amenities F, commute F.
- Palm Beach (suburban): math 46% / reading 53% proficiency, ranked #34 of 73 in FL (top 47%) — families likely to look elsewhere, expect single-tenant / working-renter base with shorter leases.
- Market conditions: Rents flat; 574 active listings in the ZIP; 31 comparable units currently listed for rent nearby; rentals at typical pace (median 21d on market — plan ~3-4 weeks tenant-placement turnaround); solid renter incomes; 3,974 units permitted in Palm Beach County in 2024 (1,012 in 5+ unit buildings).
Forward outlook
- In year one you build about $18k of equity ($1k loan paydown + $17k appreciation (10.0% local appreciation)).
- Palm Beach County population projected at +30% by 2050 — long-run rental-demand tailwind backs the buy-and-hold thesis.
- At projected returns (10.0% appreciation + 0.8% rent growth), your $48k cash investment doubles in ~3 years — after that, you're playing with house money.
- By year 3, paydown + projected appreciation supports a ~$46k cash-out refi (75% LTV) — recoverable capital for the next deal without selling this one.
Negotiation context
- It's been on market 117 days — a 9% lower offer ($155k) is reasonable based on typical stale-listing flexibility.
- 15 sale attempts since 20y ago with the ask held roughly flat each time — persistent listings suggest the price (not the market) is what's stuck; bring a comps-based counter.
- Current owner paid $115k; 48% above their basis — modest negotiation headroom, anchor on the comps not their cost.
Risks & watch-outs
- Watch-outs: HOA is 22% of rent.
- Climate carrying-cost: severe wind risk, 99% chance of damaging wind over 30y; extreme-heat days projected 7→25/yr by 2055 (HVAC capex compounding) — expect insurance premiums to compound above CPI over the hold.
Questions for the listing agent
- What do current leases actually rent for vs. the listed asking? Can we see a recent rent roll and the last 12 months of T-12 income?
- It's been on market 117 days. Have you received any prior offers? Is the seller open to a 9% concession, seller financing, or rate buy-down credit?
- Built in 1975 — when were the roof, HVAC, electrical panel, plumbing, and water heater last replaced?
- What does the HOA fee cover, when was the last increase, and are there any pending special assessments or reserve-fund shortfalls?
- Any open or pending special assessments — roof, HVAC, plumbing, elevator, façade? What's the per-unit balance and payoff schedule, and is the seller paying it off at close or rolling it to the buyer?
- Why hasn't it sold? Are there any deal-killer items the seller is aware of (foundation, flood, title, zoning, code violations)?
- Is there a deadline driving the sale (1031 exchange, divorce, estate, relocation)? That informs how much negotiation room exists.
- Schools are B-rated — typically a magnet for longer-tenancy family renters. What's the average tenant stay here, and is there a school-zone premium baked into asking?
- What's the average days-on-market for RENTAL listings here right now (not sales)? A rising rental-DOM trend means longer vacancies and softer asking-rent achievability than the comps imply.
- What's the recent tenant-quality profile in this submarket — average credit score on applications, eviction rate, late-payment / NSF rate, and stable-employment percentage? A property-management company in the area should have these aggregated.
- How much new apartment / multifamily construction is in the pipeline within 1–3 miles? Heavy new supply (>2% of stock underway) typically softens rents 12–24 months out; light construction supports rent growth.
Investment metrics
- 1% rule
- 1.19% ✓
- Cap rate
- 5.86%
- Cash-on-cash
- -1.56%
- DSCR
- 0.93
- GRM
- 7.0
CMA / ARV
No comps found within radius.
Projected returns pro-forma
10.0% appreciation · 0.85% rent growth · sell at horizon
- IRR
- 22.3%
- Equity multiple
- 2.78×
- Total profit
- $84,694
- Equity at exit
- $153,149
- IRR
- 19.3%
- Equity multiple
- 6.15×
- Total profit
- $245,188
- Equity at exit
- $330,273
Cash invested: $47,600 (down + closing). Projections, not guarantees.
Landlord ↔ Tenant lean methodology
- Overall (STATE)
- 87 Strongly Landlord-Friendly
- State Florida
- 87 Strongly Landlord-Friendly · R+3
- County
- — inherits STATE
- City
- — inherits STATE
ZIP-level market 33411
- Home prices YoY
- 1.9%
- Rents YoY
- 0.8%
- Active inventory
- 574
- Price-to-rent
- 7.0×
Monthly cashflow live
- Estimated rent
- $2,027 high interval (Pro) →
- Mortgage (P&I)
- −$891
- Tax from tax record
- −$251 /mo · $3,012/yr
- Insurance
- −$71
- HOA
- −$450
- Vacancy / Maint / Mgmt
- −$426
- Net cashflow
- $-62
Break-even live
UW: 25.0% down · 7.5% · 30yr · 1.5% tax · 5.0% vac · 8.0% maint · 8.0% mgmt
Financing live
Cash to close
- Down payment
- $42,500
- Closing costs
- $5,100
- Reserves months
- —
- Total cash needed
- —
Loan-product check · same deal, 3 products live
Conventional
25% down · 7.5% · 30yr
- Down + closing
- —
- Monthly P&I
- —
- Monthly cashflow
- —
- DSCR
- —
- Eligible?
- —
Personal DTI + credit; lowest rate.
DSCR
20% down · 8.5% · 30yr
- Down + closing
- —
- Monthly P&I
- —
- Monthly cashflow
- —
- DSCR
- —
- Eligible?
- —
No personal income docs; deal must DSCR.
Hard money
10% down · 12.0% · 12mo
- Down + closing
- —
- Monthly P&I
- —
- Monthly cashflow
- —
- DSCR
- —
- Eligible?
- —
Short-term bridge; refi at stabilization.
Rent comps 31 comps
| Address | Beds | Baths | Sqft | Rent | $/sqft | DOM | Units | Dist |
|---|---|---|---|---|---|---|---|---|
| 120 Sparrow Dr Royal Palm Beach, FL | 2.0 | 2.0–2.5 | 793 | $2,200 | $2.77 | 22d | 2 | 0.02mi |
| 120 Sparrow Dr #205 Royal Palm Beach, FL | 2.0 | 2.0 | 793 | $2,200 | $2.77 | 24d | 1 | 0.03mi |
| 139 Sparrow Dr Royal Palm Beach, FL | 2.0–3.0 | 1.5–2.5 | 1100 | $1,850 | $1.68 | 15d | 3 | 0.21mi |
| 73 Macadamia Ct Royal Palm Beach, FL | 2.0 | 2.0 | 1112 | $2,000 | $1.80 | 11d | 1 | 0.30mi |
| 7 Greenway Vlg N Royal Palm Beach, FL | 1.0–2.0 | 1.5–2.0 | 930 | $1,700 | $1.83 | 17d | 2 | 0.31mi |
| 7 Greenway Vlg N #107 Royal Palm Beach, FL | 1.0 | 1.5 | 780 | $1,650 | $2.12 | 4d | 1 | 0.31mi |
| 2 Greenway Vlg N #210 Royal Palm Beach, FL | 2.0 | 2.0 | 1080 | $2,000 | $1.85 | 24d | 1 | 0.32mi |
| 4 Greenway Vlg N #203 Royal Palm Beach, FL | 2.0 | 2.0 | 1080 | $2,000 | $1.85 | 24d | 1 | 0.38mi |
| 149 West Ct Royal Palm Beach, FL | 1.0 | 1.0 | 648 | $1,800 | $2.78 | 11d | 1 | 0.41mi |
| 12009 Poinciana Blvd #102 Royal Palm Beach, FL | 1.0 | 1.0 | 660 | $1,500 | $2.27 | 24d | 1 | 0.45mi |
| 12007 Poinciana Blvd #205 Royal Palm Beach, FL | 2.0 | 2.0 | 1088 | $1,590 | $1.46 | 15d | 1 | 0.46mi |
| 12002 Poinciana Blvd #204 Royal Palm Beach, FL | 2.0 | 2.0 | 1048 | $1,750 | $1.67 | 24d | 1 | 0.51mi |
| 12021 W Greenway Dr #101 Royal Palm Beach, FL | 1.0 | 1.5 | 660 | $1,400 | $2.12 | 24d | 1 | 0.59mi |
| 4 W Greenway Dr Unit 201 Royal Palm Beach, FL | 1.0 | 1.5 | 780 | $1,450 | $1.86 | 24d | 1 | 0.61mi |
| 202 Sparrow Dr #1 Royal Palm Beach, FL | 3.0 | 2.0 | 1020 | $2,400 | $2.35 | 24d | 1 | 0.63mi |
| 210 Sparrow Dr #4 Royal Palm Beach, FL | 2.0 | 2.0 | 930 | $1,900 | $2.04 | 20d | 1 | 0.68mi |
| 263 Deerfield Ct Royal Palm Beach, FL | 2.0 | 2.0 | 1120 | $1,800 | $1.61 | 24d | 1 | 0.71mi |
| 1049 Grandview Cir Royal Palm Beach, FL | 3.0 | 2.0 | 792 | $3,100 | $3.91 | 17d | 1 | 0.78mi |
| 201 Seminole Lakes Dr Royal Palm Beach, FL | 1.0 | 1.0 | 800 | $1,400 | $1.75 | 24d | 1 | 0.81mi |
| 280 Crestwood Cir #204 Royal Palm Beach, FL | 2.0 | 2.0 | 1024 | $2,150 | $2.10 | 15d | 1 | 1.25mi |
| 310 Crestwood Ct N Unit 310 Royal Palm Beach, FL | 2.0 | 2.0 | 1112 | $2,250 | $2.02 | 4d | 1 | 1.36mi |
| 600 Crestwood Ct N #609 Royal Palm Beach, FL | 2.0 | 2.0 | 1112 | $2,250 | $2.02 | 15d | 1 | 1.40mi |
| 300 Crestwood Ct N #310 Royal Palm Beach, FL | 2.0 | 2.0 | 1112 | $2,250 | $2.02 | 4d | 1 | 1.41mi |
| 10324 Fox Trail Rd S Unit 324 Royal Palm Beach, FL | 2.0 | 2.0 | 1048 | $1,900 | $1.81 | 24d | 1 | 1.43mi |
| 10336 Fox Trail Rd S #1305 West Palm Beach, FL | 2.0 | 2.0 | 1048 | $2,100 | $2.00 | 24d | 1 | 1.43mi |
| 700 Crestwood Ct S #708 Royal Palm Beach, FL | 2.0 | 2.0 | 1075 | $2,750 | $2.56 | 24d | 1 | 1.44mi |
| 10354 Fox Trail Rd S #1501 West Palm Beach, FL | 2.0 | 2.0 | 1048 | $2,000 | $1.91 | 17d | 1 | 1.44mi |
| 10360 Fox Trail Rd S #1602 West Palm Beach, FL | 2.0 | 2.0 | 1048 | $1,920 | $1.83 | 20d | 1 | 1.46mi |
| 10342 Fox Trail Rd S Unit 342 Royal Palm Beach, FL | 1.0 | 1.0 | 784 | $1,700 | $2.17 | 24d | 1 | 1.46mi |
| 1000 Crestwood Ct S #1009 Royal Palm Beach, FL | 2.0 | 2.0 | 1112 | $2,200 | $1.98 | 7d | 1 | 1.47mi |
| 10306 Fox Trail Rd S #912 West Palm Beach, FL | 1.0 | 1.0 | 775 | $1,700 | $2.19 | 3d | 1 | 1.50mi |
HOA detail condo
- Monthly dues
- $450 · $5,400/yr
- Assessments
- None detected in remarks — confirm with the listing agent.
Listing history 38 events
-
2026-04-15status Pending
-
2026-01-09price $170,000
-
2026-01-09status Active
-
2025-12-10historical
-
2025-11-19$175,000 Active
-
2025-04-02historical
-
2025-02-28historical $1,850
-
2025-02-26status Active
-
2025-02-21$1,850
-
2025-01-08status Pending
-
2024-12-18price $179,000
-
2024-11-21$189,000 Active
-
2024-11-12historical $1,750
-
2024-09-28price $1,750
-
2024-09-17price $1,850
-
2024-09-07$1,995
-
2024-08-09historical $2,100
-
2024-04-19$2,100
-
2024-03-29historical
-
2024-03-29historical $1,995
-
2024-03-20price $1,995
-
2024-03-19$2,100
-
2024-02-29$225,000 Active
-
2019-09-18soldstatus $115,000
-
2019-06-07historical
-
2019-03-19$125,000 Active
-
2011-06-30soldstatus $26,000
-
2011-05-16historical
-
2011-04-29$27,900
-
2008-05-23historical
-
2007-10-13$136,900
-
2007-10-12historical
-
2007-09-28$149,900
-
2007-05-03historical
-
2007-03-01$179,900
-
2006-11-04historical
-
2006-07-05$189,900
-
2005-12-27soldstatus $174,900
ⓘ Source: listings_history table (triggers on properties + properties_extension) + one-shot
backfill from property_details.listing_events for pre-trigger history.
Tax reassessment forecast FL · Resets to sale price
- Current annual tax
- $3,012 · $251/mo
- Projected year-2 tax
- $3,012 · $251/mo
- Expected delta
- $0/yr ($0/mo · -0.0%)
ⓘ Screening estimate from a state-policy table — verify with the county assessor before closing.
Climate risk First Street
- Flood 1/10 Low FEMA zone X (unshaded) · 0% chance over 30 yrs
- Wildfire 2/10 Low
- Heat 9/10 Extreme 7 d/yr ≥107°F today · 25 d/yr by 30 yrs out
- Wind 10/10 Extreme 99% chance of damaging wind over 30 yrs
- Air quality 2/10 Low 0 unhealthy d/yr today · 1 by 30 yrs out
Nearby sold comps map
Loading sold comps map…
Walkable amenities ~0.75 mi
Loading nearby amenities…
Taxation est. · year 1
- Rental income
- $24,328
- − Mortgage interest
- −$9,523
- − Property taxes
- −$3,012
- − Insurance
- −$850
- − Repairs & maintenance
- −$1,946
- − Management
- −$1,946
- − HOA
- −$5,400
- − Depreciation
- −$4,945
- Taxable loss
- −$3,294
- Est. tax savings @ 24.0%
- +$791
- After-tax cash flow
- $50/yr
For passive investors: Depreciation is non-cash, so a rental often shows a tax loss while cash-flowing — sheltering income. Rental losses are passive: they offset passive income freely, and up to $25,000/yr can offset ordinary (W-2) income if you actively participate and your MAGI is under $100k (phasing out to $0 by $150k); unused losses carry forward. On sale, claimed depreciation is recaptured at up to 25%, and gains may owe capital-gains tax (a 1031 exchange can defer both). Figures are a year-1 estimate at your 24.0% rate — not tax advice; consult a CPA.
Schools (NCES district)
- District
- Palm Beach
- NCES district ID
- 1201500
- Math proficiency
- 46% ▼ -16.00%
- Reading proficiency
- 53% ▼ -4.00%
- Median HH income
- $53,943
- Composite
- 42.72/100
- National rank
- #3160
- State rank
- #34 of 73 in FL
Livability — Royal Palm Beach
- Score
- 79/100
- State rank
- #135
- US rank
- #2039
Category grades
Schools grade is shown separately in the Schools card above.
Census & demographics
- Census place
- Royal Palm Beach, FL
- County
- Palm Beach County · 1,438,312 people
- City population
- 222,012
- Metro
- Miami-Fort Lauderdale-Pompano Beach, FL
- Population (ZIP)
- 76,863
- Household income
- $92,591
- Rent vs Own
- Severe rent burden
- 1870.0
Population outlook (Palm Beach County) Hauer SSP2
- Today (2025)
- 1,637,487 people
- By 2030
- 1,743,255 · +6.5%
- By 2040
- 1,948,712 · +19.0%
- By 2050
- 2,132,979 · +30.3%
- By 2075
- 2,530,027 · +54.5%
- By 2100
- 2,706,979 · +65.3%
Race, ethnicity, and origin ACS 2023
- Neighborhood character
- Diverse neighborhood (Simpson 0.70)
- Race & ethnicity
- White 44% Hispanic / Latino 24% Black 23% Two or more races 16% Asian 5%
- Hispanic origin (detail)
- Mexican 2% Puerto Rican 5% Cuban 4% Dominican 2%
- Common ancestry
- Hispanic 6% Romanian 2% Italian 1%
- Foreign-born
- 26% · Canada, Jamaica, China
- Languages at home
- 73% English-only · Spanish 17% French/Haitian/Cajun 4% Other Indo-European 2%
Political lean MEDSL · Palm Beach
- 2024 margin
- Toss-up / Even · D 50.0% · R 49.2%
- 2008→2024 swing
- -22.1pp toward R · 2008: 22.9pp · 2024: 0.8pp
- All cycles
- 2024: D+0.8 2020: D+12.8 2016: D+15.3 2012: D+17.0 2008: D+22.9
Not yet ingested
- Civics
- —
Market trends
- HPI YoY
- ▲ 17.04%
- Current HPI
- 903.78
- Rent YoY
- ▲ 0.85%
- Metro
- Miami-Fort Lauderdale-Pompano Beach, FL
- State GDP YoY
- ▲ 3.28%
- F500 in state
- 36
Industry mix (Fortune 500 HQ in FL)
| Industry | F500 HQs | Revenue |
|---|---|---|
| Industrial Technology | 2 | $29B |
|
||
| Insurance | 2 | $17B |
|
||
| Retail | 1 | $60B |
|
||
| Technology Distribution | 1 | $58B |
|
||
| Homebuilding | 1 | $35B |
|
||
| Technology Manufacturing | 1 | $35B |
|
||
Price history
-2.8% since first listed38 events — show timeline
- 2026-04-15 Pending — Beaches MLS
- 2026-01-09 Price Changed $170,000 Beaches MLS
- 2026-01-09 Relisted — Beaches MLS
- 2025-12-10 Listing Removed — Beaches MLS
- 2025-11-19 Listed $175,000 Beaches MLS
- 2025-04-02 Listing Removed — Beaches MLS
- 2025-02-28 Rental Removed $1,850 RMLSFL
- 2025-02-26 Relisted — Beaches MLS
- 2025-02-21 Listed for Rent $1,850 RMLSFL
- 2025-01-08 Pending — Beaches MLS
- 2024-12-18 Price Changed $179,000 Beaches MLS
- 2024-11-21 Listed $189,000 Beaches MLS
- 2024-11-12 Rental Removed $1,750 RMLSFL
- 2024-09-28 Price Changed $1,750 RMLSFL
- 2024-09-17 Price Changed $1,850 RMLSFL
- 2024-09-07 Listed for Rent $1,995 RMLSFL
- 2024-08-09 Rental Removed $2,100 GFLMLS
- 2024-04-19 Listed for Rent $2,100 GFLMLS
- 2024-03-29 Listing Removed — Beaches MLS
- 2024-03-29 Rental Removed $1,995 GFLMLS
- 2024-03-20 Price Changed $1,995 GFLMLS
- 2024-03-19 Listed for Rent $2,100 GFLMLS
- 2024-02-29 Listed $225,000 Beaches MLS
- 2019-09-18 Sold (Public Records) $115,000 Public Records
- 2019-06-07 Listing Removed — Beaches MLS
- 2019-03-19 Listed $125,000 Beaches MLS
- 2011-06-30 Sold (MLS) $26,000 Beaches MLS
- 2011-05-16 Listing Removed — Beaches MLS
- 2011-04-29 Listed $27,900 Beaches MLS
- 2008-05-23 Listing Removed — Beaches MLS
- 2007-10-13 Listed $136,900 Beaches MLS
- 2007-10-12 Listing Removed — Beaches MLS
- 2007-09-28 Listed $149,900 Beaches MLS
- 2007-05-03 Listing Removed — Beaches MLS
- 2007-03-01 Listed $179,900 Beaches MLS
- 2006-11-04 Listing Removed — Beaches MLS
- 2006-07-05 Listed $189,900 Beaches MLS
- 2005-12-27 Sold (Public Records) $174,900 Public Records
Property tax history
+10.3%/yrLatest (2025): $3,012 · +5.0% YoY. Source: county tax records.
Cash-flow waterfall
monthlySold comps — $/sqft
last 12 mo · ≤1 miLoading sold comps…