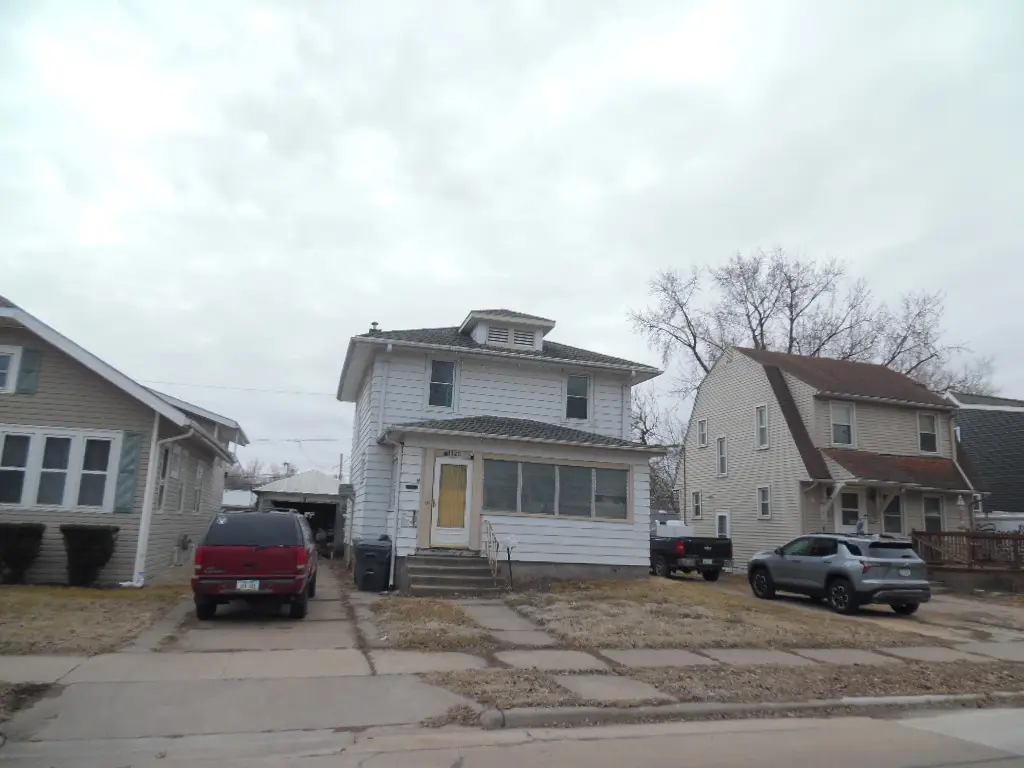
1125 8th Ave S · Clinton, IA
Flood risk 1/10 · Minimal
- FEMA flood zone
- X (unshaded)
- Chance of flooding over 30 yrs
- 0.0%
- Est. flood insurance / yr
- $473 – $860
Fire risk 3/10 · Minor
- Est. fire insurance / yr
- $902 – $1,676
Heat risk 3/10 · Minor
- Hot days now (above 103°F)
- 7 days/yr
- Hot days in 30 yrs
- 16 days/yr
Wind risk 2/10 · Minimal
- Chance of severe wind over 30 yrs
- —
Air-quality risk 3/10 · Minor
- Unhealthy air days now
- 2 days/yr
- Unhealthy air days in 30 yrs
- 3 days/yr
Risk factors via First Street. Map © Google.
Why this score? — see what drove the D+ grade
The composite is a weighted blend of 9 inputs, each scored 0–100. Each bar is that input's sub-score; the figure is the points it added to the 100-point composite (weight × sub-score).
- Cash flow +15.0/30.0
- ARV discount +7.5/15.0
- 1% rule +5.0/10.0
- DSCR +5.0/10.0
- Schools +4.5/10.0
- Livability +3.8/5.0
- Rent growth +2.5/5.0
- Condition / age +2.5/5.0
- Appreciation +0.0/10.0
$29,900
🖨 Deal sheet 📄 Offer letter ✓ Due diligence
Listing remarks
Large 4 bedroom, 1.5 baths with main floor laundry with lots of potential! This home is being sold As Is Where Is with everything included that has been left inside the garage, home and yard. The utilities are Not on so take a flashlight.
Key facts
- 4,800 sq ft lot
- Garage
- Built 1926
Neighborhood map
What this means for you Summary
Snapshot
- This is a 4-bed/1.0-bath single-family listed at $30k.
Deal economics
- At list price, monthly cash flow is $1k ($12k/yr) — positive.
- The deal already cash-flows at list — no discount required.
- Meets the 1% rule at list price ($2k rent vs $30k).
- Recommended offer: $26k (12.0% below list) — sets the bar for market timing.
- Cap rate 47.1% vs local median 6.7% in Clinton — top-decile yield for the area; either an underpriced asset or a hidden risk that comps aren't pricing in. Stress-test before assuming the spread holds.
Location & tenants
- Location reads 75/100 on livability (#222 in IA, #4,192 nationally) — a middle-class / working-renter tenant base. Strengths: cost of living A+, housing A+, health & safety A+; Watch: amenities C-, crime D, employment D.
- Clinton Community School District (town): math 52% / reading 56% proficiency, ranked #273 of 289 in IA (top 94%) — acceptable for families but not a draw, mixed tenant base, ~2y average lease.
- Market conditions: 246 active listings in the ZIP; 4 comparable units currently listed for rent nearby; rentals lingering (median 44d on market — plan ~5-8 weeks vacancy on turnover, expect pricing pressure); 100% of comp listings sitting > 30 days — soft ceiling on asking rent; 116 units permitted in Clinton County in 2024 (50 in 5+ unit buildings).
- This rent runs 30% of the median local income ($61k/yr) — at the standard rent-burdened threshold; future hikes will face affordability resistance.
Forward outlook
- Local home prices are declining (-3.0%/yr); year-one equity from $207 of loan paydown is wiped out by about $897 of value loss. Plan a longer hold.
- Clinton County population projected at -19% by 2050 — secular population decline; favor cash flow + early exit over multi-decade hold.
- At projected returns (-3.0% appreciation + 3.0% rent growth), your $8k cash investment doubles in ~1 year — after that, you're playing with house money.
Negotiation context
- It's been on market 136 days — a 12% lower offer ($26k) is reasonable based on typical stale-listing flexibility.
- 4 sale attempts; this cycle's ask has dropped $20k (40%) from the opening price — seller is motivated, your offer sets the floor, not the list.
Risks & watch-outs
- Watch-outs: built in 1926 — expect roof / HVAC / electrical / plumbing capex.
Questions for the listing agent
- It's been on market 136 days. Have you received any prior offers? Is the seller open to a 12% concession, seller financing, or rate buy-down credit?
- Built in 1926 — when were the roof, HVAC, electrical panel, plumbing, and water heater last replaced?
- Why hasn't it sold? Are there any deal-killer items the seller is aware of (foundation, flood, title, zoning, code violations)?
- Is there a deadline driving the sale (1031 exchange, divorce, estate, relocation)? That informs how much negotiation room exists.
- Schools are B-rated — typically a magnet for longer-tenancy family renters. What's the average tenant stay here, and is there a school-zone premium baked into asking?
- Crime grade is D in this area — have there been break-ins, vandalism, or insurance claims at this property in the last 3 years? What carrier currently insures it and at what premium?
- The area grade is low — what's the realistic commute time and amenity access for the typical tenant pool here? Any planned neighborhood developments (good or bad) we should know about?
- What's the average days-on-market for RENTAL listings here right now (not sales)? A rising rental-DOM trend means longer vacancies and softer asking-rent achievability than the comps imply.
- What's the recent tenant-quality profile in this submarket — average credit score on applications, eviction rate, late-payment / NSF rate, and stable-employment percentage? A property-management company in the area should have these aggregated.
- How much new for-sale + rental construction is in the pipeline within 1–3 miles? Heavy new supply typically softens prices + rents 12–24 months out; constrained supply supports both.
Investment metrics
- 1% rule
- 5.18% ✓
- Cap rate
- 47.07%
- Cash-on-cash
- 145.62%
- DSCR
- 7.48
- GRM
- 1.6
CMA / ARV
- ARV (median comp)
- $126,795
- List price
- $29,900
- Delta
- -76.42%
- Verdict
- UNDERPRICED
- Comps
- 20 within 1.0 mi
Show comp detail 12 sales within ~0.75 mi
| Address | Dist | Beds/Ba | Sqft | Sold | Price | $/sf | Match |
|---|---|---|---|---|---|---|---|
| 1125 8th Ave S | 0.00mi | 4/1.5 | 1,527 (0%) | 1mo | $20,000 | $13 | 97 |
| 230 Myra Pl | 0.48mi | 3/2.0 (-1) | 1,559 (+2%) | 2mo | $90,000 | $58 | 63 |
| 256 Thorwaldsen Pl | 0.41mi | 3/1.5 (-1) | 1,582 (+4%) | 11mo | $210,000 | $133 | 59 |
| 1324 Caroline Ave | 0.25mi | 3/1.0 (-1) | 1,298 (-15%) | 2mo | $185,000 | $143 | 56 |
| 823 14th Ave S | 0.57mi | 3/2.0 (-1) | 1,456 (-5%) | 3mo | $100,000 | $69 | 54 |
| 1148 Briarcliff Ln | 0.31mi | 3/1.0 (-1) | 1,332 (-13%) | 10mo | $85,000 | $64 | 51 |
| 259 16th Pl | 0.60mi | 3/2.0 (-1) | 1,640 (+7%) | 1mo | $88,000 | $54 | 50 |
| 1510 7th Ave S | 0.51mi | 4/3.5 | 1,664 (+9%) | 2mo | $223,000 | $134 | 49 |
| 2100 Center Ct | 0.60mi | 3/1.0 (-1) | 1,600 (+5%) | 12mo | $112,000 | $70 | 49 |
| 1313 Harrison Dr | 0.62mi | 4/1.5 | 1,392 (-9%) | 7mo | $94,000 | $68 | 48 |
| 704 9th Ave S | 0.59mi | 3/1.0 (-1) | 1,740 (+14%) | 5mo | $37,500 | $22 | 40 |
| 1651 S 7th Ave | 0.71mi | 3/2.5 (-1) | 1,466 (-4%) | 12mo | $195,000 | $133 | 39 |
Match score weights: distance 35% · size 25% · config 20% · recency 20%. Top-matched comps best support the ARV.
Projected returns pro-forma
-3.0% appreciation · 3.0% rent growth · sell at horizon
- IRR
- —
- Equity multiple
- 8.15×
- Total profit
- $59,884
- Equity at exit
- $4,458
- IRR
- —
- Equity multiple
- 17.19×
- Total profit
- $135,560
- Equity at exit
- $2,585
Cash invested: $8,372 (down + closing). Projections, not guarantees.
Landlord ↔ Tenant lean methodology
- Overall (STATE)
- 83 Strongly Landlord-Friendly
- State Iowa
- 83 Strongly Landlord-Friendly · R+6
- County
- — inherits STATE
- City
- — inherits STATE
ZIP-level market 52732
- Home prices YoY
- -34.9%
- Active inventory
- 246
- Price-to-rent
- 1.6×
Monthly cashflow live
- Estimated rent
- $1,548 medium interval (Pro) →
- Mortgage (P&I)
- −$157
- Tax est. 1.5%
- −$37 /mo · $448/yr
- Insurance
- −$12
- HOA
- −$0
- Vacancy / Maint / Mgmt
- −$325
- Net cashflow
- $1,016
Break-even live
UW: 25.0% down · 7.5% · 30yr · 1.5% tax · 5.0% vac · 8.0% maint · 8.0% mgmt
Financing live
Cash to close
- Down payment
- $7,475
- Closing costs
- $897
- Reserves months
- —
- Total cash needed
- —
Loan-product check · same deal, 3 products live
Conventional
25% down · 7.5% · 30yr
- Down + closing
- —
- Monthly P&I
- —
- Monthly cashflow
- —
- DSCR
- —
- Eligible?
- —
Personal DTI + credit; lowest rate.
DSCR
20% down · 8.5% · 30yr
- Down + closing
- —
- Monthly P&I
- —
- Monthly cashflow
- —
- DSCR
- —
- Eligible?
- —
No personal income docs; deal must DSCR.
Hard money
10% down · 12.0% · 12mo
- Down + closing
- —
- Monthly P&I
- —
- Monthly cashflow
- —
- DSCR
- —
- Eligible?
- —
Short-term bridge; refi at stabilization.
Rent comps 4 comps
| Address | Beds | Baths | Sqft | Rent | $/sqft | DOM | Units | Dist |
|---|---|---|---|---|---|---|---|---|
| 1004 S 4th St Clinton, IA | 3.0 | 2.5 | 1467 | $1,700 | $1.16 | 44d | 1 | 1.02mi |
| 1006 S 4th St Clinton, IA | 3.0 | 2.5 | 1467 | $1,700 | $1.16 | 44d | 1 | 1.02mi |
| 1002 S 4th St Clinton, IA | 3.0 | 2.5 | 1467 | $1,750 | $1.19 | 44d | 1 | 1.02mi |
| 1008 S 4th St Clinton, IA | 3.0 | 2.5 | 1467 | $1,750 | $1.19 | 44d | 1 | 1.03mi |
Listing history 10 events
-
2026-05-09status Pending
-
2026-03-04price $29,900
-
2026-01-19status Active
-
2026-01-19price $39,900
-
2026-01-14historical
-
2026-01-08status Active
-
2026-01-06historical
-
2026-01-05historical
-
2025-12-10$49,900 Active
-
2025-12-10Active
ⓘ Source: listings_history table (triggers on properties + properties_extension) + one-shot
backfill from property_details.listing_events for pre-trigger history.
Climate risk First Street
- Flood 1/10 Low FEMA zone X (unshaded) · 0% chance over 30 yrs
- Wildfire 3/10 Moderate
- Heat 3/10 Moderate 7 d/yr ≥103°F today · 16 d/yr by 30 yrs out
- Wind 2/10 Low
- Air quality 3/10 Moderate 2 unhealthy d/yr today · 3 by 30 yrs out
Nearby sold comps map
Loading sold comps map…
Walkable amenities ~0.75 mi
Loading nearby amenities…
Taxation est. · year 1
- Rental income
- $18,571
- − Mortgage interest
- −$1,675
- − Property taxes
- −$448
- − Insurance
- −$150
- − Repairs & maintenance
- −$1,486
- − Management
- −$1,486
- − Depreciation
- −$870
- Taxable income
- $12,457
- Est. tax owed @ 24.0%
- −$2,990
- After-tax cash flow
- $9,202/yr
For passive investors: Depreciation is non-cash, so a rental often shows a tax loss while cash-flowing — sheltering income. Rental losses are passive: they offset passive income freely, and up to $25,000/yr can offset ordinary (W-2) income if you actively participate and your MAGI is under $100k (phasing out to $0 by $150k); unused losses carry forward. On sale, claimed depreciation is recaptured at up to 25%, and gains may owe capital-gains tax (a 1031 exchange can defer both). Figures are a year-1 estimate at your 24.0% rate — not tax advice; consult a CPA.
Schools (NCES district)
- District
- Clinton Community School District
- NCES district ID
- 1907710
- Math proficiency
- 52% ▼ -13.00%
- Reading proficiency
- 56% ▼ -8.00%
- Median HH income
- $40,900
- Composite
- 45.22/100
- National rank
- #2666
- State rank
- #273 of 289 in IA
Livability — Clinton
- Score
- 75/100
- State rank
- #222
- US rank
- #4192
Category grades
Schools grade is shown separately in the Schools card above.
Census & demographics
- Census place
- Clinton, IA
- County
- Clinton County · 25,880 people
- City population
- 25,880
- Metro
- Clinton, IA
- Population (ZIP)
- 25,880
- Household income
- $61,105
- Rent vs Own
- Severe rent burden
- 889.0
Population outlook (Clinton County) Hauer SSP2
- Today (2025)
- 44,817 people
- By 2030
- 43,090 · -3.9%
- By 2040
- 39,513 · -11.8%
- By 2050
- 36,209 · -19.2%
- By 2075
- 31,888 · -28.8%
- By 2100
- 30,382 · -32.2%
Race, ethnicity, and origin ACS 2023
- Neighborhood character
- Predominantly White (86%)
- Race & ethnicity
- White 86% Two or more races 7% Hispanic / Latino 5% Black 4%
- Common ancestry
- Iranian 4% Portuguese 2% Lithuanian 2%
- Foreign-born
- 2% · Canada
- Languages at home
- 97% English-only · Spanish 2% Arabic 1%
Political lean MEDSL · Clinton
- 2024 margin
- R (+18.9) · D 39.8% · R 58.6% · Other 1.6%
- 2008→2024 swing
- -41.9pp toward R · 2008: 23.0pp · 2024: -18.9pp
- All cycles
- 2024: R+18.9 2020: R+10.3 2016: R+5.1 2012: D+22.9 2008: D+23.0
Not yet ingested
- Civics
- —
Market trends
- HPI YoY
- ▼ -83.23%
- Current HPI
- 155.3426
- Rent YoY
- —
- Metro
- Clinton, IA
- State GDP YoY
- ▲ 2.48%
- F500 in state
- 4
Industry mix (Fortune 500 HQ in IA)
| Industry | F500 HQs | Revenue |
|---|---|---|
| Financial Services | 1 | $16B |
|
||
| Retail / Convenience | 1 | $15B |
|
||
Price history
-40.1% since first listed10 events — show timeline
- 2026-05-09 Pending — MRED as Distributed by MLS Grid
- 2026-03-04 Price Changed $29,900 MRED as Distributed by MLS Grid
- 2026-01-19 Relisted — MRED as Distributed by MLS Grid
- 2026-01-19 Price Changed $39,900 MRED as Distributed by MLS Grid
- 2026-01-14 Listing Removed — MRED as Distributed by MLS Grid
- 2026-01-08 Relisted — MRED as Distributed by MLS Grid
- 2026-01-06 Listing Removed — RMLSA as Distributed by MLS Grid
- 2026-01-05 Listing Removed — MRED as Distributed by MLS Grid
- 2025-12-10 Listed — RMLSA as Distributed by MLS Grid
- 2025-12-10 Listed $49,900 MRED as Distributed by MLS Grid
Property tax history
+10.5%/yrLatest (2025): $3,709 · +263.7% YoY. Source: county tax records.
Cash-flow waterfall
monthlySold comps — $/sqft
last 12 mo · ≤1 miLoading sold comps…