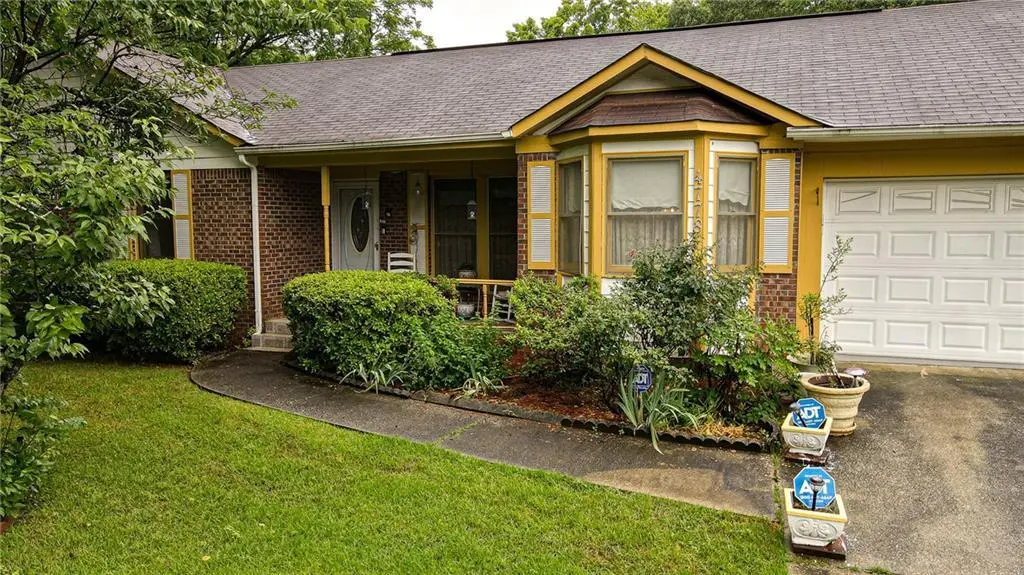
4778 Huntsman Bnd · Stonecrest, GA
Flood risk 1/10 · Minimal
- FEMA flood zone
- X (unshaded)
- Chance of flooding over 30 yrs
- 0.0%
- Est. flood insurance / yr
- $507 – $1,088
Fire risk 1/10 · Minimal
- Est. fire insurance / yr
- $963 – $1,789
Heat risk 5/10 · Moderate
- Hot days now (above 105°F)
- 6 days/yr
- Hot days in 30 yrs
- 15 days/yr
Wind risk 5/10 · Moderate
- Chance of severe wind over 30 yrs
- 24.0%
Air-quality risk 5/10 · Moderate
- Unhealthy air days now
- 7 days/yr
- Unhealthy air days in 30 yrs
- 10 days/yr
Risk factors via First Street. Map © Google.
Why this score? — see what drove the F grade
The composite is a weighted blend of 9 inputs, each scored 0–100. Each bar is that input's sub-score; the figure is the points it added to the 100-point composite (weight × sub-score).
- Cash flow +13.5/30.0
- DSCR +4.1/10.0
- Rent growth +3.0/5.0
- 1% rule +2.5/10.0
- Livability +2.5/5.0
- Condition / age +2.5/5.0
- Schools +2.1/10.0
- ARV discount +0.0/15.0
- Appreciation +0.0/10.0
$279,000
🖨 Deal sheet (PDF) 📄 Offer letter ✓ Due diligence
Listing remarks
Back on market at no fault of the seller! Welcome home to this lovingly maintained gem in Decatur, proudly owned by the original owner since it was built in 1986. Tucked away in a quiet, established neighborhood, this home offers the perfect blend of comfort, space, and convenience. Situated on a gentle upward slope, the property features a flat backyard with plenty of room for entertaining, gardening, or even a future small pool. One of the true highlights of this home is the spacious, fully conditioned sunroom — a bright and versatile space that can be enjoyed year-round for relaxing, entertaining, working from home, or creating your own personal retreat. Conveniently located near s
Key facts
- Flat backyard
- 0.34 acre lot
- 2 garage spots
Tags
Property features AI
Exterior
- Parking: Detached or attached garage with 2 garage spaces; Garage with opener; Garage faces front; Driveway parking; Open parking available
- Utilities: Public water; Public sewer; 220-volt electric; Cable available; Electricity available; Natural gas available; Sewer available; Water available
- Home design: One level; Brick 4 sides construction; Shingle roof; Resale property; Fee simple ownership; Dock: Other
- Construction: Built with brick on all sides; Shingle roof; Shed(s) on property
- Exterior features: Front porch; Rear porch; Enclosed patio/porch; Screened porch; Shed(s); Other exterior features
Interior
- Kitchen: Stone counters; Open view to family room; Dishwasher; Gas range; Microwave; Refrigerator
- Bedrooms: Three main-level bedrooms; Bedroom features: Other
- Flooring: Ceramic tile; Hardwood
- Bathrooms: Two full bathrooms; Master bathroom with double vanity and shower
- Heating & cooling: Central heating (natural gas); Central air; Ceiling fan(s)
- Interior features: Entrance foyer; Masonry fireplace (1); Insulated windows; No common walls; Living room; Sun room
- Laundry & utility: Laundry room; Laundry area in kitchen; Other laundry features
Neighborhood map
What this means for you Summary
Snapshot
- This is a 3-bed/2.0-bath single-family listed at $279k.
Deal economics
- At list price, monthly cash flow is $8 ($95/yr) — positive.
- The deal already cash-flows at list — no discount required.
- To meet the 1% rule (rent ≥ 1% of price), the offer needs to be $209k (25.0% below list).
- Recommended offer: $209k (25.0% below list) — sets the bar for 1% rule.
- Cap rate 6.3% vs local median 5.1% in Stonecrest — meaningfully above typical; check what's discounted (condition, days-on-market, listing class) to confirm the premium yield is real.
Location & tenants
- Location reads: area grade F — affects rentability + tenant quality, not the cash-flow math above.
- Dekalb County (suburban): math 19% / reading 28% proficiency, ranked #125 of 174 in GA (top 72%) — low school quality limits family demand, transient renter base, plan for 1-2y turnover; 68% free/reduced lunch — lower-income household profile, screen leases tightly.
- Zoned schools: Browns Mill Elementary School (math 5% / reading 24%, grade F, #988 of 1,228 statewide, top 81%, 383 students, 100% FRL); Salem Middle School (math 5% / reading 16%, grade F, #429 of 470 statewide, top 91%, 988 students, 100% FRL); Martin Luther King- Jr. High School (math 8% / reading 22%, grade F, #297 of 424 statewide, top 74%, 1,440 students, 100% FRL) — zoned schools average 100% FRL vs 68% district-wide (32 pts higher); higher-poverty schools than district average — tighter screening recommended.
- Market conditions: Rents rising (+2.2%/yr); 356 active listings in the ZIP; 37 comparable units currently listed for rent nearby; rentals at typical pace (median 26d on market — plan ~3-4 weeks tenant-placement turnaround); 46% of comp listings sitting > 30 days — soft ceiling on asking rent; 1,240 units permitted in DeKalb County in 2024 (385 in 5+ unit buildings).
- This rent runs 40% of the median local income ($64k/yr) — at the standard rent-burdened threshold; future hikes will face affordability resistance.
Forward outlook
- Local home prices are declining (-3.0%/yr); year-one equity from $2k of loan paydown is wiped out by about $8k of value loss. Plan a longer hold.
- DeKalb County population projected at +28% by 2050 — long-run rental-demand tailwind backs the buy-and-hold thesis.
Negotiation context
- Only 13 days on market — expect competitive offers; lowballing is unlikely to land.
- Current owner paid $62k; list at $279k implies a 350% gain — meaningful room to come down on a strong offer.
Risks & watch-outs
- Climate carrying-cost: moderate wind risk, 24% chance of damaging wind over 30y; extreme-heat days projected 6→15/yr by 2055 (HVAC capex compounding) — expect insurance premiums to compound above CPI over the hold.
Questions for the listing agent
- Is there a deadline driving the sale (1031 exchange, divorce, estate, relocation)? That informs how much negotiation room exists.
- The area grade is low — what's the realistic commute time and amenity access for the typical tenant pool here? Any planned neighborhood developments (good or bad) we should know about?
- What's the average days-on-market for RENTAL listings here right now (not sales)? A rising rental-DOM trend means longer vacancies and softer asking-rent achievability than the comps imply.
- What's the recent tenant-quality profile in this submarket — average credit score on applications, eviction rate, late-payment / NSF rate, and stable-employment percentage? A property-management company in the area should have these aggregated.
- How much new for-sale + rental construction is in the pipeline within 1–3 miles? Heavy new supply typically softens prices + rents 12–24 months out; constrained supply supports both.
Investment metrics
- 1% rule
- 0.75% ✗
- Cap rate
- 6.33%
- Cash-on-cash
- 0.12%
- DSCR
- 1.01
- GRM
- 11.1
CMA / ARV
- ARV (on-the-fly)
- $233,308
- Comps found
- 6
Show comp detail 6 sales within ~0.75 mi
| Address | Dist | Beds/Ba | Sqft | Sold | Price | $/sf | Match |
|---|---|---|---|---|---|---|---|
| 4817 Huntsman Bnd | 0.11mi | 3/2.0 | 1,643 (+3%) | 14mo | $240,000 | $146 | 78 |
| 4647 Wonder Valley Trl | 0.36mi | 3/2.0 | 1,656 (+4%) | 11mo | $312,000 | $188 | 68 |
| 2963 Thompson Cir | 0.38mi | 4/2.0 (+1) | 1,656 (+4%) | 13mo | $211,000 | $127 | 60 |
| 4515 Wonder Valley Trl | 0.18mi | 3/1.5 | 1,377 (-14%) | 10mo | $197,500 | $143 | 58 |
| 2915 Thompson Cir | 0.30mi | 3/3.0 | 1,824 (+14%) | 21mo | $296,814 | $163 | 41 |
| 3007 Riders Trl | 0.51mi | 3/1.0 | 1,791 (+12%) | 23mo | $215,000 | $120 | 33 |
Match score weights: distance 35% · size 25% · config 20% · recency 20%. Top-matched comps best support the ARV.
Projected returns pro-forma
-3.0% appreciation · 2.18% rent growth · sell at horizon
- IRR
- -17.0%
- Equity multiple
- 0.40×
- Total profit
- $-46,563
- Equity at exit
- $41,600
- IRR
- -10.3%
- Equity multiple
- 0.39×
- Total profit
- $-47,389
- Equity at exit
- $24,123
Cash invested: $78,120 (down + closing). Projections, not guarantees.
Landlord ↔ Tenant lean methodology
- Overall (STATE)
- 90 Strongly Landlord-Friendly
- State Georgia
- 90 Strongly Landlord-Friendly · R+3
- County
- — inherits STATE
- City
- — inherits STATE
ZIP-level market 30034
- Home prices YoY
- -27.4%
- Rents YoY
- 2.2%
- Active inventory
- 356
- Price-to-rent
- 11.1×
Monthly cashflow live
- Estimated rent
- $2,092 high interval (Pro) →
- Mortgage (P&I)
- −$1,463
- Tax from tax record
- −$65 /mo · $783/yr
- Insurance
- −$116
- HOA
- −$0
- Vacancy / Maint / Mgmt
- −$439
- Net cashflow
- $8
Break-even live
Sensitivity live
| Price | -10% $166 | -5% $87 | +0% $8 | +5% $-71 | +10% $-150 |
|---|---|---|---|---|---|
| Rent | -10% $-157 | -5% $-75 | +0% $8 | +5% $91 | +10% $173 |
| Rate | -1.0pp $148 | -0.5pp $79 | base $8 | +0.5pp $-64 | +1.0pp $-138 |
UW: 25.0% down · 7.5% · 30yr · 1.5% tax · 5.0% vac · 8.0% maint · 8.0% mgmt
Financing live
Cash to close
- Down payment
- $69,750
- Closing costs
- $8,370
- Reserves months
- —
- Total cash needed
- —
Loan-product check · same deal, 3 products live
Conventional
25% down · 7.5% · 30yr
- Down + closing
- —
- Monthly P&I
- —
- Monthly cashflow
- —
- DSCR
- —
- Eligible?
- —
Personal DTI + credit; lowest rate.
DSCR
20% down · 8.5% · 30yr
- Down + closing
- —
- Monthly P&I
- —
- Monthly cashflow
- —
- DSCR
- —
- Eligible?
- —
No personal income docs; deal must DSCR.
Hard money
10% down · 12.0% · 12mo
- Down + closing
- —
- Monthly P&I
- —
- Monthly cashflow
- —
- DSCR
- —
- Eligible?
- —
Short-term bridge; refi at stabilization.
Rent comps 37 comps
| Address | Beds | Baths | Sqft | Rent | $/sqft | DOM | Units | Dist |
|---|---|---|---|---|---|---|---|---|
| 2564 Treadway Dr Decatur, GA | 3.0 | 2.0 | 1927 | $2,950 | $1.53 | 45d | 1 | 0.19mi |
| 2937 Thompson Cir Decatur, GA | 3.0 | 2.0 | 1480 | $1,860 | $1.26 | 3d | 1 | 0.34mi |
| 4433 Golf Vista Cir Decatur, GA | 3.0 | 2.5 | 1495 | $1,350 | $0.90 | 26d | 1 | 0.51mi |
| 4336 Pleasant Point Dr Decatur, GA | 1.0–3.0 | 1.0–2.0 | 1010 | $1,233 | $1.22 | 0d | 3 | 0.52mi |
| 2692 Paxton PL #14 Decatur, GA | 3.0 | 2.5 | 1611 | $2,299 | $1.43 | 45d | 1 | 0.59mi |
| 3095 Riders Trl Decatur, GA | 3.0 | 2.0 | 1800 | $4,500 | $2.50 | 1d | 1 | 0.64mi |
| 4292 Callum Ct Decatur, GA | 3.0 | 2.5 | 1611 | $2,200 | $1.37 | 45d | 1 | 0.67mi |
| 2878 Snapfinger Mnr Decatur, GA | 3.0 | 2.5 | 1670 | $1,780 | $1.07 | 4d | 1 | 0.67mi |
| 4282 Callum Ct Decatur, GA | 3.0 | 2.5 | 1611 | $2,200 | $1.37 | 45d | 1 | 0.68mi |
| 4421 Wellington Ter Decatur, GA | 3.0 | 2.5 | 1704 | $1,880 | $1.10 | 0d | 1 | 0.80mi |
| 2559 Walden Lake Dr Unit 1 Decatur, GA | 3.0 | 2.5 | 1464 | $2,000 | $1.37 | 45d | 1 | 0.83mi |
| 2545 Walden Lake Dr Unit 1 Decatur, GA | 3.0 | 2.5 | 1464 | $2,000 | $1.37 | 45d | 1 | 0.86mi |
| 2569 Terrace Trl Decatur, GA | 3.0 | 3.0 | 1752 | $1,800 | $1.03 | 45d | 1 | 0.96mi |
| 2563 Terrace Trl Decatur, GA | 3.0 | 3.0 | 1752 | $1,950 | $1.11 | 14d | 1 | 0.97mi |
| 2525 Terrace Trl Unit 2525 Decatur, GA | 3.0 | 3.0 | 1593 | $1,850 | $1.16 | 14d | 1 | 0.99mi |
| 2553 Terrace Trl Unit 2553 Decatur, GA | 3.0 | 2.0 | 1865 | $1,950 | $1.05 | 14d | 1 | 1.01mi |
| 4936 Longview Run Decatur, GA | 4.0 | 2.5 | 2238 | $2,900 | $1.30 | 45d | 1 | 1.02mi |
| 4908 Longview Walk Decatur, GA | 3.0 | 2.5 | 1480 | $2,000 | $1.35 | 45d | 1 | 1.02mi |
| 4917 Longview Walk Decatur, GA | 3.0 | 2.5 | 1486 | $2,000 | $1.35 | 22d | 1 | 1.03mi |
| 4948 Longview Run Decatur, GA | 3.0 | 2.0 | 1892 | $2,135 | $1.13 | 6d | 1 | 1.04mi |
| 5038 Longview Walk Decatur, GA | 3.0 | 2.5 | 1577 | $1,995 | $1.27 | 45d | 1 | 1.04mi |
| 2481 Terrace Trl Decatur, GA | 3.0 | 3.0 | 1752 | $2,050 | $1.17 | 45d | 1 | 1.06mi |
| 2658 Avanti Way Decatur, GA | 3.0 | 2.5 | 1616 | $2,000 | $1.24 | 45d | 1 | 1.09mi |
| 5108 Jack Dr Decatur, GA | 3.0 | 2.5 | 1872 | $2,185 | $1.17 | 26d | 1 | 1.11mi |
| 4946 Snapfinger Woods Dr Decatur, GA | 1.0–2.0 | 1.0–2.5 | 965 | $1,259 | $1.30 | 3d | 18 | 1.18mi |
| 4707 Riverwood Cir Decatur, GA | 3.0 | 2.0 | 1826 | $1,850 | $1.01 | 26d | 1 | 1.28mi |
| 4225 Wingfoot Ct Decatur, GA | 2.0 | 2.0 | 1120 | $1,600 | $1.43 | 26d | 1 | 1.31mi |
| 4955 Windsor Downs Ln Decatur, GA | 4.0 | 2.0 | 1888 | $2,050 | $1.09 | 6d | 1 | 1.34mi |
| 4909 Truitt Ln Decatur, GA | 3.0 | 2.0 | 1697 | $2,500 | $1.47 | 45d | 1 | 1.35mi |
| 2319 Wingfoot Pl Decatur, GA | 3.0 | 2.5 | 1840 | $1,800 | $0.98 | 45d | 1 | 1.35mi |
| 4926 Windsor Downs Ln Decatur, GA | 4.0 | 3.5 | 1675 | $1,000 | $0.60 | 0d | 1 | 1.36mi |
| 4116 Snapfinger Way Decatur, GA | 4.0 | 2.0 | 1334 | $1,719 | $1.29 | 45d | 1 | 1.37mi |
| 2347 Greenway Dr Decatur, GA | 3.0 | 2.0 | 1200 | $1,975 | $1.65 | 26d | 1 | 1.39mi |
| 4919 Wilkins Station Dr Decatur, GA | 3.0 | 2.0 | 1770 | $2,161 | $1.22 | 22d | 1 | 1.41mi |
| 2450 Northmill Ln Decatur, GA | 4.0 | 2.5 | 2046 | $2,135 | $1.04 | 45d | 1 | 1.42mi |
| 2272 Ramblewood Cir Decatur, GA | 4.0 | 2.5 | 2198 | $2,111 | $0.96 | 6d | 1 | 1.46mi |
| 4505 Dover Castle Dr Decatur, GA | 4.0 | 2.0 | 1532 | $1,923 | $1.26 | 45d | 1 | 1.46mi |
Listing history 9 events
-
2026-06-15days on market $279,000 Active 13 DOM
-
2026-06-13days on market $279,000 Active 11 DOM
-
2026-06-10status $279,000 Active 7 DOM
-
2026-06-02statusdays on market $279,000 Pending 7 DOM
-
2026-06-01days on market $279,000 Active 6 DOM
-
2026-05-31days on market $279,000 Active 5 DOM
-
2026-05-26$279,000 Active
-
1986-07-18soldstatus $62,000
-
1986-01-10soldstatus $45,175
ⓘ Source: listings_history table (triggers on properties + properties_extension) + one-shot
backfill from property_details.listing_events for pre-trigger history.
Tax reassessment forecast GA · Resets to sale price
- Current annual tax
- $783 · $65/mo
- Projected year-2 tax
- $2,567 · $214/mo
- Expected delta
- +$1,784/yr (+$149/mo · 227.9%)
ⓘ Screening estimate from a state-policy table — verify with the county assessor before closing.
Climate risk First Street
- Flood 1/10 Low FEMA zone X (unshaded) · 0% chance over 30 yrs
- Wildfire 1/10 Low
- Heat 5/10 Major 6 d/yr ≥105°F today · 15 d/yr by 30 yrs out
- Wind 5/10 Major 24% chance of damaging wind over 30 yrs
- Air quality 5/10 Major 7 unhealthy d/yr today · 10 by 30 yrs out
Nearby sold comps map
Loading sold comps map…
Walkable amenities ~0.75 mi
Loading nearby amenities…
Taxation est. · year 1
- Rental income
- $25,101
- − Mortgage interest
- −$15,628
- − Property taxes
- −$783
- − Insurance
- −$1,395
- − Repairs & maintenance
- −$2,008
- − Management
- −$2,008
- − Depreciation
- −$8,116
- Taxable loss
- −$4,838
- Est. tax savings @ 24.0%
- +$1,161
- After-tax cash flow
- $1,256/yr
For passive investors: Depreciation is non-cash, so a rental often shows a tax loss while cash-flowing — sheltering income. Rental losses are passive: they offset passive income freely, and up to $25,000/yr can offset ordinary (W-2) income if you actively participate and your MAGI is under $100k (phasing out to $0 by $150k); unused losses carry forward. On sale, claimed depreciation is recaptured at up to 25%, and gains may owe capital-gains tax (a 1031 exchange can defer both). Figures are a year-1 estimate at your 24.0% rate — not tax advice; consult a CPA.
Schools (NCES district)
- District
- Dekalb County
- NCES district ID
- 1301740
- Math proficiency
- 19% ▼ -12.00%
- Reading proficiency
- 28% ▼ -7.00%
- Median HH income
- $51,448
- Composite
- 20.92/100
- National rank
- #8482
- State rank
- #125 of 174 in GA
Livability — Stonecrest
No livability data for this city. (Only ~50 U.S. cities are tracked.)
Census & demographics
- County
- Dekalb County · 782,738 people
- City population
- 106,165
- Metro
- Atlanta-Sandy Springs-Alpharetta, GA
- Population (ZIP)
- 41,847
- Household income
- $63,517
- Rent vs Own
- Severe rent burden
- 1659.0
Population outlook (DeKalb County) Hauer SSP2
- Today (2025)
- 839,977 people
- By 2030
- 891,768 · +6.2%
- By 2040
- 988,894 · +17.7%
- By 2050
- 1,074,583 · +27.9%
- By 2075
- 1,245,026 · +48.2%
- By 2100
- 1,303,135 · +55.1%
Race, ethnicity, and origin ACS 2023
- Neighborhood character
- Predominantly Black (90%)
- Race & ethnicity
- Black 90% White 4% Two or more races 3% Hispanic / Latino 2%
- Common ancestry
- Hispanic 1% Lithuanian 1%
- Foreign-born
- 8% · Canada
- Languages at home
- 93% English-only · Spanish 2% French/Haitian/Cajun 1%
Political lean MEDSL · DeKalb
- 2024 margin
- Solid D (+64.8) · D 81.9% · R 17.1% · Other 1.0%
- 2008→2024 swing
- +6.1pp toward D · 2008: 58.6pp · 2024: 64.8pp
- All cycles
- 2024: D+64.8 2020: D+67.4 2016: D+64.8 2012: D+56.8 2008: D+58.6
Not yet ingested
- Civics
- —
Market trends
- HPI YoY
- ▼ -78.92%
- Current HPI
- 209.5638
- Rent YoY
- ▲ 2.18%
- Metro
- Atlanta-Sandy Springs-Alpharetta, GA
- State GDP YoY
- ▲ 2.66%
- F500 in state
- 28
Industry mix (Fortune 500 HQ in GA)
| Industry | F500 HQs | Revenue |
|---|---|---|
| Paper / Packaging | 2 | $29B |
|
||
| Retail | 1 | $160B |
|
||
| Transportation / Logistics | 1 | $91B |
|
||
| Airlines | 1 | $62B |
|
||
| Consumer Goods | 1 | $47B |
|
||
| Utilities | 1 | $25B |
|
||
Price history
+517.6% since first listed3 events — show timeline
- 2026-05-26 Listed $279,000 FMLS
- 1986-07-18 Sold (Public Records) $62,000 Public Records
- 1986-01-10 Sold (Public Records) $45,175 Public Records
Property tax history
+2.0%/yrLatest (2025): $783 · -6.0% YoY. Source: county tax records.
Cash-flow waterfall
monthlySold comps — $/sqft
last 12 mo · ≤1 miLoading sold comps…