 Fourplex
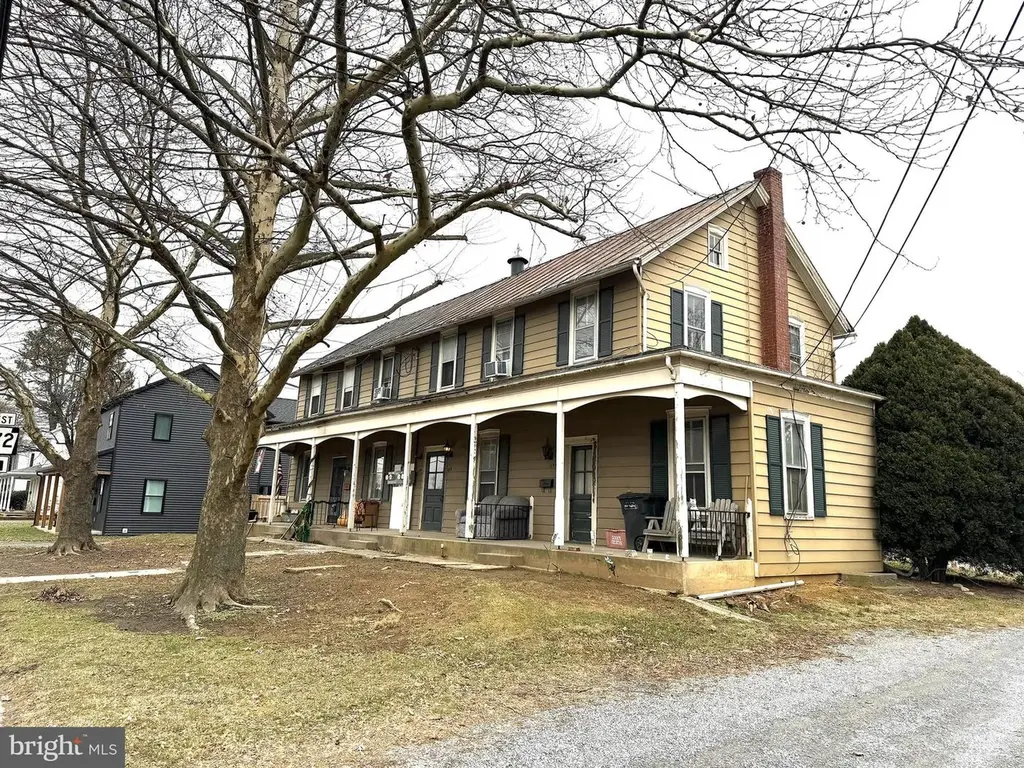
154-158 Main St W · Leola, PA
Flood risk 1/10 · Minimal
- FEMA flood zone
- X (unshaded)
- Chance of flooding over 30 yrs
- 0.0%
- Est. flood insurance / yr
- $507 – $1,088
Fire risk 1/10 · Minimal
- Est. fire insurance / yr
- $511 – $949
Heat risk 5/10 · Moderate
- Hot days now (above 100°F)
- 7 days/yr
- Hot days in 30 yrs
- 15 days/yr
Wind risk 4/10 · Minor
- Chance of severe wind over 30 yrs
- 20.0%
Air-quality risk 4/10 · Minor
- Unhealthy air days now
- 5 days/yr
- Unhealthy air days in 30 yrs
- 7 days/yr
Risk factors via First Street. Map © Google.
Why this score? — see what drove the B+ grade
The composite is a weighted blend of 9 inputs, each scored 0–100. Each bar is that input's sub-score; the figure is the points it added to the 100-point composite (weight × sub-score).
- Cash flow +29.8/30.0
- ARV discount +14.7/15.0
- DSCR +10.0/10.0
- 1% rule +8.0/10.0
- Schools +4.4/10.0
- Livability +3.6/5.0
- Rent growth +2.5/5.0
- Condition / age +2.5/5.0
- Appreciation +0.0/10.0
$495,000
🖨 Deal sheet (PDF) 📄 Offer letter ✓ Due diligence
Multi-family units
County records classify this as Multi-Family (2-4 Unit). Listing-text estimate: 4 units. confirmed
Listing remarks MLS
Investment property that is fully leased and well maintained. It is a purpose built 4 unit dwelling with 2 units on the first floor and 2 units on the second floor. It is located in a nice suburban Leola area.
Key facts
- Fully leased
- 0.42 acre lot
- 12 parking spots
Tags
Property features AI
Finance
- Financial info: All 4 units leased; Total actual rent reported: $44,420
Exterior
- Parking: 12 off-street parking spaces (total 12 garage/parking spaces)
- Utilities: Natural gas hot water; Natural gas heating fuel; Public water; Public sewer
- Home design: Detached building; Fee simple ownership; Year built (estimated)
- Construction: Frame construction with metal siding; Other foundation
- Exterior features: No tidal water; Above-grade additional structures
Interior
- Bedrooms: Four 2-bedroom units (total of 4 units)
- Heating & cooling: Radiator heating; Window air conditioning units (electric)
- Interior features: Estimated living area
Neighborhood map
What this means for you Summary
Snapshot
- This is a 4 × 2-bed/1-bath units multifamily listed at $495k.
Deal economics
- At list price, monthly cash flow is $2k ($22k/yr) — positive. Per door: $454/mo.
- The deal already cash-flows at list — no discount required.
- Meets the 1% rule at list price ($6k rent vs $495k).
- Recommended offer: $488k (1.5% below list) — sets the bar for market timing.
Location & tenants
- Location reads 72/100 on livability (#646 in PA) — a middle-class / working-renter tenant base. Strengths: housing A+, health & safety A, crime A-; Watch: schools D, amenities F, commute F.
- Conestoga Valley SD (suburban): math 43% / reading 59% proficiency, ranked #156 of 539 in PA (top 29%) — acceptable for families but not a draw, mixed tenant base, ~2y average lease.
- Market conditions: 26 active listings in the ZIP; solid renter incomes; 1,093 units permitted in Lancaster County in 2024 (201 in 5+ unit buildings).
- At $6,440/mo this rent would consume 84% of the median local household income ($92k/yr) (locally 159% of renters already pay >50% of income on rent) — very limited rent-growth headroom before tenants either downsize or default.
Forward outlook
- Local home prices are declining (-3.0%/yr); year-one equity from $3k of loan paydown is wiped out by about $15k of value loss. Plan a longer hold.
- Lancaster County population projected at +5% by 2050 — modest demand growth; plan on rents tracking national, not racing it.
- At projected returns (-3.0% appreciation + 3.0% rent growth), your $139k cash investment doubles in ~8 years — after that, you're playing with house money.
Negotiation context
- It's been on market 28 days — a 2% lower offer ($488k) is reasonable based on typical stale-listing flexibility.
- 5 sale attempts since 25y ago with the ask held roughly flat each time — persistent listings suggest the price (not the market) is what's stuck; bring a comps-based counter.
- Current owner paid $255k; list at $495k implies a 94% gain — meaningful room to come down on a strong offer.
Risks & watch-outs
- Watch-outs: built in 1920 — expect roof / HVAC / electrical / plumbing capex.
- Climate carrying-cost: extreme-heat days projected 7→15/yr by 2055 (HVAC capex compounding) — expect insurance premiums to compound above CPI over the hold.
Questions for the listing agent
- Can we see the unit-by-unit rent roll, current vacancy, and any below-market leases? What's the average tenancy length?
- What capital expenditures (roof, boiler, parking lot, exteriors) have been made in the last 5 years, and what's planned in the next 2?
- Built in 1920 — when were the roof, HVAC, electrical panel, plumbing, and water heater last replaced?
- Is there a deadline driving the sale (1031 exchange, divorce, estate, relocation)? That informs how much negotiation room exists.
- Schools are D-rated, which usually means shorter tenancies and higher turnover. Who's the typical renter profile here, and what's been the actual vacancy rate?
- What's the average days-on-market for RENTAL listings here right now (not sales)? A rising rental-DOM trend means longer vacancies and softer asking-rent achievability than the comps imply.
- What's the recent tenant-quality profile in this submarket — average credit score on applications, eviction rate, late-payment / NSF rate, and stable-employment percentage? A property-management company in the area should have these aggregated.
- How much new apartment / multifamily construction is in the pipeline within 1–3 miles? Heavy new supply (>2% of stock underway) typically softens rents 12–24 months out; light construction supports rent growth.
Investment metrics
- 1% rule
- 1.30% ✓
- Cap rate
- 10.70%
- Cash-on-cash
- 15.73%
- DSCR
- 1.70
- GRM
- 6.4
CMA / ARV
- ARV (median comp)
- $589,274
- List price
- $495,000
- Delta
- -16.00%
- Verdict
- UNDERPRICED
- Comps
- 2 within 2.0 mi
Projected returns pro-forma
-3.0% appreciation · 3.0% rent growth · sell at horizon
- IRR
- 6.6%
- Equity multiple
- 1.26×
- Total profit
- $35,538
- Equity at exit
- $73,806
- IRR
- 15.9%
- Equity multiple
- 2.30×
- Total profit
- $180,004
- Equity at exit
- $42,799
Cash invested: $138,600 (down + closing). Projections, not guarantees.
Landlord ↔ Tenant lean methodology
- Overall (STATE)
- 62 Landlord-Friendly
- State Pennsylvania
- 62 Landlord-Friendly · EVEN
- County
- — inherits STATE
- City
- — inherits STATE
ZIP-level market 17540
- Home prices YoY
- -27.3%
- Active inventory
- 26
- Price-to-rent
- 25.6×
Monthly cashflow live
- Estimated rent
- $6,440 medium interval (Pro) →
- Mortgage (P&I)
- −$2,596
- Tax from tax record
- −$468 /mo · $5,619/yr
- Insurance
- −$206
- HOA
- −$0
- Vacancy / Maint / Mgmt
- −$1,352
- Net cashflow
- $1,817
Break-even live
Sensitivity live
| Price | -10% $2,097 | -5% $1,957 | +0% $1,817 | +5% $1,677 | +10% $1,537 |
|---|---|---|---|---|---|
| Rent | -10% $1,309 | -5% $1,563 | +0% $1,817 | +5% $2,072 | +10% $2,326 |
| Rate | -1.0pp $2,067 | -0.5pp $1,943 | base $1,817 | +0.5pp $1,689 | +1.0pp $1,559 |
4-unit breakdown (identical units grouped — click to expand)
| Units | Beds | Baths | Est. rent |
|---|---|---|---|
| 4× units | 2 | 1 | $6,440 |
| #1 | 2 | 1 | $1,610 |
| #2 | 2 | 1 | $1,610 |
| #3 | 2 | 1 | $1,610 |
| #4 | 2 | 1 | $1,610 |
| Total (4 units) | $6,440 | ||
UW: 25.0% down · 7.5% · 30yr · 1.5% tax · 5.0% vac · 8.0% maint · 8.0% mgmt
Financing live
Cash to close
- Down payment
- $123,750
- Closing costs
- $14,850
- Reserves months
- —
- Total cash needed
- —
Loan-product check · same deal, 3 products live
Conventional
25% down · 7.5% · 30yr
- Down + closing
- —
- Monthly P&I
- —
- Monthly cashflow
- —
- DSCR
- —
- Eligible?
- —
Personal DTI + credit; lowest rate.
DSCR
20% down · 8.5% · 30yr
- Down + closing
- —
- Monthly P&I
- —
- Monthly cashflow
- —
- DSCR
- —
- Eligible?
- —
No personal income docs; deal must DSCR.
Hard money
10% down · 12.0% · 12mo
- Down + closing
- —
- Monthly P&I
- —
- Monthly cashflow
- —
- DSCR
- —
- Eligible?
- —
Short-term bridge; refi at stabilization.
Listing history 23 events
-
2026-06-09status $495,000 Pending 28 DOM
-
2026-06-08days on market $495,000 Active 28 DOM
-
2026-06-07days on market $495,000 Active 27 DOM
-
2026-06-05days on market $495,000 Active 24 DOM
-
2026-06-03days on market $495,000 Active 23 DOM
-
2026-06-02days on market $495,000 Active 22 DOM
-
2026-06-01days on market $495,000 Active 21 DOM
-
2026-05-31days on market $495,000 Active 20 DOM
-
2026-05-30days on market $495,000 Active 19 DOM
-
2026-05-11$495,000 Active 912-char remark
-
2017-04-30historical
-
2016-05-17$425,000
-
2010-01-19soldstatus $255,000
-
2010-01-15soldstatus $255,000
Show marketing remark (209 chars)
Investment property that is fully leased and well maintained. It is a purpose built 4 unit dwelling with 2 units on the first floor and 2 units on the second floor. It is located in a nice suburban Leola area.
-
2009-05-07$309,950
Show marketing remark (209 chars)
Investment property that is fully leased and well maintained. It is a purpose built 4 unit dwelling with 2 units on the first floor and 2 units on the second floor. It is located in a nice suburban Leola area.
-
2004-03-03soldstatus $200,000
-
2004-03-01soldstatus $200,000
-
2004-01-13historical
-
2003-12-22$215,000
-
2001-12-31soldstatus $175,500
-
2001-12-28soldstatus $175,500
-
2001-11-15historical
-
2001-10-02$168,000
ⓘ Source: listings_history table (triggers on properties + properties_extension) + one-shot
backfill from property_details.listing_events for pre-trigger history.
Tax reassessment forecast PA · Partial reset (capped growth)
- Current annual tax
- $5,619 · $468/mo
- Projected year-2 tax
- $6,720 · $560/mo
- Expected delta
- +$1,101/yr (+$92/mo · 19.6%)
ⓘ Screening estimate from a state-policy table — verify with the county assessor before closing.
Climate risk First Street
- Flood 1/10 Low FEMA zone X (unshaded) · 0% chance over 30 yrs
- Wildfire 1/10 Low
- Heat 5/10 Major 7 d/yr ≥100°F today · 15 d/yr by 30 yrs out
- Wind 4/10 Moderate 20% chance of damaging wind over 30 yrs
- Air quality 4/10 Moderate 5 unhealthy d/yr today · 7 by 30 yrs out
Nearby sold comps map
Loading sold comps map…
Walkable amenities ~0.75 mi
Loading nearby amenities…
Taxation est. · year 1
- Rental income
- $77,280
- − Mortgage interest
- −$27,728
- − Property taxes
- −$5,619
- − Insurance
- −$2,475
- − Repairs & maintenance
- −$6,182
- − Management
- −$6,182
- − Depreciation
- −$14,400
- Taxable income
- $14,694
- Est. tax owed @ 24.0%
- −$3,527
- After-tax cash flow
- $18,281/yr
For passive investors: Depreciation is non-cash, so a rental often shows a tax loss while cash-flowing — sheltering income. Rental losses are passive: they offset passive income freely, and up to $25,000/yr can offset ordinary (W-2) income if you actively participate and your MAGI is under $100k (phasing out to $0 by $150k); unused losses carry forward. On sale, claimed depreciation is recaptured at up to 25%, and gains may owe capital-gains tax (a 1031 exchange can defer both). Figures are a year-1 estimate at your 24.0% rate — not tax advice; consult a CPA.
Schools (NCES district)
- District
- Conestoga Valley SD
- NCES district ID
- 4206480
- Math proficiency
- 43% ▼ -8.00%
- Reading proficiency
- 59% ▼ -11.00%
- Median HH income
- $56,234
- Composite
- 44.15/100
- National rank
- #2861
- State rank
- #156 of 539 in PA
Livability — Leola
- Score
- 72/100
- State rank
- #646
- US rank
- #6281
Category grades
Schools grade is shown separately in the Schools card above.
Census & demographics
- Census place
- Leola, PA
- County
- Lancaster County · 390,309 people
- City population
- 10,728
- Metro
- Lancaster, PA
- Population (ZIP)
- 10,728
- Household income
- $91,895
- Rent vs Own
- Severe rent burden
- 159.0
Population outlook (Lancaster County) Hauer SSP2
- Today (2025)
- 561,011 people
- By 2030
- 570,969 · +1.8%
- By 2040
- 585,929 · +4.4%
- By 2050
- 591,056 · +5.4%
- By 2075
- 594,747 · +6.0%
- By 2100
- 558,850 · -0.4%
Race, ethnicity, and origin ACS 2023
- Neighborhood character
- Predominantly White (78%)
- Race & ethnicity
- White 78% Hispanic / Latino 10% Two or more races 8% Asian 5% Black 3%
- Hispanic origin (detail)
- Puerto Rican 8%
- Common ancestry
- Scandinavian 3% Italian 3% Romanian 2%
- Foreign-born
- 6% · Canada, Vietnam
- Languages at home
- 79% English-only · German/W. Germanic 10% Spanish 5% Other Asian/Pacific 2%
Political lean MEDSL · Lancaster
- 2024 margin
- R (+15.9) · D 41.5% · R 57.5%
- 2008→2024 swing
- -4.1pp toward R · 2008: -11.8pp · 2024: -15.9pp
- All cycles
- 2024: R+15.9 2020: R+15.8 2016: R+19.7 2012: R+19.2 2008: R+11.8
Not yet ingested
- Civics
- —
Market trends
- HPI YoY
- ▼ -97.94%
- Current HPI
- 260.303
- Rent YoY
- —
- Metro
- Lancaster, PA
- State GDP YoY
- ▲ 1.68%
- F500 in state
- 34
Industry mix (Fortune 500 HQ in PA)
| Industry | F500 HQs | Revenue |
|---|---|---|
| Healthcare | 2 | $309B |
|
||
| Insurance | 2 | $27B |
|
||
| Telecommunications / Media | 1 | $124B |
|
||
| Industrial Distribution | 1 | $22B |
|
||
| Financial Services | 1 | $20B |
|
||
| Chemicals / Materials | 1 | $18B |
|
||
Price history
+194.6% since first listed15 events — show timeline
- 2026-06-08 Pending — BRIGHT MLS
- 2026-05-11 Listed $495,000 BRIGHT MLS
- 2017-04-30 Listing Removed — BRIGHT MLS
- 2016-05-17 Listed $425,000 BRIGHT MLS
- 2010-01-19 Sold (Public Records) $255,000 Public Records
- 2010-01-15 Sold (MLS) $255,000 BRIGHT MLS
- 2009-05-07 Listed $309,950 BRIGHT MLS
- 2004-03-03 Sold (Public Records) $200,000 Public Records
- 2004-03-01 Sold (MLS) $200,000 BRIGHT MLS
- 2004-01-13 Listing Removed — BRIGHT MLS
- 2003-12-22 Listed $215,000 BRIGHT MLS
- 2001-12-31 Sold (Public Records) $175,500 Public Records
- 2001-12-28 Sold (MLS) $175,500 BRIGHT MLS
- 2001-11-15 Listing Removed — BRIGHT MLS
- 2001-10-02 Listed $168,000 BRIGHT MLS
Property tax history
+3.7%/yrLatest (2026): $5,619 · +5.0% YoY. Source: county tax records.
Cash-flow waterfall
monthlySold comps — $/sqft
last 12 mo · ≤1 miLoading sold comps…