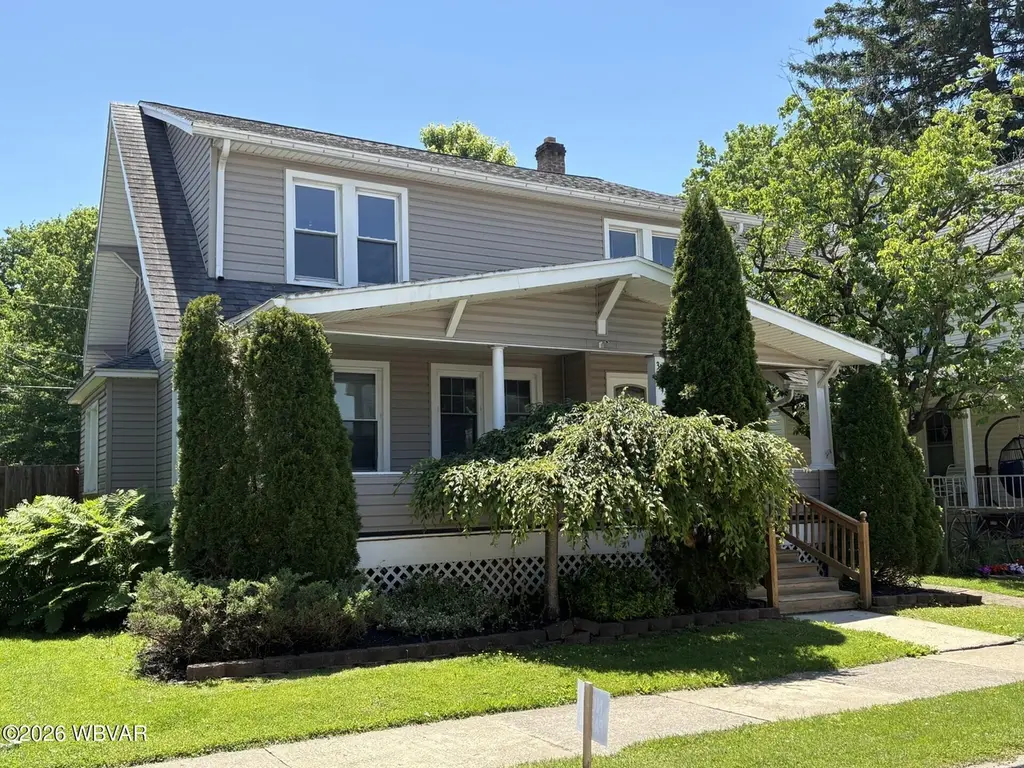
309 W Central Ave · South Williamsport, PA
Flood risk 1/10 · Minimal
- FEMA flood zone
- X (unshaded)
- Chance of flooding over 30 yrs
- 0.0%
- Est. flood insurance / yr
- $473 – $860
Fire risk 3/10 · Minor
- Est. fire insurance / yr
- $511 – $949
Heat risk 4/10 · Minor
- Hot days now (above 93°F)
- 7 days/yr
- Hot days in 30 yrs
- 16 days/yr
Wind risk 2/10 · Minimal
- Chance of severe wind over 30 yrs
- 1.0%
Air-quality risk 2/10 · Minimal
- Unhealthy air days now
- 0 days/yr
- Unhealthy air days in 30 yrs
- 1 days/yr
Risk factors via First Street. Map © Google.
Why this score? — see what drove the C grade
The composite is a weighted blend of 9 inputs, each scored 0–100. Each bar is that input's sub-score; the figure is the points it added to the 100-point composite (weight × sub-score).
- Cash flow +20.6/30.0
- ARV discount +12.7/15.0
- DSCR +6.5/10.0
- 1% rule +4.8/10.0
- Livability +4.3/5.0
- Schools +3.5/10.0
- Rent growth +2.5/5.0
- Condition / age +2.5/5.0
- Appreciation +0.0/10.0
$199,900
🖨 Deal sheet 📄 Offer letter ✓ Due diligence
Listing remarks
Nice, spacious 2 Story Home offering Three Bedrooms, 1.5 Baths, Large Living Room and Spacious Separate Formal Dining Room. It also features a Covered Front Porch, Partially Covered Rear Deck, One Car Garage with enclosed Bonus Room, and Off Street Parking!! It is situated on a level lot with fenced in yard and Fire Pit and is within walking distance of schools! You'll enjoy a front row seat at the yearly Mummers Parade!! Call or email for your private showing. Don't miss this opportunity!!
Key facts
- Covered front porch
- Off street parking
- Enclosed bonus room
Tags
Property features AI
Exterior
- Parking: Off-street parking; Alley access
- Utilities: Public water; Electric with circuit breakers
- Home design: Residential property; Single building (details on stories/entry level not specified); Zoning: R2
- Construction: Frame construction; Vinyl siding; Shingle roof; Block foundation; Built area above grade: 1,660
- Exterior features: Deck; Porch; Level lot
Interior
- Kitchen: Dishwasher; Range; Range hood; Refrigerator
- Bedrooms: 6 total rooms (bedroom count not specified)
- Flooring: Laminate; Tile; Vinyl; Carpet
- Bathrooms: 1 full bathroom; 1 half bathroom
- Heating & cooling: Electric heating; Natural gas heating; Baseboard heating; Ceiling fan(s); No central air
- Interior features: Ceiling fan(s); Full basement with walk-up access
- Laundry & utility: Washer included; Laundry on upper level
Neighborhood map
What this means for you Summary
Snapshot
- This is a 3-bed/1.0-bath single-family listed at $200k.
Deal economics
- At list price, monthly cash flow is $266 ($3k/yr) — positive.
- The deal already cash-flows at list — no discount required.
- To meet the 1% rule (rent ≥ 1% of price), the offer needs to be $196k (1.7% below list).
- Recommended offer: $196k (1.7% below list) — sets the bar for 1% rule.
- Cap rate 7.9% vs local median 4.8% in South Williamsport — top-decile yield for the area; either an underpriced asset or a hidden risk that comps aren't pricing in. Stress-test before assuming the spread holds.
Location & tenants
- Location reads 86/100 on livability (#58 in PA, #400 nationally) — a professional / high-income tenant draw. Strengths: crime A+, commute A+, cost of living A+; Watch: amenities F.
- South Williamsport Area SD (suburban): math 29% / reading 52% proficiency, ranked #350 of 539 in PA (top 65%) — families likely to look elsewhere, expect single-tenant / working-renter base with shorter leases.
- Market conditions: 35 active listings in the ZIP; 3 comparable units currently listed for rent nearby; rentals lingering (median 44d on market — plan ~5-8 weeks vacancy on turnover, expect pricing pressure); 67% of comp listings sitting > 30 days — soft ceiling on asking rent; 73 units permitted in Lycoming County in 2024 (15 in 5+ unit buildings).
Forward outlook
- Local home prices are declining (-3.0%/yr); year-one equity from $1k of loan paydown is wiped out by about $6k of value loss. Plan a longer hold.
- Lycoming County population projected to shrink 10% by 2050 — rents likely to lag national; underwrite the cash flow, not the appreciation.
Negotiation context
- Only 6 days on market — expect competitive offers; lowballing is unlikely to land.
- Current owner paid $115k; list at $200k implies a 74% gain — meaningful room to come down on a strong offer.
Risks & watch-outs
- Watch-outs: built in 1916 — expect roof / HVAC / electrical / plumbing capex.
Questions for the listing agent
- Built in 1916 — when were the roof, HVAC, electrical panel, plumbing, and water heater last replaced?
- Is there a deadline driving the sale (1031 exchange, divorce, estate, relocation)? That informs how much negotiation room exists.
- Schools are B-rated — typically a magnet for longer-tenancy family renters. What's the average tenant stay here, and is there a school-zone premium baked into asking?
- What's the average days-on-market for RENTAL listings here right now (not sales)? A rising rental-DOM trend means longer vacancies and softer asking-rent achievability than the comps imply.
- What's the recent tenant-quality profile in this submarket — average credit score on applications, eviction rate, late-payment / NSF rate, and stable-employment percentage? A property-management company in the area should have these aggregated.
- How much new for-sale + rental construction is in the pipeline within 1–3 miles? Heavy new supply typically softens prices + rents 12–24 months out; constrained supply supports both.
Investment metrics
- 1% rule
- 0.98% ✗
- Cap rate
- 7.89%
- Cash-on-cash
- 5.70%
- DSCR
- 1.25
- GRM
- 8.5
CMA / ARV
- ARV (on-the-fly)
- $226,192
- Comps found
- 12
Show comp detail 12 sales within ~0.75 mi
| Address | Dist | Beds/Ba | Sqft | Sold | Price | $/sf | Match |
|---|---|---|---|---|---|---|---|
| 204 W Central Ave | 0.07mi | 3/1.5 | 1,697 (+0%) | 5mo | $185,000 | $109 | 90 |
| 231 Curtin St | 0.19mi | 3/1.0 | 1,468 (-13%) | 4mo | $169,900 | $116 | 66 |
| 352 Bayard St | 0.24mi | 3/2.0 | 1,824 (+8%) | 10mo | $255,000 | $140 | 63 |
| 377 Main St | 0.35mi | 3/2.0 | 1,510 (-10%) | 9mo | $220,000 | $146 | 55 |
| 492 Winthrop St | 0.31mi | 3/1.5 | 1,508 (-11%) | 15mo | $239,000 | $158 | 54 |
| 695 W Mountain Ave | 0.28mi | 4/2.5 (+1) | 1,844 (+9%) | 10mo | $227,000 | $123 | 52 |
| 513 Fairmont Ave | 0.61mi | 3/2.0 | 1,540 (-9%) | 3mo | $265,000 | $172 | 51 |
| 337 Winthrop St | 0.28mi | 3/2.0 | 1,500 (-11%) | 17mo | $140,000 | $93 | 50 |
| 1115 W Front St | 0.56mi | 3/2.0 | 1,530 (-9%) | 7mo | $225,000 | $147 | 48 |
| 349 Bastian Ave | 0.60mi | 3/1.0 | 1,475 (-13%) | 5mo | $197,000 | $134 | 47 |
| 834 Main St | 0.53mi | 3/1.0 | 1,504 (-11%) | 19mo | $121,617 | $81 | 42 |
| 504 Reynolds St | 0.65mi | 4/1.5 (+1) | 1,792 (+6%) | 18mo | $215,000 | $120 | 38 |
Match score weights: distance 35% · size 25% · config 20% · recency 20%. Top-matched comps best support the ARV.
Projected returns pro-forma
-3.0% appreciation · 3.0% rent growth · sell at horizon
- IRR
- -7.5%
- Equity multiple
- 0.72×
- Total profit
- $-15,496
- Equity at exit
- $29,806
- IRR
- 2.1%
- Equity multiple
- 1.15×
- Total profit
- $8,182
- Equity at exit
- $17,284
Cash invested: $55,972 (down + closing). Projections, not guarantees.
Landlord ↔ Tenant lean methodology
- Overall (STATE)
- 62 Landlord-Friendly
- State Pennsylvania
- 62 Landlord-Friendly · EVEN
- County
- — inherits STATE
- City
- — inherits STATE
ZIP-level market 17702
- Active inventory
- 35
- Price-to-rent
- 8.5×
Monthly cashflow live
- Estimated rent
- $1,964 medium interval (Pro) →
- Mortgage (P&I)
- −$1,048
- Tax from tax record
- −$155 /mo · $1,855/yr
- Insurance
- −$83
- HOA
- −$0
- Vacancy / Maint / Mgmt
- −$413
- Net cashflow
- $266
Break-even live
UW: 25.0% down · 7.5% · 30yr · 1.5% tax · 5.0% vac · 8.0% maint · 8.0% mgmt
Financing live
Cash to close
- Down payment
- $49,975
- Closing costs
- $5,997
- Reserves months
- —
- Total cash needed
- —
Loan-product check · same deal, 3 products live
Conventional
25% down · 7.5% · 30yr
- Down + closing
- —
- Monthly P&I
- —
- Monthly cashflow
- —
- DSCR
- —
- Eligible?
- —
Personal DTI + credit; lowest rate.
DSCR
20% down · 8.5% · 30yr
- Down + closing
- —
- Monthly P&I
- —
- Monthly cashflow
- —
- DSCR
- —
- Eligible?
- —
No personal income docs; deal must DSCR.
Hard money
10% down · 12.0% · 12mo
- Down + closing
- —
- Monthly P&I
- —
- Monthly cashflow
- —
- DSCR
- —
- Eligible?
- —
Short-term bridge; refi at stabilization.
Rent comps 3 comps
| Address | Beds | Baths | Sqft | Rent | $/sqft | DOM | Units | Dist |
|---|---|---|---|---|---|---|---|---|
| 948 Main St South Williamsport, PA | 1.0–3.0 | 1.0–2.0 | 894 | $1,780 | $1.99 | 14d | 4 | 0.67mi |
| 215 E 3rd St Unit 3D Williamsport, PA | 2.0 | 1.0 | 1300 | $2,500 | $1.92 | 43d | 1 | 0.89mi |
| 770 W 4th St Williamsport, PA | 1.0–2.0 | 1.0 | 814 | $1,155 | $1.42 | 43d | 1 | 1.24mi |
Listing history 6 events
-
2026-06-12status $199,900 Pending 6 DOM
-
2026-06-09days on market $199,900 Active 6 DOM
-
2026-06-08days on market $199,900 Active 5 DOM
-
2026-06-07days on market $199,900 Active 4 DOM
-
2026-06-03remarks 496-char remark
-
2026-06-03$199,900 Active 1 DOM
ⓘ Source: listings_history table (triggers on properties + properties_extension) + one-shot
backfill from property_details.listing_events for pre-trigger history.
Tax reassessment forecast PA · Partial reset (capped growth)
- Current annual tax
- $1,855 · $155/mo
- Projected year-2 tax
- $2,507 · $209/mo
- Expected delta
- +$652/yr (+$54/mo · 35.1%)
ⓘ Screening estimate from a state-policy table — verify with the county assessor before closing.
Climate risk First Street
- Flood 1/10 Low FEMA zone X (unshaded) · 0% chance over 30 yrs
- Wildfire 3/10 Moderate
- Heat 4/10 Moderate 7 d/yr ≥93°F today · 16 d/yr by 30 yrs out
- Wind 2/10 Low 100% chance of damaging wind over 30 yrs
- Air quality 2/10 Low 0 unhealthy d/yr today · 1 by 30 yrs out
Nearby sold comps map
Loading sold comps map…
Walkable amenities ~0.75 mi
Loading nearby amenities…
Taxation est. · year 1
- Rental income
- $23,574
- − Mortgage interest
- −$11,198
- − Property taxes
- −$1,855
- − Insurance
- −$1,000
- − Repairs & maintenance
- −$1,886
- − Management
- −$1,886
- − Depreciation
- −$5,815
- Taxable loss
- −$66
- Est. tax savings @ 24.0%
- +$16
- After-tax cash flow
- $3,205/yr
For passive investors: Depreciation is non-cash, so a rental often shows a tax loss while cash-flowing — sheltering income. Rental losses are passive: they offset passive income freely, and up to $25,000/yr can offset ordinary (W-2) income if you actively participate and your MAGI is under $100k (phasing out to $0 by $150k); unused losses carry forward. On sale, claimed depreciation is recaptured at up to 25%, and gains may owe capital-gains tax (a 1031 exchange can defer both). Figures are a year-1 estimate at your 24.0% rate — not tax advice; consult a CPA.
Schools (NCES district)
- District
- South Williamsport Area SD
- NCES district ID
- 4222140
- Math proficiency
- 29% ▼ -13.00%
- Reading proficiency
- 52% ▼ -12.00%
- Median HH income
- $46,740
- Composite
- 34.5/100
- National rank
- #5181
- State rank
- #350 of 539 in PA
Livability — South Williamsport
- Score
- 86/100
- State rank
- #58
- US rank
- #400
Category grades
Schools grade is shown separately in the Schools card above.
Census & demographics
- Census place
- South Williamsport, PA
- Population (ZIP)
- 10,506
Population outlook (Lycoming County) Hauer SSP2
- Today (2025)
- 114,164 people
- By 2030
- 112,221 · -1.7%
- By 2040
- 107,613 · -5.7%
- By 2050
- 102,950 · -9.8%
- By 2075
- 92,987 · -18.5%
- By 2100
- 80,924 · -29.1%
Race, ethnicity, and origin ACS 2023
- Neighborhood character
- Predominantly White (94%)
- Race & ethnicity
- White 94% Two or more races 3% Asian 1% Hispanic / Latino 1% Black 1%
- Common ancestry
- Romanian 4% Lithuanian 3% Iranian 2%
- Foreign-born
- 2% · Canada
- Languages at home
- 98% English-only · German/W. Germanic 1%
Political lean MEDSL · Lycoming
- 2024 margin
- Solid R (+41.5) · D 28.8% · R 70.3%
- 2008→2024 swing
- -17.3pp toward R · 2008: -24.2pp · 2024: -41.5pp
- All cycles
- 2024: R+41.5 2020: R+41.3 2016: R+44.8 2012: R+33.3 2008: R+24.2
Not yet ingested
- Civics
- —
Market trends
- HPI YoY
- ▼ -123.59%
- Current HPI
- 216.0615
- Rent YoY
- —
- Metro
- —
- State GDP YoY
- ▲ 1.68%
- F500 in state
- 34
Industry mix (Fortune 500 HQ in PA)
| Industry | F500 HQs | Revenue |
|---|---|---|
| Healthcare | 2 | $309B |
|
||
| Insurance | 2 | $27B |
|
||
| Telecommunications / Media | 1 | $124B |
|
||
| Industrial Distribution | 1 | $22B |
|
||
| Financial Services | 1 | $20B |
|
||
| Chemicals / Materials | 1 | $18B |
|
||
Price history
+399.8% since first listed3 events — show timeline
- 2026-05-31 Listed $199,900 WBVAR
- 2013-11-05 Sold (Public Records) $115,000 Public Records
- 2003-08-20 Sold (Public Records) $40,000 Public Records
Property tax history
+2.5%/yrLatest (2026): $1,855 · +2.4% YoY. Source: county tax records.
Cash-flow waterfall
monthlySold comps — $/sqft
last 12 mo · ≤1 miLoading sold comps…