 Duplex
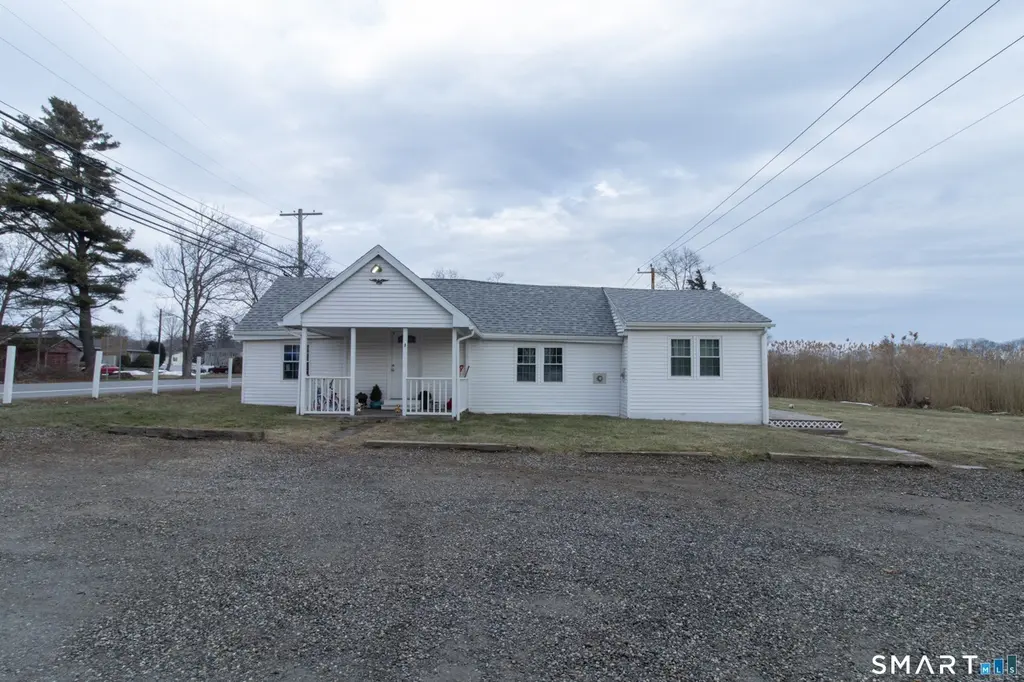
296 E Main St · Clinton, CT
Flood risk 10/10 · Severe
- FEMA flood zone
- AE
- Chance of flooding over 30 yrs
- 0.99%
- Est. flood insurance / yr
- $1,737 – $8,500
Fire risk 1/10 · Minimal
- Est. fire insurance / yr
- $829 – $1,539
Heat risk 6/10 · Moderate
- Hot days now (above 92°F)
- 7 days/yr
- Hot days in 30 yrs
- 18 days/yr
Wind risk 8/10 · Major
- Chance of severe wind over 30 yrs
- 80.0%
Air-quality risk 4/10 · Minor
- Unhealthy air days now
- 4 days/yr
- Unhealthy air days in 30 yrs
- 6 days/yr
Risk factors via First Street. Map © Google.
Why this score? — see what drove the C+ grade
The composite is a weighted blend of 9 inputs, each scored 0–100. Each bar is that input's sub-score; the figure is the points it added to the 100-point composite (weight × sub-score).
- Cash flow +20.9/30.0
- ARV discount +15.0/15.0
- DSCR +6.6/10.0
- 1% rule +4.6/10.0
- Schools +4.6/10.0
- Livability +3.9/5.0
- Rent growth +2.5/5.0
- Condition / age +2.5/5.0
- Appreciation +0.0/10.0
$539,900
🖨 Deal sheet (PDF) 📄 Offer letter ✓ Due diligence
Multi-family units
County records classify this as Multi-Family (2-4 Unit). Listing-text estimate: 2 units. confirmed
Listing remarks MLS
Downtown Two-Family Investment Opportunity! Well-located two-family home close to everything - including shops, restaurants, and nearby beaches. Major updates have already been completed, including the roof, windows, mechanical systems, kitchens, and baths, making this a strong turnkey investment. Enjoy marsh views from the backyard, offering a scenic and relaxing outdoor setting. Owner financing available, making this an attractive opportunity for investors or owner-occupants alike.
Key facts
- Marsh views
- Backyard
- Two-family home
Tags
Neighborhood map
What this means for you Summary
Snapshot
- This is a 2 × 2-bed/1.0-bath units multifamily listed at $540k.
Deal economics
- At list price, monthly cash flow is $324 ($4k/yr) — positive. Per door: $162/mo.
- The deal already cash-flows at list — no discount required.
- To meet the 1% rule (rent ≥ 1% of price), the offer needs to be $519k (3.9% below list).
- Recommended offer: $491k (9.0% below list) — sets the bar for market timing.
- Cap rate 8.0% vs local median 2.5% in Clinton — top-decile yield for the area; either an underpriced asset or a hidden risk that comps aren't pricing in. Stress-test before assuming the spread holds.
Location & tenants
- Location reads 78/100 on livability (#34 in CT, #2,393 nationally) — a middle-class / working-renter tenant base. Strengths: health & safety A+, crime A-, employment B+; Watch: amenities C-, cost of living C-, commute D+.
- Clinton School District (suburban): math 47% / reading 56% proficiency, ranked #76 of 153 in CT (top 50%) — acceptable for families but not a draw, mixed tenant base, ~2y average lease; only 16% free/reduced lunch — higher-income household profile.
- Market conditions: 83 active listings in the ZIP; 6 comparable units currently listed for rent nearby; rentals lingering (median 45d on market — plan ~5-8 weeks vacancy on turnover, expect pricing pressure); 100% of comp listings sitting > 30 days — soft ceiling on asking rent; 278 units permitted in Lower Connecticut River Valley Planning Region in 2024 (89 in 5+ unit buildings).
Forward outlook
- Local home prices are declining (-3.0%/yr); year-one equity from $4k of loan paydown is wiped out by about $16k of value loss. Plan a longer hold.
Negotiation context
- It's been on market 100 days — a 9% lower offer ($491k) is reasonable based on typical stale-listing flexibility.
- 3 sale attempts since 14y ago with the ask held roughly flat each time — persistent listings suggest the price (not the market) is what's stuck; bring a comps-based counter.
- Current owner paid $140k; list at $540k implies a 286% gain — meaningful room to come down on a strong offer.
Risks & watch-outs
- Watch-outs: flood insurance adds $427/mo; built in 1920 — expect roof / HVAC / electrical / plumbing capex.
- Climate carrying-cost: in FEMA flood zone AE (mandatory federal flood insurance); severe wind risk, 80% chance of damaging wind over 30y; extreme-heat days projected 7→18/yr by 2055 (HVAC capex compounding) — expect insurance premiums to compound above CPI over the hold.
Questions for the listing agent
- It's been on market 100 days. Have you received any prior offers? Is the seller open to a 9% concession, seller financing, or rate buy-down credit?
- Can we see the unit-by-unit rent roll, current vacancy, and any below-market leases? What's the average tenancy length?
- What capital expenditures (roof, boiler, parking lot, exteriors) have been made in the last 5 years, and what's planned in the next 2?
- Built in 1920 — when were the roof, HVAC, electrical panel, plumbing, and water heater last replaced?
- What's the actual annual flood-insurance premium (NFIP or private), and is the property in a SFHA with mandatory coverage?
- Why hasn't it sold? Are there any deal-killer items the seller is aware of (foundation, flood, title, zoning, code violations)?
- Is there a deadline driving the sale (1031 exchange, divorce, estate, relocation)? That informs how much negotiation room exists.
- Schools are B-rated — typically a magnet for longer-tenancy family renters. What's the average tenant stay here, and is there a school-zone premium baked into asking?
- What's the average days-on-market for RENTAL listings here right now (not sales)? A rising rental-DOM trend means longer vacancies and softer asking-rent achievability than the comps imply.
- What's the recent tenant-quality profile in this submarket — average credit score on applications, eviction rate, late-payment / NSF rate, and stable-employment percentage? A property-management company in the area should have these aggregated.
- How much new apartment / multifamily construction is in the pipeline within 1–3 miles? Heavy new supply (>2% of stock underway) typically softens rents 12–24 months out; light construction supports rent growth.
Investment metrics
- 1% rule
- 0.96% ✗
- Cap rate
- 7.96%
- Cash-on-cash
- 5.95%
- DSCR
- 1.26
- GRM
- 8.7
CMA / ARV
- ARV (median comp)
- $660,317
- List price
- $539,900
- Delta
- -18.24%
- Verdict
- UNDERPRICED
- Comps
- 2 within 1.0 mi
Projected returns pro-forma
-3.0% appreciation · 3.0% rent growth · sell at horizon
- IRR
- -12.2%
- Equity multiple
- 0.56×
- Total profit
- $-66,776
- Equity at exit
- $80,501
- IRR
- -3.1%
- Equity multiple
- 0.79×
- Total profit
- $-31,181
- Equity at exit
- $46,681
Cash invested: $151,172 (down + closing). Projections, not guarantees.
Landlord ↔ Tenant lean methodology
- Overall (STATE)
- 27 Tenant-Leaning
- State Connecticut
- 27 Tenant-Leaning · D+7
- County
- — inherits STATE
- City
- — inherits STATE
ZIP-level market 06413
- Active inventory
- 83
- Price-to-rent
- 17.3×
Monthly cashflow live
- Estimated rent
- $5,191 medium interval (Pro) →
- Mortgage (P&I)
- −$2,831
- Tax from tax record
- −$295 /mo · $3,535/yr
- Insurance
- −$225
- Flood insurance flood zone
- −$427 /mo · $5,118/yr
- HOA
- −$0
- Vacancy / Maint / Mgmt
- −$1,090
- Net cashflow
- $324
Break-even live
Sensitivity live
| Price | -10% $629 | -5% $476 | +0% $324 | +5% $171 | +10% $18 |
|---|---|---|---|---|---|
| Rent | -10% $-87 | -5% $118 | +0% $324 | +5% $529 | +10% $734 |
| Rate | -1.0pp $595 | -0.5pp $461 | base $324 | +0.5pp $184 | +1.0pp $41 |
2-unit breakdown (identical units grouped — click to expand)
| Units | Beds | Baths | Est. rent |
|---|---|---|---|
| 2× units | 2 | 1 | $5,190 |
| #1 | 2 | 1 | $2,595 |
| #2 | 2 | 1 | $2,595 |
| Total (2 units) | $5,191 | ||
UW: 25.0% down · 7.5% · 30yr · 1.5% tax · 5.0% vac · 8.0% maint · 8.0% mgmt
Financing live
Cash to close
- Down payment
- $134,975
- Closing costs
- $16,197
- Reserves months
- —
- Total cash needed
- —
Loan-product check · same deal, 3 products live
Conventional
25% down · 7.5% · 30yr
- Down + closing
- —
- Monthly P&I
- —
- Monthly cashflow
- —
- DSCR
- —
- Eligible?
- —
Personal DTI + credit; lowest rate.
DSCR
20% down · 8.5% · 30yr
- Down + closing
- —
- Monthly P&I
- —
- Monthly cashflow
- —
- DSCR
- —
- Eligible?
- —
No personal income docs; deal must DSCR.
Hard money
10% down · 12.0% · 12mo
- Down + closing
- —
- Monthly P&I
- —
- Monthly cashflow
- —
- DSCR
- —
- Eligible?
- —
Short-term bridge; refi at stabilization.
Rent comps 6 comps
| Address | Beds | Baths | Sqft | Rent | $/sqft | DOM | Units | Dist |
|---|---|---|---|---|---|---|---|---|
| 89 Grove Beach Rd S Westbrook, CT | 3.0 | 1.5 | 1441 | $7,500 | $5.20 | 44d | 1 | 0.70mi |
| 8 Lewis Ave Westbrook, CT | 1.0 | 2.0 | 2390 | $1,700 | $0.71 | 44d | 1 | 0.73mi |
| 84 Waterside Ln #3 Clinton, CT | 1.0 | 2.0 | 1661 | $4,000 | $2.41 | 44d | 1 | 1.20mi |
| 61 Hammock Rd N Westbrook, CT | 3.0 | 2.0 | 1262 | $3,000 | $2.38 | 44d | 1 | 1.41mi |
| 147 Captains Dr Westbrook, CT | 2.0 | 2.5 | 1788 | $2,500 | $1.40 | 44d | 1 | 1.45mi |
| 19 Underway Dr Westbrook, CT | 3.0 | 2.0 | 1872 | $3,500 | $1.87 | 44d | 1 | 1.50mi |
Listing history 23 events
-
2026-06-21days on market $539,900 Active 100 DOM
-
2026-06-18days on market $539,900 Active 98 DOM
-
2026-06-17days on market $539,900 Active 97 DOM
-
2026-06-16days on market $539,900 Active 96 DOM
-
2026-06-15days on market $539,900 Active 95 DOM
-
2026-06-13days on market $539,900 Active 93 DOM
-
2026-06-12days on market $539,900 Active 92 DOM
-
2026-06-09days on market $539,900 Active 89 DOM
-
2026-06-08days on market $539,900 Active 88 DOM
-
2026-06-07days on market $539,900 Active 87 DOM
-
2026-06-05days on market $539,900 Active 85 DOM
-
2026-06-04days on market $539,900 Active 83 DOM
-
2026-06-02days on market $539,900 Active 82 DOM
-
2026-06-01days on market $539,900 Active 81 DOM
-
2026-05-31days on market $539,900 Active 80 DOM
-
2026-05-31days on market $539,900 Active 79 DOM
-
2026-03-11$539,900 Active 488-char remark
Show marketing remark (488 chars)
Downtown Two-Family Investment Opportunity! Well-located two-family home close to everything - including shops, restaurants, and nearby beaches. Major updates have already been completed, including the roof, windows, mechanical systems, kitchens, and baths, making this a strong turnkey investment. Enjoy marsh views from the backyard, offering a scenic and relaxing outdoor setting. Owner financing available, making this an attractive opportunity for investors or owner-occupants alike.
-
2015-03-02soldstatus $140,000
-
2012-09-30historical
-
2012-09-30historical
-
2012-03-30$185,000
-
2012-03-30$185,000
-
1999-02-02soldstatus $82,000
ⓘ Source: listings_history table (triggers on properties + properties_extension) + one-shot
backfill from property_details.listing_events for pre-trigger history.
Tax reassessment forecast CT · Partial reset (capped growth)
- Current annual tax
- $3,535 · $295/mo
- Projected year-2 tax
- $7,544 · $629/mo
- Expected delta
- +$4,009/yr (+$334/mo · 113.4%)
ⓘ Screening estimate from a state-policy table — verify with the county assessor before closing.
Climate risk First Street
- Flood 10/10 Extreme FEMA zone AE · 99% chance over 30 yrs
- Wildfire 1/10 Low
- Heat 6/10 Major 7 d/yr ≥92°F today · 18 d/yr by 30 yrs out
- Wind 8/10 Severe 80% chance of damaging wind over 30 yrs
- Air quality 4/10 Moderate 4 unhealthy d/yr today · 6 by 30 yrs out
Nearby sold comps map
Loading sold comps map…
Walkable amenities ~0.75 mi
Loading nearby amenities…
Taxation est. · year 1
- Rental income
- $62,292
- − Mortgage interest
- −$30,243
- − Property taxes
- −$3,535
- − Insurance
- −$7,818
- − Repairs & maintenance
- −$4,983
- − Management
- −$4,983
- − Depreciation
- −$15,706
- Taxable loss
- −$4,977
- Est. tax savings @ 24.0%
- +$1,194
- After-tax cash flow
- $5,077/yr
For passive investors: Depreciation is non-cash, so a rental often shows a tax loss while cash-flowing — sheltering income. Rental losses are passive: they offset passive income freely, and up to $25,000/yr can offset ordinary (W-2) income if you actively participate and your MAGI is under $100k (phasing out to $0 by $150k); unused losses carry forward. On sale, claimed depreciation is recaptured at up to 25%, and gains may owe capital-gains tax (a 1031 exchange can defer both). Figures are a year-1 estimate at your 24.0% rate — not tax advice; consult a CPA.
Schools (NCES district)
- District
- Clinton School District
- NCES district ID
- 0900810
- Math proficiency
- 47% ▼ -5.00%
- Reading proficiency
- 56% ▼ -7.00%
- Median HH income
- $71,762
- Composite
- 46.08/100
- National rank
- #2514
- State rank
- #76 of 153 in CT
Livability — Clinton
- Score
- 78/100
- State rank
- #34
- US rank
- #2393
Category grades
Schools grade is shown separately in the Schools card above.
Census & demographics
- Population (ZIP)
- 13,317
Population outlook (Lower Connecticut River Valley County) Hauer SSP2
- By 2040
- 188,651
Race, ethnicity, and origin ACS 2023
- Neighborhood character
- Predominantly White (87%)
- Race & ethnicity
- White 87% Hispanic / Latino 6% Two or more races 4% Asian 2% Pacific Islander 2%
- Hispanic origin (detail)
- Puerto Rican 2%
- Common ancestry
- Romanian 6% Slovak 3% Lithuanian 3%
- Foreign-born
- 7% · Canada, China, Jamaica
- Languages at home
- 91% English-only · Spanish 4% Other Indo-European 2% Chinese 1%
Political lean MEDSL · Lower Connecticut River Valley
- 2024 margin
- D (+13.4) · D 55.9% · R 42.4% · Other 1.7%
- All cycles
- 2024: D+13.4
Not yet ingested
- Civics
- —
Market trends
- HPI YoY
- ▼ -164.95%
- Current HPI
- 192.3695
- Rent YoY
- —
- Metro
- —
- State GDP YoY
- ▲ 1.06%
- F500 in state
- 38
Industry mix (Fortune 500 HQ in CT)
| Industry | F500 HQs | Revenue |
|---|---|---|
| Industrial Machinery | 4 | $38B |
|
||
| Insurance | 3 | $71B |
|
||
| Financial Services | 2 | $25B |
|
||
| Transportation / Logistics | 2 | $18B |
|
||
| Healthcare | 1 | $247B |
|
||
| Telecommunications | 1 | $55B |
|
||
Price history
+558.4% since first listed7 events — show timeline
- 2026-03-11 Listed $539,900 Smart MLS
- 2015-03-02 Sold (Public Records) $140,000 Public Records
- 2012-09-30 Listing Removed — Smart MLS
- 2012-09-30 Listing Removed — Smart MLS
- 2012-03-30 Listed $185,000 Smart MLS
- 2012-03-30 Listed $185,000 Smart MLS
- 1999-02-02 Sold (Public Records) $82,000 Public Records
Property tax history
+0.1%/yrLatest (2023): $3,535 · +0.0% YoY. Source: county tax records.
Cash-flow waterfall
monthlySold comps — $/sqft
last 12 mo · ≤1 miLoading sold comps…