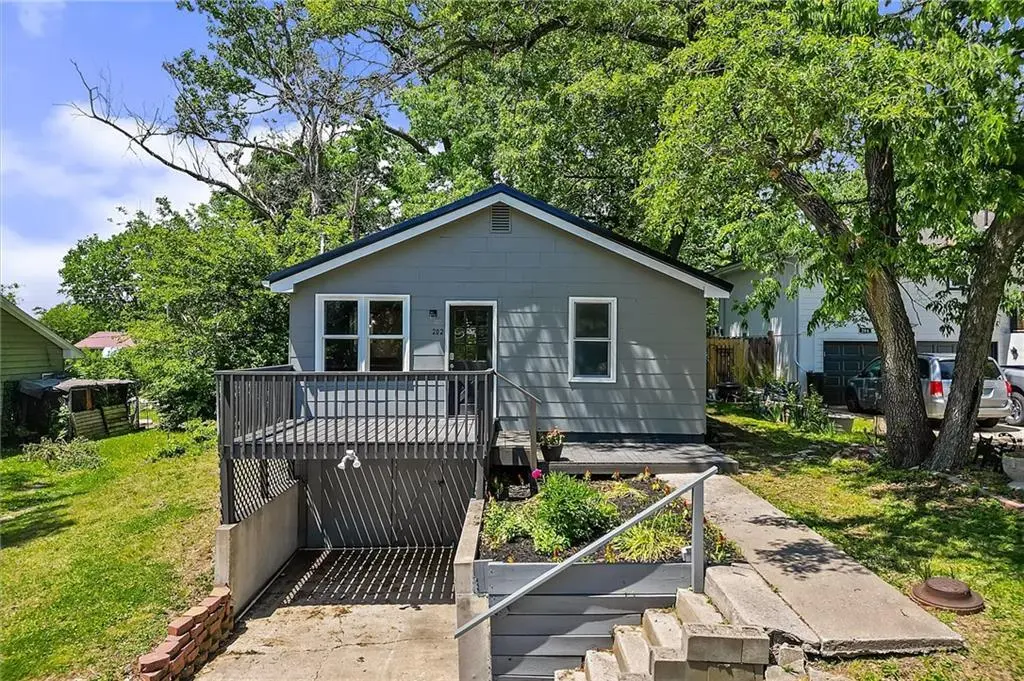
202 N Titus Ave · Excelsior Springs, MO
Flood risk 1/10 · Minimal
- FEMA flood zone
- X (unshaded)
- Chance of flooding over 30 yrs
- 0.0%
- Est. flood insurance / yr
- $473 – $860
Fire risk 2/10 · Minimal
- Est. fire insurance / yr
- $1,054 – $1,958
Heat risk 4/10 · Minor
- Hot days now (above 107°F)
- 7 days/yr
- Hot days in 30 yrs
- 16 days/yr
Wind risk 2/10 · Minimal
- Chance of severe wind over 30 yrs
- —
Air-quality risk 3/10 · Minor
- Unhealthy air days now
- 3 days/yr
- Unhealthy air days in 30 yrs
- 3 days/yr
Risk factors via First Street. Map © Google.
Why this score? — see what drove the D grade
The composite is a weighted blend of 9 inputs, each scored 0–100. Each bar is that input's sub-score; the figure is the points it added to the 100-point composite (weight × sub-score).
- ARV discount +12.0/15.0
- Cash flow +11.8/30.0
- DSCR +3.5/10.0
- Livability +3.4/5.0
- Schools +2.9/10.0
- 1% rule +2.6/10.0
- Rent growth +2.5/5.0
- Condition / age +2.5/5.0
- Appreciation +0.0/10.0
$169,900
🖨 Deal sheet 📄 Offer letter ✓ Due diligence
Listing remarks MLS
HOME IS IN EXCELLENT CONDITION! Will make an excellent investment with renters in place now. Positive cash flow, and no remodeling needed. Hardwood floors, tiled kitchen, and great back yard. Dont pass this one up!
Key facts
- Rustic beam ceilings
- Large backyard
- Spacious shaded lot
Tags
Property features AI
Finance
- Other: Located inside city limits; Living area approximately 952; Lot size approximately 5,280 sq ft (assessor)
- HOA & community: No association fees
Exterior
- Parking: Off-street parking
- Utilities: Public water; Public sewer
- Home design: Single-family residence; Bungalow / Raised ranch floor plan; Residential property
- Construction: Frame construction; Composition roof; Has crawl space basement; Estimated age 76–100 years
- Exterior features: City lot; Not in a flood plain; Lot dimensions approximately 132 x 40
Interior
- Kitchen: Eat-in kitchen; Living/Dining combo
- Bedrooms: 4 bedrooms
- Bathrooms: 1 full bathroom
- Heating & cooling: Forced air heating; Electric cooling
- Interior features: Ceiling fan(s)
Neighborhood map
What this means for you Summary
Snapshot
- This is a 2-bed/1.0-bath single-family listed at $170k.
Deal economics
- At list price, monthly cash flow is $-45 ($-542/yr) — negative.
- To cash-flow at today's rent, offer at most $162k (4.7% below list).
- To meet the 1% rule (rent ≥ 1% of price), the offer needs to be $130k (23.8% below list).
- Recommended offer: $130k (23.8% below list) — sets the bar for 1% rule.
- Cap rate 6.0% vs local median 4.6% in Excelsior Springs — top-decile yield for the area; either an underpriced asset or a hidden risk that comps aren't pricing in. Stress-test before assuming the spread holds.
Location & tenants
- Location reads 67/100 on livability (#228 in MO) — a middle-class / working-renter tenant base. Strengths: cost of living A+, housing A+; Watch: schools D+, crime D+, amenities F.
- Excelsior Springs 40 (town): math 27% / reading 40% proficiency, ranked #225 of 324 in MO (top 69%) — families likely to look elsewhere, expect single-tenant / working-renter base with shorter leases.
- Market conditions: 122 active listings in the ZIP; 6 comparable units currently listed for rent nearby; rentals leasing fast (median 2d on market — plan ~1-2 weeks tenant-placement turnaround); solid renter incomes; 341 units permitted in Clay County in 2024 (40 in 5+ unit buildings).
Forward outlook
- Local home prices are declining (-3.0%/yr); year-one equity from $1k of loan paydown is wiped out by about $5k of value loss. Plan a longer hold.
- Clay County population projected at +24% by 2050 — long-run rental-demand tailwind backs the buy-and-hold thesis.
Negotiation context
- It's been on market 20 days — a 2% lower offer ($167k) is reasonable based on typical stale-listing flexibility.
- 6 sale attempts since 26y ago with the ask held roughly flat each time — persistent listings suggest the price (not the market) is what's stuck; bring a comps-based counter.
Risks & watch-outs
- Watch-outs: built in 1933 — expect roof / HVAC / electrical / plumbing capex.
Questions for the listing agent
- What do current leases actually rent for vs. the listed asking? Can we see a recent rent roll and the last 12 months of T-12 income?
- Built in 1933 — when were the roof, HVAC, electrical panel, plumbing, and water heater last replaced?
- Is there a deadline driving the sale (1031 exchange, divorce, estate, relocation)? That informs how much negotiation room exists.
- Schools are D-rated, which usually means shorter tenancies and higher turnover. Who's the typical renter profile here, and what's been the actual vacancy rate?
- Crime grade is D in this area — have there been break-ins, vandalism, or insurance claims at this property in the last 3 years? What carrier currently insures it and at what premium?
- The area grade is low — what's the realistic commute time and amenity access for the typical tenant pool here? Any planned neighborhood developments (good or bad) we should know about?
- What's the average days-on-market for RENTAL listings here right now (not sales)? A rising rental-DOM trend means longer vacancies and softer asking-rent achievability than the comps imply.
- What's the recent tenant-quality profile in this submarket — average credit score on applications, eviction rate, late-payment / NSF rate, and stable-employment percentage? A property-management company in the area should have these aggregated.
- How much new for-sale + rental construction is in the pipeline within 1–3 miles? Heavy new supply typically softens prices + rents 12–24 months out; constrained supply supports both.
Investment metrics
- 1% rule
- 0.76% ✗
- Cap rate
- 5.97%
- Cash-on-cash
- -1.14%
- DSCR
- 0.95
- GRM
- 10.9
CMA / ARV
- ARV (median comp)
- $188,603
- List price
- $169,900
- Delta
- -9.92%
- Verdict
- FAIR
- Comps
- 20 within 1.0 mi
Show comp detail 12 sales within ~0.75 mi
| Address | Dist | Beds/Ba | Sqft | Sold | Price | $/sf | Match |
|---|---|---|---|---|---|---|---|
| 724 Elmwood St | 0.29mi | 2/1.0 | 955 (+0%) | 3mo | $169,000 | $177 | 84 |
| 332 Woods Ave | 0.19mi | 3/1.5 (+1) | 950 (-0%) | 4mo | $269,900 | $284 | 80 |
| 815 Wilhite St | 0.27mi | 3/1.0 (+1) | 944 (-1%) | 3mo | $180,000 | $191 | 78 |
| 128 Wildwood Ave | 0.37mi | 2/1.0 | 920 (-3%) | 3mo | $115,000 | $125 | 74 |
| 209 Woods Ave | 0.04mi | 2/1.0 | 1,008 (+6%) | 17mo | $196,500 | $195 | 74 |
| 725 Ley St | 0.51mi | 3/1.0 (+1) | 974 (+2%) | 0mo | $185,900 | $191 | 67 |
| 304 Waller Ave | 0.16mi | 2/1.0 | 825 (-13%) | 6mo | $125,000 | $152 | 65 |
| 411 Waller Ave | 0.30mi | 3/2.0 (+1) | 988 (+4%) | 21mo | $199,900 | $202 | 53 |
| 411 Holtz St | 0.32mi | 3/1.0 (+1) | 1,092 (+15%) | 5mo | $149,900 | $137 | 52 |
| 903 Ley Cir | 0.63mi | 3/1.0 (+1) | 960 (+1%) | 18mo | $185,000 | $193 | 49 |
| 500 Waller Ave | 0.37mi | 2/1.0 | 816 (-14%) | 12mo | $189,500 | $232 | 49 |
| 714 St Louis Ave | 0.42mi | 2/1.0 | 816 (-14%) | 16mo | $94,900 | $116 | 43 |
Match score weights: distance 35% · size 25% · config 20% · recency 20%. Top-matched comps best support the ARV.
Projected returns pro-forma
-3.0% appreciation · 3.0% rent growth · sell at horizon
- IRR
- -18.2%
- Equity multiple
- 0.36×
- Total profit
- $-30,453
- Equity at exit
- $25,333
- IRR
- -10.6%
- Equity multiple
- 0.36×
- Total profit
- $-30,406
- Equity at exit
- $14,690
Cash invested: $47,572 (down + closing). Projections, not guarantees.
Landlord ↔ Tenant lean methodology
- Overall (STATE)
- 81 Strongly Landlord-Friendly
- State Missouri
- 81 Strongly Landlord-Friendly · R+10
- County
- — inherits STATE
- City
- — inherits STATE
ZIP-level market 64024
- Home prices YoY
- -15.3%
- Active inventory
- 122
- Price-to-rent
- 10.9×
Monthly cashflow live
- Estimated rent
- $1,295 high interval (Pro) →
- Mortgage (P&I)
- −$891
- Tax from tax record
- −$107 /mo · $1,281/yr
- Insurance
- −$71
- HOA
- −$0
- Vacancy / Maint / Mgmt
- −$272
- Net cashflow
- $-45
Break-even live
UW: 25.0% down · 7.5% · 30yr · 1.5% tax · 5.0% vac · 8.0% maint · 8.0% mgmt
Financing live
Cash to close
- Down payment
- $42,475
- Closing costs
- $5,097
- Reserves months
- —
- Total cash needed
- —
Loan-product check · same deal, 3 products live
Conventional
25% down · 7.5% · 30yr
- Down + closing
- —
- Monthly P&I
- —
- Monthly cashflow
- —
- DSCR
- —
- Eligible?
- —
Personal DTI + credit; lowest rate.
DSCR
20% down · 8.5% · 30yr
- Down + closing
- —
- Monthly P&I
- —
- Monthly cashflow
- —
- DSCR
- —
- Eligible?
- —
No personal income docs; deal must DSCR.
Hard money
10% down · 12.0% · 12mo
- Down + closing
- —
- Monthly P&I
- —
- Monthly cashflow
- —
- DSCR
- —
- Eligible?
- —
Short-term bridge; refi at stabilization.
Rent comps 6 comps
| Address | Beds | Baths | Sqft | Rent | $/sqft | DOM | Units | Dist |
|---|---|---|---|---|---|---|---|---|
| 317 Woods St Excelsior Springs, MO | 2.0 | 1.0 | 884 | $1,350 | $1.53 | 1d | 1 | 0.12mi |
| 1406 Magnolia W Excelsior Springs, MO | 2.0 | 1.0 | 750 | $895 | $1.19 | 21d | 2 | 0.20mi |
| 410 N Titus Ave Excelsior Springs, MO | 3.0 | 2.0 | 910 | $1,476 | $1.62 | 43d | 1 | 0.23mi |
| 117 South St Excelsior Springs, MO | 1.0 | 1.0 | 602 | $900 | $1.49 | 1d | 2 | 0.65mi |
| 701 Tiger Dr Excelsior Springs, MO | 2.0 | 1.5 | 800 | $1,250 | $1.56 | 1d | 1 | 0.70mi |
| 1800 W Jesse James Rd Excelsior Springs, MO | 1.0 | 1.0 | 700 | $995 | $1.42 | 1d | 1 | 0.96mi |
Listing history 16 events
-
2026-06-03days on market $169,900 Active 20 DOM
-
2026-06-02days on market $169,900 Active 19 DOM
-
2026-06-01days on market $169,900 Active 18 DOM
-
2026-05-31days on market $169,900 Active 17 DOM
-
2026-05-14$169,900 Active 1202-char remark
-
2009-10-08soldstatus
-
2008-04-20$60,000 214-char remark
Show marketing remark (214 chars)
HOME IS IN EXCELLENT CONDITION! Will make an excellent investment with renters in place now. Positive cash flow, and no remodeling needed. Hardwood floors, tiled kitchen, and great back yard. Dont pass this one up!
-
2007-07-27$75,000
Show marketing remark (228 chars)
Great deal on 3 bedrooms in very good condition in mid $70's! Recently remodeled with new kitchen cabinets. Tile floor kitchen & bath. Mostly fenced backyard with deck. Wonderful neighborhood. Will consider lease/purchase.
-
2005-10-26soldstatus
-
2005-08-19$56,000
-
2001-01-16soldstatus
-
2001-01-12soldstatus
-
2000-11-21$66,900
-
2000-08-04soldstatus
-
2000-08-03soldstatus
-
2000-04-28$36,900
ⓘ Source: listings_history table (triggers on properties + properties_extension) + one-shot
backfill from property_details.listing_events for pre-trigger history.
Tax reassessment forecast MO · Resets to sale price
- Current annual tax
- $1,281 · $107/mo
- Projected year-2 tax
- $1,648 · $137/mo
- Expected delta
- +$367/yr (+$31/mo · 28.7%)
ⓘ Screening estimate from a state-policy table — verify with the county assessor before closing.
Climate risk First Street
- Flood 1/10 Low FEMA zone X (unshaded) · 0% chance over 30 yrs
- Wildfire 2/10 Low
- Heat 4/10 Moderate 7 d/yr ≥107°F today · 16 d/yr by 30 yrs out
- Wind 2/10 Low
- Air quality 3/10 Moderate 3 unhealthy d/yr today · 3 by 30 yrs out
Nearby sold comps map
Loading sold comps map…
Walkable amenities ~0.75 mi
Loading nearby amenities…
Taxation est. · year 1
- Rental income
- $15,544
- − Mortgage interest
- −$9,517
- − Property taxes
- −$1,281
- − Insurance
- −$850
- − Repairs & maintenance
- −$1,244
- − Management
- −$1,244
- − Depreciation
- −$4,943
- Taxable loss
- −$3,533
- Est. tax savings @ 24.0%
- +$848
- After-tax cash flow
- $306/yr
For passive investors: Depreciation is non-cash, so a rental often shows a tax loss while cash-flowing — sheltering income. Rental losses are passive: they offset passive income freely, and up to $25,000/yr can offset ordinary (W-2) income if you actively participate and your MAGI is under $100k (phasing out to $0 by $150k); unused losses carry forward. On sale, claimed depreciation is recaptured at up to 25%, and gains may owe capital-gains tax (a 1031 exchange can defer both). Figures are a year-1 estimate at your 24.0% rate — not tax advice; consult a CPA.
Schools (NCES district)
- District
- Excelsior Springs 40
- NCES district ID
- 2911650
- Math proficiency
- 27% ▼ -6.00%
- Reading proficiency
- 40% ▼ -1.00%
- Median HH income
- $52,747
- Composite
- 29.32/100
- National rank
- #6548
- State rank
- #225 of 324 in MO
Livability — Excelsior Springs
- Score
- 67/100
- State rank
- #228
- US rank
- #11166
Category grades
Schools grade is shown separately in the Schools card above.
Census & demographics
- Census place
- Excelsior Springs, MO
- County
- Clay County · 220,651 people
- City population
- 15,574
- Metro
- Kansas City, MO-KS
- Population (ZIP)
- 15,574
- Household income
- $77,895
- Rent vs Own
- Severe rent burden
- 329.0
Population outlook (Clay County) Hauer SSP2
- Today (2025)
- 266,022 people
- By 2030
- 280,057 · +5.3%
- By 2040
- 306,153 · +15.1%
- By 2050
- 328,630 · +23.5%
- By 2075
- 375,182 · +41.0%
- By 2100
- 392,861 · +47.7%
Race, ethnicity, and origin ACS 2023
- Neighborhood character
- Predominantly White (85%)
- Race & ethnicity
- White 85% Two or more races 7% Hispanic / Latino 6% Black 3% Native American 1%
- Hispanic origin (detail)
- Mexican 4% Cuban 2%
- Common ancestry
- Italian 2% Serbian 2% Portuguese 1%
- Foreign-born
- 3% · Canada, China
- Languages at home
- 95% English-only · Spanish 3%
Political lean MEDSL · Clay
- 2024 margin
- Lean R (+5.6) · D 46.4% · R 52.0% · Other 1.6%
- 2008→2024 swing
- -4.9pp toward R · 2008: -0.7pp · 2024: -5.6pp
- All cycles
- 2024: R+5.6 2020: R+4.1 2016: R+11.1 2012: R+8.4 2008: R+0.7
Not yet ingested
- Civics
- —
Market trends
- HPI YoY
- ▼ -54.83%
- Current HPI
- 302.9184
- Rent YoY
- —
- Metro
- Kansas City, MO-KS
- State GDP YoY
- ▲ 1.84%
- F500 in state
- 20
Industry mix (Fortune 500 HQ in MO)
| Industry | F500 HQs | Revenue |
|---|---|---|
| Healthcare | 1 | $163B |
|
||
| Insurance | 1 | $21B |
|
||
| Industrial Technology | 1 | $17B |
|
||
| Retail | 1 | $16B |
|
||
| Industrial Distribution | 1 | $10B |
|
||
| Utilities | 1 | $9B |
|
||
Price history
+360.4% since first listed13 events — show timeline
- 2026-06-03 Listing Removed — Heartland MLS as Distributed by MLS Grid
- 2026-05-14 Listed $169,900 Heartland MLS as Distributed by MLS Grid
- 2009-10-08 Sold (Public Records) — Public Records
- 2008-04-20 Listed $60,000 Heartland MLS as Distributed by MLS Grid
- 2007-07-27 Listed $75,000 Heartland MLS as Distributed by MLS Grid
- 2005-10-26 Sold (MLS) — Heartland MLS as Distributed by MLS Grid
- 2005-08-19 Listed $56,000 Heartland MLS as Distributed by MLS Grid
- 2001-01-16 Sold (Public Records) — Public Records
- 2001-01-12 Sold (MLS) — Heartland MLS as Distributed by MLS Grid
- 2000-11-21 Listed $66,900 Heartland MLS as Distributed by MLS Grid
- 2000-08-04 Sold (Public Records) — Public Records
- 2000-08-03 Sold (MLS) — Heartland MLS as Distributed by MLS Grid
- 2000-04-28 Listed $36,900 Heartland MLS as Distributed by MLS Grid
Property tax history
+4.7%/yrLatest (2025): $1,281 · +13.6% YoY. Source: county tax records.
Cash-flow waterfall
monthlySold comps — $/sqft
last 12 mo · ≤1 miLoading sold comps…