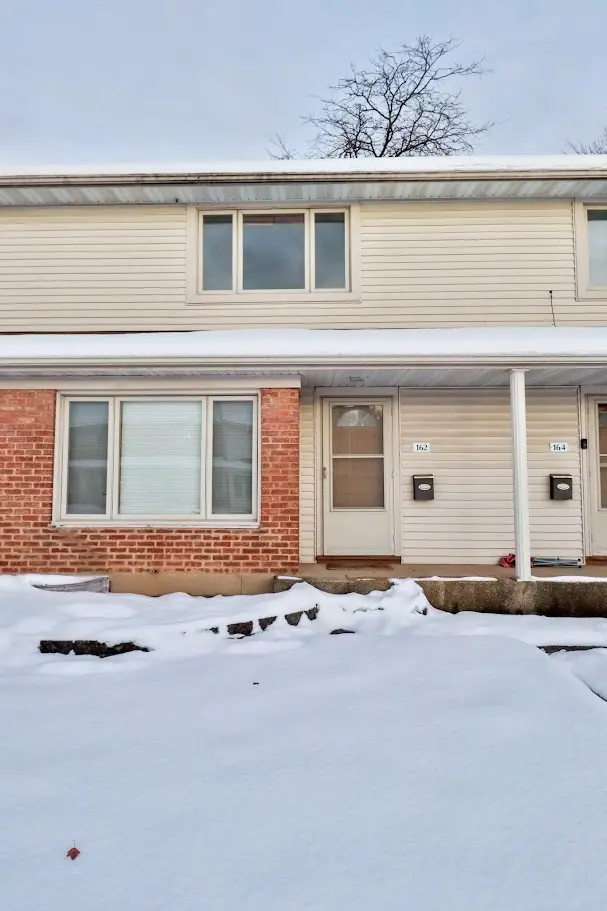
162 Ash St · Park Forest, IL
Flood risk 1/10 · Minimal
- FEMA flood zone
- X (unshaded)
- Chance of flooding over 30 yrs
- 0.0%
- Est. flood insurance / yr
- $507 – $1,088
Fire risk 1/10 · Minimal
- Est. fire insurance / yr
- $804 – $1,492
Heat risk 3/10 · Minor
- Hot days now (above 101°F)
- 7 days/yr
- Hot days in 30 yrs
- 16 days/yr
Wind risk 2/10 · Minimal
- Chance of severe wind over 30 yrs
- —
Air-quality risk 2/10 · Minimal
- Unhealthy air days now
- 1 days/yr
- Unhealthy air days in 30 yrs
- 1 days/yr
Risk factors via First Street. Map © Google.
Why this score? — see what drove the D+ grade
The composite is a weighted blend of 9 inputs, each scored 0–100. Each bar is that input's sub-score; the figure is the points it added to the 100-point composite (weight × sub-score).
- Cash flow +15.0/30.0
- ARV discount +15.0/15.0
- 1% rule +5.0/10.0
- DSCR +5.0/10.0
- Livability +3.9/5.0
- Rent growth +2.5/5.0
- Condition / age +2.5/5.0
- Schools +0.9/10.0
- Appreciation +0.0/10.0
$26,000
🖨 Deal sheet 📄 Offer letter ✓ Due diligence
Listing remarks
Come and enjoy this spacious 2-bedroom, 1-bath townhome located in the Ash Street Co-Op. This home features gleaming hardwood floors throughout, generous closet space, and ample storage. Both bedrooms are well-sized, and the unit offers convenient washer and dryer hookups. Residents have access to comprehensive maintenance, including building exteriors, HVAC systems, water heaters, plumbing, electrical wiring, lawn care, trees, common areas, and snow removal. On-demand maintenance is available to owners as needed. Buyers must receive approval from Co-op Management and qualify based on credit, income, and background review. Owner-occupancy is required; rentals are not permitted. A $50 applic
Key facts
- Hardwood floors
- Ample storage
- $748 HOA
Tags
Property features AI
Finance
- Other: Two-unit building
- Financial info: Not currently leased; No special service area
- HOA & community: Monthly association fee of $748; HOA covers exterior maintenance, lawn care, and snow removal; Pets allowed (cats and dogs allowed; large pets permitted)
Exterior
- Parking: Assigned parking (1 space); Additional/other parking
- Utilities: Water source: Lake Michigan; Public sewer; Electric service (standard)
- Home design: Attached single property; Townhouse — 2 story; Entry level: 1st floor
- Construction: Built approximately 51–60 years ago; Vinyl siding and brick exterior; Asphalt roof; Concrete perimeter foundation; Property built before 1978
- Exterior features: School bus service
Interior
- Kitchen: Kitchen on main level (13 x 8) with ceramic tile flooring
- Bedrooms: Master bedroom on second floor (15 x 13) with hardwood floors; Second bedroom on second floor (14 x 10) with hardwood floors; Additional bedrooms noted
- Flooring: Hardwood flooring in living areas and bedrooms; Ceramic tile in kitchen; Other flooring in basement laundry
- Bathrooms: One full bathroom
- Heating & cooling: Natural gas heating; Central air conditioning
- Interior features: Five total rooms; Unfinished full basement
- Laundry & utility: Laundry room in basement (10 x 10)
Neighborhood map
What this means for you Summary
Snapshot
- This is a 2-bed/1.0-bath townhouse listed at $26k.
Deal economics
- At list price, monthly cash flow is $488 ($6k/yr) — positive.
- The deal already cash-flows at list — no discount required.
- Meets the 1% rule at list price ($2k rent vs $26k).
- Recommended offer: $25k (3.0% below list) — sets the bar for market timing.
- Cap rate 28.8% vs local median 9.7% in Park Forest — top-decile yield for the area; either an underpriced asset or a hidden risk that comps aren't pricing in. Stress-test before assuming the spread holds.
Location & tenants
- Location reads 78/100 on livability (#148 in IL, #2,726 nationally) — a middle-class / working-renter tenant base. Strengths: commute A+, cost of living A+, housing A+; Watch: schools D+, amenities F.
- Rich Twp Hsd 227 (suburban): math 5% / reading 12% proficiency, ranked #577 of 620 in IL (top 93%) — low school quality limits family demand, transient renter base, plan for 1-2y turnover.
- Market conditions: 102 active listings in the ZIP; 13 comparable units currently listed for rent nearby; rentals leasing fast (median 12d on market — plan ~1-2 weeks tenant-placement turnaround); 6,272 units permitted in Cook County in 2024 (4,658 in 5+ unit buildings).
- This rent runs 35% of the median local income ($62k/yr) — at the standard rent-burdened threshold; future hikes will face affordability resistance.
Forward outlook
- Local home prices are declining (-3.0%/yr); year-one equity from $180 of loan paydown is wiped out by about $780 of value loss. Plan a longer hold.
- At projected returns (-3.0% appreciation + 3.0% rent growth), your $7k cash investment doubles in ~2 years — after that, you're playing with house money.
Negotiation context
- It's been on market 46 days — a 3% lower offer ($25k) is reasonable based on typical stale-listing flexibility.
- 4 sale attempts with the ask held roughly flat each time — persistent listings suggest the price (not the market) is what's stuck; bring a comps-based counter.
Risks & watch-outs
- Watch-outs: HOA is 42% of rent.
Questions for the listing agent
- It's been on market 46 days. Have you received any prior offers? Is the seller open to a 3% concession, seller financing, or rate buy-down credit?
- What does the HOA fee cover, when was the last increase, and are there any pending special assessments or reserve-fund shortfalls?
- Is there a deadline driving the sale (1031 exchange, divorce, estate, relocation)? That informs how much negotiation room exists.
- Schools are D-rated, which usually means shorter tenancies and higher turnover. Who's the typical renter profile here, and what's been the actual vacancy rate?
- The area grade is low — what's the realistic commute time and amenity access for the typical tenant pool here? Any planned neighborhood developments (good or bad) we should know about?
- What's the average days-on-market for RENTAL listings here right now (not sales)? A rising rental-DOM trend means longer vacancies and softer asking-rent achievability than the comps imply.
- What's the recent tenant-quality profile in this submarket — average credit score on applications, eviction rate, late-payment / NSF rate, and stable-employment percentage? A property-management company in the area should have these aggregated.
- How much new for-sale + rental construction is in the pipeline within 1–3 miles? Heavy new supply typically softens prices + rents 12–24 months out; constrained supply supports both.
Investment metrics
- 1% rule
- 6.89% ✓
- Cap rate
- 28.84%
- Cash-on-cash
- 80.52%
- DSCR
- 4.58
- GRM
- 1.2
CMA / ARV
- ARV (on-the-fly)
- $51,800
- Comps found
- 3
Show comp detail 3 sales within ~0.75 mi
| Address | Dist | Beds/Ba | Sqft | Sold | Price | $/sf | Match |
|---|---|---|---|---|---|---|---|
| 162 Ash St | 0.00mi | 2/1.0 | 1,400 (0%) | 0mo | $26,000 | $19 | 100 |
| 267 Juniper St #0 | 0.68mi | 2/2.0 | 1,400 (0%) | 2mo | $65,000 | $46 | 63 |
| 215 Krotiak Rd | 0.61mi | 2/1.0 | 1,218 (-13%) | 11mo | $45,000 | $37 | 41 |
Match score weights: distance 35% · size 25% · config 20% · recency 20%. Top-matched comps best support the ARV.
Projected returns pro-forma
-3.0% appreciation · 3.0% rent growth · sell at horizon
- IRR
- 81.3%
- Equity multiple
- 4.76×
- Total profit
- $27,384
- Equity at exit
- $3,877
- IRR
- 84.9%
- Equity multiple
- 10.05×
- Total profit
- $65,882
- Equity at exit
- $2,248
Cash invested: $7,280 (down + closing). Projections, not guarantees.
Landlord ↔ Tenant lean methodology
- Overall (STATE)
- 43 Moderately Tenant-Leaning
- State Illinois
- 43 Moderately Tenant-Leaning · D+7
- County
- — inherits STATE
- City
- — inherits STATE
ZIP-level market 60466
- Home prices YoY
- -21.1%
- Active inventory
- 102
- Price-to-rent
- 1.2×
Monthly cashflow live
- Estimated rent
- $1,793 high interval (Pro) →
- Mortgage (P&I)
- −$136
- Tax est. 1.5%
- −$32 /mo · $390/yr
- Insurance
- −$11
- HOA
- −$748
- Vacancy / Maint / Mgmt
- −$376
- Net cashflow
- $488
Break-even live
UW: 25.0% down · 7.5% · 30yr · 1.5% tax · 5.0% vac · 8.0% maint · 8.0% mgmt
Financing live
Cash to close
- Down payment
- $6,500
- Closing costs
- $780
- Reserves months
- —
- Total cash needed
- —
Loan-product check · same deal, 3 products live
Conventional
25% down · 7.5% · 30yr
- Down + closing
- —
- Monthly P&I
- —
- Monthly cashflow
- —
- DSCR
- —
- Eligible?
- —
Personal DTI + credit; lowest rate.
DSCR
20% down · 8.5% · 30yr
- Down + closing
- —
- Monthly P&I
- —
- Monthly cashflow
- —
- DSCR
- —
- Eligible?
- —
No personal income docs; deal must DSCR.
Hard money
10% down · 12.0% · 12mo
- Down + closing
- —
- Monthly P&I
- —
- Monthly cashflow
- —
- DSCR
- —
- Eligible?
- —
Short-term bridge; refi at stabilization.
Rent comps 13 comps
| Address | Beds | Baths | Sqft | Rent | $/sqft | DOM | Units | Dist |
|---|---|---|---|---|---|---|---|---|
| 631 Andover St Chicago Heights, IL | 3.0 | 1.0 | 900 | $1,450 | $1.61 | 4d | 1 | 0.33mi |
| 444 Hickory St Unit 2A Chicago Heights, IL | 3.0 | 1.0 | 900 | $1,695 | $1.88 | 1d | 1 | 0.61mi |
| 436 W Hickory St Unit Na Chicago Heights, IL | 3.0 | 1.0 | 1091 | $1,800 | $1.65 | 1d | 1 | 0.62mi |
| 432 Hickory St Unit 2 Chicago Heights, IL | 3.0 | 1.0 | 1200 | $1,800 | $1.50 | 20d | 1 | 0.63mi |
| 417 W Hickory St Unit 2 Chicago Heights, IL | 3.0 | 1.0 | 900 | $1,800 | $2.00 | 20d | 1 | 0.69mi |
| 3324 Western Ave Park Forest, IL | 1.0–3.0 | 1.0 | 1026 | $1,680 | $1.64 | 1d | 11 | 0.78mi |
| 370 E 17th St Chicago Heights, IL | 3.0 | 1.0 | 1058 | $2,600 | $2.46 | 17d | 1 | 0.82mi |
| 1267 Division St Unit 1267 Chicago Heights, IL | 3.0 | 1.5 | 1200 | $1,500 | $1.25 | 1d | 1 | 1.07mi |
| 398 W Lincoln Hwy Unit 4 Chicago Heights, IL | 3.0 | 2.0 | 1200 | $1,850 | $1.54 | 1d | 1 | 1.08mi |
| 19 Apple Ln Park Forest, IL | 3.0 | 1.0 | 1541 | $2,300 | $1.49 | 12d | 1 | 1.27mi |
| 1667 Buena Vista Ave Unit 1st floor Chicago Heights, IL | 2.0 | 1.0 | 1300 | $1,525 | $1.17 | 24d | 1 | 1.33mi |
| 63 Hickory St Unit 2 Chicago Heights, IL | 3.0 | 1.0 | 900 | $1,700 | $1.89 | 24d | 1 | 1.48mi |
| 236 Chestnut Ave Unit S South Chicago Heights, IL | 3.0 | 1.0 | 1032 | $2,000 | $1.94 | 24d | 1 | 1.49mi |
HOA detail
- Monthly dues
- $748 · $8,976/yr
- Likely covers
- waterelectriclandscapingsnow removal
Listing history 12 events
-
2026-06-03status $26,000 Pending 46 DOM
-
2026-06-02days on market $26,000 Active 46 DOM
-
2026-06-01days on market $26,000 Active 45 DOM
-
2026-05-31days on market $26,000 Active 44 DOM
-
2026-05-06status Active
-
2026-04-29historical Contingent - Continue to Show
-
2026-04-17$26,000 Active
-
2026-03-11historical Contingent - Continue to Show
-
2026-03-10historical
-
2026-02-10status Active
-
2026-01-30historical Contingent - Continue to Show
-
2026-01-09Active
ⓘ Source: listings_history table (triggers on properties + properties_extension) + one-shot
backfill from property_details.listing_events for pre-trigger history.
Climate risk First Street
- Flood 1/10 Low FEMA zone X (unshaded) · 0% chance over 30 yrs
- Wildfire 1/10 Low
- Heat 3/10 Moderate 7 d/yr ≥101°F today · 16 d/yr by 30 yrs out
- Wind 2/10 Low
- Air quality 2/10 Low 1 unhealthy d/yr today · 1 by 30 yrs out
Nearby sold comps map
Loading sold comps map…
Walkable amenities ~0.75 mi
Loading nearby amenities…
Taxation est. · year 1
- Rental income
- $21,511
- − Mortgage interest
- −$1,456
- − Property taxes
- −$390
- − Insurance
- −$130
- − Repairs & maintenance
- −$1,721
- − Management
- −$1,721
- − HOA
- −$8,976
- − Depreciation
- −$756
- Taxable income
- $6,360
- Est. tax owed @ 24.0%
- −$1,527
- After-tax cash flow
- $4,335/yr
For passive investors: Depreciation is non-cash, so a rental often shows a tax loss while cash-flowing — sheltering income. Rental losses are passive: they offset passive income freely, and up to $25,000/yr can offset ordinary (W-2) income if you actively participate and your MAGI is under $100k (phasing out to $0 by $150k); unused losses carry forward. On sale, claimed depreciation is recaptured at up to 25%, and gains may owe capital-gains tax (a 1031 exchange can defer both). Figures are a year-1 estimate at your 24.0% rate — not tax advice; consult a CPA.
Schools (NCES district)
- District
- Rich Twp Hsd 227
- NCES district ID
- 1733420
- Math proficiency
- 5% ▼ -3.00%
- Reading proficiency
- 12% ▬ 0.00%
- Median HH income
- $56,056
- Composite
- 8.93/100
- National rank
- #9885
- State rank
- #577 of 620 in IL
Livability — Park Forest
- Score
- 78/100
- State rank
- #148
- US rank
- #2726
Category grades
Schools grade is shown separately in the Schools card above.
Census & demographics
- Census place
- Park Forest, IL
- County
- Cook County · 4,486,803 people
- City population
- 21,461
- Metro
- Chicago-Naperville-Elgin, IL-IN-WI
- Population (ZIP)
- 21,461
- Household income
- $61,654
- Rent vs Own
- Severe rent burden
- 900.0
Population outlook (Cook County) Hauer SSP2
- Today (2025)
- 5,347,519 people
- By 2030
- 5,357,703 · +0.2%
- By 2040
- 5,324,924 · -0.4%
- By 2050
- 5,230,762 · -2.2%
- By 2075
- 4,785,735 · -10.5%
- By 2100
- 4,188,836 · -21.7%
Race, ethnicity, and origin ACS 2023
- Neighborhood character
- Predominantly Black (69%)
- Race & ethnicity
- Black 69% White 19% Hispanic / Latino 9% Two or more races 3% Native American 1%
- Hispanic origin (detail)
- Mexican 8%
- Common ancestry
- Romanian 2% Iranian 1% Italian 1%
- Foreign-born
- 6% · Canada
- Languages at home
- 90% English-only · Spanish 7% French/Haitian/Cajun 1% Russian/Polish/Slavic 1%
Political lean MEDSL · Cook
- 2024 margin
- Solid D (+42.0) · D 70.4% · R 28.4% · Other 1.2%
- 2008→2024 swing
- -11.4pp toward R · 2008: 53.4pp · 2024: 42.0pp
- All cycles
- 2024: D+42.0 2020: D+50.3 2016: D+53.0 2012: D+49.4 2008: D+53.4
Not yet ingested
- Civics
- —
Market trends
- HPI YoY
- ▼ -58.87%
- Current HPI
- 219.9692
- Rent YoY
- —
- Metro
- Chicago-Naperville-Elgin, IL-IN-WI
- State GDP YoY
- ▲ 1.59%
- F500 in state
- 60
Industry mix (Fortune 500 HQ in IL)
| Industry | F500 HQs | Revenue |
|---|---|---|
| Insurance | 4 | $201B |
|
||
| Consumer Goods | 4 | $87B |
|
||
| Industrial Machinery | 3 | $64B |
|
||
| Healthcare | 2 | $55B |
|
||
| Retail / Pharmacy | 1 | $148B |
|
||
| Agriculture / Food | 1 | $86B |
|
||
Price history
8 events — show timeline
- 2026-05-06 Relisted — MRED as Distributed by MLS Grid
- 2026-04-29 Contingent — MRED as Distributed by MLS Grid
- 2026-04-17 Listed $26,000 MRED as Distributed by MLS Grid
- 2026-03-11 Contingent — MRED as Distributed by MLS Grid
- 2026-03-10 Listing Removed — MRED as Distributed by MLS Grid
- 2026-02-10 Relisted — MRED as Distributed by MLS Grid
- 2026-01-30 Contingent — MRED as Distributed by MLS Grid
- 2026-01-09 Listed — MRED as Distributed by MLS Grid
Cash-flow waterfall
monthlySold comps — $/sqft
last 12 mo · ≤1 miLoading sold comps…