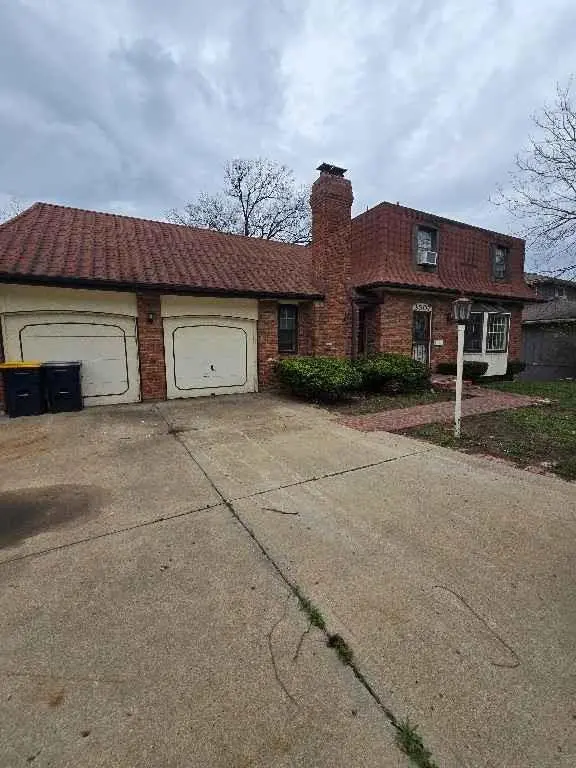
3507 Southern Hills Dr · Kansas City, MO
Flood risk 1/10 · Minimal
- FEMA flood zone
- X (unshaded)
- Chance of flooding over 30 yrs
- 0.0%
- Est. flood insurance / yr
- $473 – $860
Fire risk 3/10 · Minor
- Est. fire insurance / yr
- $1,054 – $1,958
Heat risk 4/10 · Minor
- Hot days now (above 106°F)
- 7 days/yr
- Hot days in 30 yrs
- 17 days/yr
Wind risk 2/10 · Minimal
- Chance of severe wind over 30 yrs
- —
Air-quality risk 3/10 · Minor
- Unhealthy air days now
- 3 days/yr
- Unhealthy air days in 30 yrs
- 3 days/yr
Risk factors via First Street. Map © Google.
Why this score? — see what drove the D+ grade
The composite is a weighted blend of 9 inputs, each scored 0–100. Each bar is that input's sub-score; the figure is the points it added to the 100-point composite (weight × sub-score).
- ARV discount +15.0/15.0
- Cash flow +12.0/30.0
- Rent growth +4.3/5.0
- Livability +3.9/5.0
- DSCR +3.6/10.0
- 1% rule +3.5/10.0
- Condition / age +2.5/5.0
- Schools +1.1/10.0
- Appreciation +0.0/10.0
$229,900
🖨 Deal sheet 📄 Offer letter ✓ Due diligence
Listing remarks MLS
Welcome to this spacious home nestled in an established neighborhood in Kansas City. Offering 3 bedrooms, 2 bathrooms, and over 1,800 square feet of living space, this classic residence blends comfort, functionality, and timeless appeal. Step inside to find a warm and inviting layout featuring generous living areas, a cozy fireplace, and plenty of natural light throughout. The unfinished basement provides additional flexible space—perfect for a second living area, home office, or recreation room. The home sits on an oversized ~0.31-acre lot, offering ample outdoor space for entertaining, gardening, or simply relaxing. Enjoy the convenience of an attached garage, central heating and cooling, and solid mid-century construction with stone exterior accents. Built in 1966, this property offers the charm of an established home with the opportunity to personalize and add value. Located in the St. Catherine’s Gardens area, you’ll appreciate the quiet surroundings while still being close to schools, parks, and everyday amenities. Whether you're looking for your next home or an investment opportunity, this property delivers space, location, and potential.
Key facts
- 0.32 acre lot
- 2 garage spots
- Built 1966
Neighborhood map
What this means for you Summary
Snapshot
- This is a 3-bed/2.0-bath single-family listed at $230k.
Deal economics
- At list price, monthly cash flow is $-53 ($-640/yr) — negative.
- To cash-flow at today's rent, offer at most $220k (4.1% below list).
- To meet the 1% rule (rent ≥ 1% of price), the offer needs to be $196k (15.0% below list).
- Recommended offer: $196k (15.0% below list) — sets the bar for 1% rule.
- Cap rate 6.0% vs local median 3.9% in Kansas City — top-decile yield for the area; either an underpriced asset or a hidden risk that comps aren't pricing in. Stress-test before assuming the spread holds.
Location & tenants
- Location reads 78/100 on livability (#28 in MO, #2,671 nationally) — a middle-class / working-renter tenant base. Strengths: amenities A+, commute A+, cost of living A+; Watch: schools C-, crime F.
- Hickman Mills C-1 (urban): math 8% / reading 18% proficiency, ranked #314 of 324 in MO (top 97%) — low school quality limits family demand, transient renter base, plan for 1-2y turnover; 78% free/reduced lunch — lower-income household profile, screen leases tightly.
- Market conditions: Rents rising fast (+7.3%/yr); 58 active listings in the ZIP; 1 comparable units currently listed for rent nearby; 4,002 units permitted in Jackson County in 2024 (2,271 in 5+ unit buildings).
- This rent runs 36% of the median local income ($66k/yr) — at the standard rent-burdened threshold; future hikes will face affordability resistance.
Forward outlook
- Local home prices are declining (-3.0%/yr); year-one equity from $2k of loan paydown is wiped out by about $7k of value loss. Plan a longer hold.
- Jackson County population projected at +4% by 2050 — modest demand growth; plan on rents tracking national, not racing it.
Negotiation context
- It's been on market 65 days — a 6% lower offer ($216k) is reasonable based on typical stale-listing flexibility.
Questions for the listing agent
- What do current leases actually rent for vs. the listed asking? Can we see a recent rent roll and the last 12 months of T-12 income?
- It's been on market 65 days. Have you received any prior offers? Is the seller open to a 15% concession, seller financing, or rate buy-down credit?
- Built in 1966 — when were the roof, HVAC, electrical panel, plumbing, and water heater last replaced?
- Why hasn't it sold? Are there any deal-killer items the seller is aware of (foundation, flood, title, zoning, code violations)?
- Is there a deadline driving the sale (1031 exchange, divorce, estate, relocation)? That informs how much negotiation room exists.
- Crime grade is F in this area — have there been break-ins, vandalism, or insurance claims at this property in the last 3 years? What carrier currently insures it and at what premium?
- The area grade is low — what's the realistic commute time and amenity access for the typical tenant pool here? Any planned neighborhood developments (good or bad) we should know about?
- What's the average days-on-market for RENTAL listings here right now (not sales)? A rising rental-DOM trend means longer vacancies and softer asking-rent achievability than the comps imply.
- What's the recent tenant-quality profile in this submarket — average credit score on applications, eviction rate, late-payment / NSF rate, and stable-employment percentage? A property-management company in the area should have these aggregated.
- How much new for-sale + rental construction is in the pipeline within 1–3 miles? Heavy new supply typically softens prices + rents 12–24 months out; constrained supply supports both.
Investment metrics
- 1% rule
- 0.85% ✗
- Cap rate
- 6.01%
- Cash-on-cash
- -0.99%
- DSCR
- 0.96
- GRM
- 9.8
CMA / ARV
- ARV (median comp)
- $298,970
- List price
- $229,900
- Delta
- -23.10%
- Verdict
- UNDERPRICED
- Comps
- 20 within 1.0 mi
Show comp detail 12 sales within ~0.75 mi
| Address | Dist | Beds/Ba | Sqft | Sold | Price | $/sf | Match |
|---|---|---|---|---|---|---|---|
| 11105 Askew Ave | 0.21mi | 3/2.0 | 2,075 (-9%) | 3mo | $269,000 | $130 | 72 |
| 3405 Southern Hills Dr | 0.05mi | 4/3.0 (+1) | 2,533 (+11%) | 3mo | $359,000 | $142 | 69 |
| 4309 Grandview Rd | 0.52mi | 4/3.0 (+1) | 2,312 (+1%) | 1mo | $340,000 | $147 | 65 |
| 3006 E 107th Ter | 0.45mi | 3/2.0 | 2,024 (-12%) | 1mo | $235,000 | $116 | 58 |
| 4016 E Red Bridge Rd | 0.26mi | 4/3.0 (+1) | 2,615 (+14%) | 3mo | $289,900 | $111 | 53 |
| 3401 E 105th Ter | 0.60mi | 3/2.5 | 2,086 (-9%) | 3mo | $300,000 | $144 | 53 |
| 10439 Indiana Ave | 0.71mi | 3/2.5 | 2,169 (-5%) | 5mo | $310,000 | $143 | 52 |
| 3702 E 106th Ter | 0.56mi | 3/2.0 | 1,998 (-13%) | 4mo | $170,000 | $85 | 49 |
| 10524 Cleveland Ave | 0.67mi | 4/2.5 (+1) | 2,100 (-8%) | 1mo | $315,000 | $150 | 47 |
| 11028 Cypress Ave | 0.45mi | 4/3.5 (+1) | 2,562 (+12%) | 2mo | $375,000 | $146 | 47 |
| 10518 Mersington Ave | 0.70mi | 4/3.0 (+1) | 2,136 (-7%) | 2mo | $274,900 | $129 | 45 |
| 10432 Indiana Ave | 0.74mi | 4/2.5 (+1) | 2,560 (+12%) | 5mo | $295,500 | $115 | 34 |
Match score weights: distance 35% · size 25% · config 20% · recency 20%. Top-matched comps best support the ARV.
Projected returns pro-forma
-3.0% appreciation · 7.33% rent growth · sell at horizon
- IRR
- -13.2%
- Equity multiple
- 0.51×
- Total profit
- $-31,725
- Equity at exit
- $34,279
- IRR
- 1.5%
- Equity multiple
- 1.12×
- Total profit
- $8,034
- Equity at exit
- $19,878
Cash invested: $64,372 (down + closing). Projections, not guarantees.
Landlord ↔ Tenant lean methodology
- Overall (STATE)
- 81 Strongly Landlord-Friendly
- State Missouri
- 81 Strongly Landlord-Friendly · R+10
- County
- — inherits STATE
- City
- — inherits STATE
ZIP-level market 64137
- Rents YoY
- 7.3%
- Active inventory
- 58
- Price-to-rent
- 9.8×
Monthly cashflow live
- Estimated rent
- $1,955 medium interval (Pro) →
- Mortgage (P&I)
- −$1,206
- Tax from tax record
- −$296 /mo · $3,557/yr
- Insurance
- −$96
- HOA
- −$0
- Vacancy / Maint / Mgmt
- −$411
- Net cashflow
- $-53
Break-even live
UW: 25.0% down · 7.5% · 30yr · 1.5% tax · 5.0% vac · 8.0% maint · 8.0% mgmt
Financing live
Cash to close
- Down payment
- $57,475
- Closing costs
- $6,897
- Reserves months
- —
- Total cash needed
- —
Loan-product check · same deal, 3 products live
Conventional
25% down · 7.5% · 30yr
- Down + closing
- —
- Monthly P&I
- —
- Monthly cashflow
- —
- DSCR
- —
- Eligible?
- —
Personal DTI + credit; lowest rate.
DSCR
20% down · 8.5% · 30yr
- Down + closing
- —
- Monthly P&I
- —
- Monthly cashflow
- —
- DSCR
- —
- Eligible?
- —
No personal income docs; deal must DSCR.
Hard money
10% down · 12.0% · 12mo
- Down + closing
- —
- Monthly P&I
- —
- Monthly cashflow
- —
- DSCR
- —
- Eligible?
- —
Short-term bridge; refi at stabilization.
Rent comps 1 comps
| Address | Beds | Baths | Sqft | Rent | $/sqft | DOM | Units | Dist |
|---|---|---|---|---|---|---|---|---|
| 11204 Kensington Ave Kansas City, MO | 4.0 | 4.0 | 2653 | $2,400 | $0.90 | 23d | 1 | 0.51mi |
Listing history 15 events
-
2026-06-18days on market $229,900 Active 65 DOM
-
2026-06-17days on market $229,900 Active 64 DOM
-
2026-06-16days on market $229,900 Active 63 DOM
-
2026-06-15days on market $229,900 Active 62 DOM
-
2026-06-13days on market $229,900 Active 60 DOM
-
2026-06-13days on market $229,900 Active 59 DOM
-
2026-06-09days on market $229,900 Active 56 DOM
-
2026-06-08days on market $229,900 Active 55 DOM
-
2026-06-07days on market $229,900 Active 54 DOM
-
2026-06-03days on market $229,900 Active 50 DOM
-
2026-06-02days on market $229,900 Active 49 DOM
-
2026-06-01days on market $229,900 Active 48 DOM
-
2026-05-31days on market $229,900 Active 47 DOM
-
2026-04-14$229,900 Active 1181-char remark
Show marketing remark (1181 chars)
Welcome to this spacious home nestled in an established neighborhood in Kansas City. Offering 3 bedrooms, 2 bathrooms, and over 1,800 square feet of living space, this classic residence blends comfort, functionality, and timeless appeal. Step inside to find a warm and inviting layout featuring generous living areas, a cozy fireplace, and plenty of natural light throughout. The unfinished basement provides additional flexible space—perfect for a second living area, home office, or recreation room. The home sits on an oversized ~0.31-acre lot, offering ample outdoor space for entertaining, gardening, or simply relaxing. Enjoy the convenience of an attached garage, central heating and cooling, and solid mid-century construction with stone exterior accents. Built in 1966, this property offers the charm of an established home with the opportunity to personalize and add value. Located in the St. Catherine’s Gardens area, you’ll appreciate the quiet surroundings while still being close to schools, parks, and everyday amenities. Whether you're looking for your next home or an investment opportunity, this property delivers space, location, and potential.
-
1993-10-15soldstatus
ⓘ Source: listings_history table (triggers on properties + properties_extension) + one-shot
backfill from property_details.listing_events for pre-trigger history.
Tax reassessment forecast MO · Resets to sale price
- Current annual tax
- $3,557 · $296/mo
- Projected year-2 tax
- $3,557 · $296/mo
- Expected delta
- $0/yr ($0/mo · 0.0%)
ⓘ Screening estimate from a state-policy table — verify with the county assessor before closing.
Climate risk First Street
- Flood 1/10 Low FEMA zone X (unshaded) · 0% chance over 30 yrs
- Wildfire 3/10 Moderate
- Heat 4/10 Moderate 7 d/yr ≥106°F today · 17 d/yr by 30 yrs out
- Wind 2/10 Low
- Air quality 3/10 Moderate 3 unhealthy d/yr today · 3 by 30 yrs out
Nearby sold comps map
Loading sold comps map…
Walkable amenities ~0.75 mi
Loading nearby amenities…
Taxation est. · year 1
- Rental income
- $23,461
- − Mortgage interest
- −$12,878
- − Property taxes
- −$3,557
- − Insurance
- −$1,150
- − Repairs & maintenance
- −$1,877
- − Management
- −$1,877
- − Depreciation
- −$6,688
- Taxable loss
- −$4,565
- Est. tax savings @ 24.0%
- +$1,096
- After-tax cash flow
- $456/yr
For passive investors: Depreciation is non-cash, so a rental often shows a tax loss while cash-flowing — sheltering income. Rental losses are passive: they offset passive income freely, and up to $25,000/yr can offset ordinary (W-2) income if you actively participate and your MAGI is under $100k (phasing out to $0 by $150k); unused losses carry forward. On sale, claimed depreciation is recaptured at up to 25%, and gains may owe capital-gains tax (a 1031 exchange can defer both). Figures are a year-1 estimate at your 24.0% rate — not tax advice; consult a CPA.
Schools (NCES district)
- District
- Hickman Mills C-1
- NCES district ID
- 2914340
- Math proficiency
- 8% ▼ -8.00%
- Reading proficiency
- 18% ▼ -4.00%
- Median HH income
- $40,908
- Composite
- 11.2/100
- National rank
- #9725
- State rank
- #314 of 324 in MO
Livability — Kansas City
- Score
- 78/100
- State rank
- #28
- US rank
- #2671
Category grades
Schools grade is shown separately in the Schools card above.
Census & demographics
- Census place
- Kansas City, MO
- County
- Jackson County · 687,798 people
- City population
- 439,467
- Metro
- Kansas City, MO-KS
- Population (ZIP)
- 9,422
- Household income
- $66,036
- Rent vs Own
- Severe rent burden
- 356.0
Population outlook (Jackson County) Hauer SSP2
- Today (2025)
- 719,589 people
- By 2030
- 731,456 · +1.6%
- By 2040
- 746,689 · +3.8%
- By 2050
- 749,289 · +4.1%
- By 2075
- 736,227 · +2.3%
- By 2100
- 668,210 · -7.1%
Race, ethnicity, and origin ACS 2023
- Neighborhood character
- Majority White (64%)
- Race & ethnicity
- White 64% Black 23% Two or more races 7% Hispanic / Latino 5% Asian 3%
- Hispanic origin (detail)
- Mexican 3%
- Common ancestry
- Portuguese 5% Italian 3% Romanian 2%
- Foreign-born
- 9% · Canada, South Korea
- Languages at home
- 88% English-only · Spanish 3% Arabic 3% French/Haitian/Cajun 1%
Political lean MEDSL · Jackson
- 2024 margin
- D (+19.3) · D 58.9% · R 39.5% · Other 1.6%
- 2008→2024 swing
- -6.1pp toward R · 2008: 25.4pp · 2024: 19.3pp
- All cycles
- 2024: D+19.3 2020: D+22.0 2016: D+16.6 2012: D+19.0 2008: D+25.4
Not yet ingested
- Civics
- —
Market trends
- HPI YoY
- ▼ -145.45%
- Current HPI
- 255.0556
- Rent YoY
- ▲ 7.33%
- Metro
- Kansas City, MO-KS
- State GDP YoY
- ▲ 1.84%
- F500 in state
- 20
Industry mix (Fortune 500 HQ in MO)
| Industry | F500 HQs | Revenue |
|---|---|---|
| Healthcare | 1 | $163B |
|
||
| Insurance | 1 | $21B |
|
||
| Industrial Technology | 1 | $17B |
|
||
| Retail | 1 | $16B |
|
||
| Industrial Distribution | 1 | $10B |
|
||
| Utilities | 1 | $9B |
|
||
Price history
2 events — show timeline
- 2026-04-14 Listed $229,900 Heartland MLS as Distributed by MLS Grid
- 1993-10-15 Sold (Public Records) — Public Records
Property tax history
+7.0%/yrLatest (2025): $3,557 · +3.8% YoY. Source: county tax records.
Cash-flow waterfall
monthlySold comps — $/sqft
last 12 mo · ≤1 miLoading sold comps…