47763 Joby Magee Rd · Franklinton, LA
Flood risk 1/10 · Minimal
- FEMA flood zone
- X (unshaded)
- Chance of flooding over 30 yrs
- 0.0%
- Est. flood insurance / yr
- $507 – $1,088
Fire risk 7/10 · Major
- Est. fire insurance / yr
- $1,269 – $2,357
Heat risk 8/10 · Major
- Hot days now (above 108°F)
- 7 days/yr
- Hot days in 30 yrs
- 20 days/yr
Wind risk 8/10 · Major
- Chance of severe wind over 30 yrs
- 99.0%
Air-quality risk 1/10 · Minimal
- Unhealthy air days now
- 0 days/yr
- Unhealthy air days in 30 yrs
- 0 days/yr
Risk factors via First Street. Map © Google.
Why this score? — see what drove the B- grade
The composite is a weighted blend of 9 inputs, each scored 0–100. Each bar is that input's sub-score; the figure is the points it added to the 100-point composite (weight × sub-score).
- Cash flow +30.0/30.0
- 1% rule +10.0/10.0
- DSCR +10.0/10.0
- ARV discount +7.2/15.0
- Livability +3.5/5.0
- Schools +2.8/10.0
- Rent growth +2.5/5.0
- Condition / age +2.5/5.0
- Appreciation +0.0/10.0
$69,000
🖨 Deal sheet (PDF) 📄 Offer letter ✓ Due diligence
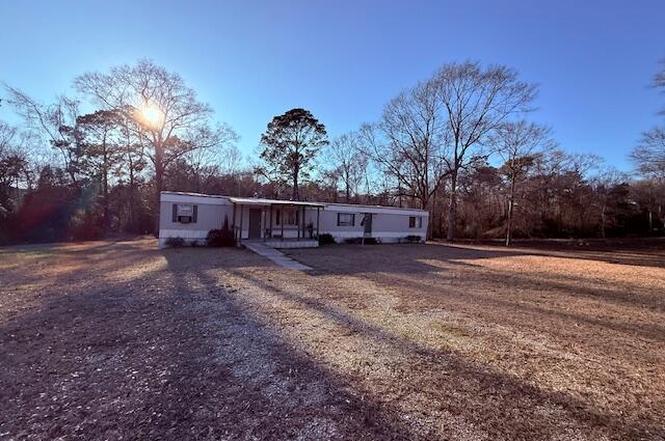
Listing remarks
Mobile home and 2 acres located on Joby Magee Road in Franklinton, LA. Great find here with a 14X70 older mobile home that has been nicely refreshed on the interior, giving it a southern charm that matches the rural setting the property is situated in. The mobile home has 3 bedrooms and 2 baths, with a nice little back porch that overlooks the rear portion of the yard. Settled in the side yard is a really nice 20x30 slab shop that will fit all your toy storage needs. This all is situated on a beautiful 2.7-acre lot that has been underbrush and manicured well. The land has a nice pond with its own well to keep it full during the hot summer months (well needs a new pump). The site offers anot
Key facts
- Pond
- Well
- 2 acres
Tags
Property features AI
Exterior
- Parking: Circular driveway; No garage
- Utilities: Septic tank; Private well water; Electricity available
- Home design: Mobile home / Modular home; One level; Move-in ready
- Construction: Metal siding; Aluminum roof; Rubber roof
- Exterior features: Porch; Workshop; Level, open lot
Interior
- Kitchen: Electric cooktop; Water heater
- Bedrooms: Living room on the main level (14x15) — total rooms listed: 1
- Bathrooms: 2 bathrooms
- Heating & cooling: Space heater; Wall unit(s) for cooling
- Interior features: Bookcases; Ceiling fan(s)
Neighborhood map
What this means for you Summary
Snapshot
- This is a 3-bed/2.0-bath manufactured listed at $69k.
Deal economics
- At list price, monthly cash flow is $692 ($8k/yr) — positive.
- The deal already cash-flows at list — no discount required.
- Meets the 1% rule at list price ($1k rent vs $69k).
- Recommended offer: $67k (3.0% below list) — sets the bar for market timing.
- Cap rate 18.3% vs local median 5.3% in Franklinton — top-decile yield for the area; either an underpriced asset or a hidden risk that comps aren't pricing in. Stress-test before assuming the spread holds.
Location & tenants
- Location reads 69/100 on livability (#67 in LA) — a middle-class / working-renter tenant base. Strengths: cost of living A+, health & safety A+, crime B; Watch: amenities F, commute F, employment F.
- Washington Parish (rural): math 27% / reading 41% proficiency, ranked #38 of 98 in LA (top 39%) — families likely to look elsewhere, expect single-tenant / working-renter base with shorter leases; 77% free/reduced lunch — lower-income household profile, screen leases tightly.
- Market conditions: 246 active listings in the ZIP; 10 units permitted in Washington Parish in 2024 (0 in 5+ unit buildings).
Forward outlook
- Local home prices are declining (-3.0%/yr); year-one equity from $477 of loan paydown is wiped out by about $2k of value loss. Plan a longer hold.
- Washington County population projected at -16% by 2050 — secular population decline; favor cash flow + early exit over multi-decade hold.
- At projected returns (-3.0% appreciation + 3.0% rent growth), your $19k cash investment doubles in ~3 years — after that, you're playing with house money.
Negotiation context
- It's been on market 44 days — a 3% lower offer ($67k) is reasonable based on typical stale-listing flexibility.
- 2 sale attempts with the ask held roughly flat each time — persistent listings suggest the price (not the market) is what's stuck; bring a comps-based counter.
- Current owner paid $45k; list at $69k implies a 53% gain — meaningful room to come down on a strong offer.
Risks & watch-outs
- Climate carrying-cost: severe wind risk, 99% chance of damaging wind over 30y; major wildfire risk; extreme-heat days projected 7→20/yr by 2055 (HVAC capex compounding) — expect insurance premiums to compound above CPI over the hold.
Questions for the listing agent
- It's been on market 44 days. Have you received any prior offers? Is the seller open to a 3% concession, seller financing, or rate buy-down credit?
- Is there a deadline driving the sale (1031 exchange, divorce, estate, relocation)? That informs how much negotiation room exists.
- What's the average days-on-market for RENTAL listings here right now (not sales)? A rising rental-DOM trend means longer vacancies and softer asking-rent achievability than the comps imply.
- What's the recent tenant-quality profile in this submarket — average credit score on applications, eviction rate, late-payment / NSF rate, and stable-employment percentage? A property-management company in the area should have these aggregated.
- How much new for-sale + rental construction is in the pipeline within 1–3 miles? Heavy new supply typically softens prices + rents 12–24 months out; constrained supply supports both.
Investment metrics
- 1% rule
- 2.03% ✓
- Cap rate
- 18.33%
- Cash-on-cash
- 43.00%
- DSCR
- 2.91
- GRM
- 4.1
CMA / ARV
- ARV (on-the-fly)
- $68,600
- Comps found
- 1
Show comp detail 1 sale within ~0.75 mi
| Address | Dist | Beds/Ba | Sqft | Sold | Price | $/sf | Match |
|---|---|---|---|---|---|---|---|
| 47763 Joby Magee Rd | 0.00mi | 3/2.0 | 980 (0%) | 0mo | $69,000 | $70 | 100 |
Match score weights: distance 35% · size 25% · config 20% · recency 20%. Top-matched comps best support the ARV.
Projected returns pro-forma
-3.0% appreciation · 3.0% rent growth · sell at horizon
- IRR
- 39.8%
- Equity multiple
- 2.70×
- Total profit
- $32,890
- Equity at exit
- $10,288
- IRR
- 46.1%
- Equity multiple
- 5.42×
- Total profit
- $85,341
- Equity at exit
- $5,966
Cash invested: $19,320 (down + closing). Projections, not guarantees.
Landlord ↔ Tenant lean methodology
- Overall (STATE)
- 90 Strongly Landlord-Friendly
- State Louisiana
- 90 Strongly Landlord-Friendly · R+12
- County
- — inherits STATE
- City
- — inherits STATE
ZIP-level market 70438
- Home prices YoY
- -14.2%
- Active inventory
- 246
- Price-to-rent
- 4.1×
Monthly cashflow live
- Estimated rent
- $1,401 medium interval (Pro) →
- Mortgage (P&I)
- −$362
- Tax from tax record
- −$24 /mo · $287/yr
- Insurance
- −$29
- HOA
- −$0
- Vacancy / Maint / Mgmt
- −$294
- Net cashflow
- $692
Break-even live
Sensitivity live
| Price | -10% $731 | -5% $712 | +0% $692 | +5% $673 | +10% $653 |
|---|---|---|---|---|---|
| Rent | -10% $582 | -5% $637 | +0% $692 | +5% $748 | +10% $803 |
| Rate | -1.0pp $727 | -0.5pp $710 | base $692 | +0.5pp $674 | +1.0pp $656 |
UW: 25.0% down · 7.5% · 30yr · 1.5% tax · 5.0% vac · 8.0% maint · 8.0% mgmt
Financing live
Cash to close
- Down payment
- $17,250
- Closing costs
- $2,070
- Reserves months
- —
- Total cash needed
- —
Loan-product check · same deal, 3 products live
Conventional
25% down · 7.5% · 30yr
- Down + closing
- —
- Monthly P&I
- —
- Monthly cashflow
- —
- DSCR
- —
- Eligible?
- —
Personal DTI + credit; lowest rate.
DSCR
20% down · 8.5% · 30yr
- Down + closing
- —
- Monthly P&I
- —
- Monthly cashflow
- —
- DSCR
- —
- Eligible?
- —
No personal income docs; deal must DSCR.
Hard money
10% down · 12.0% · 12mo
- Down + closing
- —
- Monthly P&I
- —
- Monthly cashflow
- —
- DSCR
- —
- Eligible?
- —
Short-term bridge; refi at stabilization.
Listing history 7 events
-
2026-04-27status Pending
-
2026-04-09status Active
-
2026-03-11status Pending
-
2026-02-12$69,000 Active
-
2021-09-13soldstatus $45,000
-
2008-02-25soldstatus $28,000
-
2004-04-30soldstatus
ⓘ Source: listings_history table (triggers on properties + properties_extension) + one-shot
backfill from property_details.listing_events for pre-trigger history.
Tax reassessment forecast LA · Resets to sale price
- Current annual tax
- $287 · $24/mo
- Projected year-2 tax
- $380 · $32/mo
- Expected delta
- +$93/yr (+$8/mo · 32.4%)
ⓘ Screening estimate from a state-policy table — verify with the county assessor before closing.
Climate risk First Street
- Flood 1/10 Low FEMA zone X (unshaded) · 0% chance over 30 yrs
- Wildfire 7/10 Severe
- Heat 8/10 Severe 7 d/yr ≥108°F today · 20 d/yr by 30 yrs out
- Wind 8/10 Severe 99% chance of damaging wind over 30 yrs
- Air quality 1/10 Low 0 unhealthy d/yr today · 0 by 30 yrs out
Nearby sold comps map
Loading sold comps map…
Walkable amenities ~0.75 mi
Loading nearby amenities…
Taxation est. · year 1
- Rental income
- $16,811
- − Mortgage interest
- −$3,865
- − Property taxes
- −$287
- − Insurance
- −$345
- − Repairs & maintenance
- −$1,345
- − Management
- −$1,345
- − Depreciation
- −$2,007
- Taxable income
- $7,617
- Est. tax owed @ 24.0%
- −$1,828
- After-tax cash flow
- $6,479/yr
For passive investors: Depreciation is non-cash, so a rental often shows a tax loss while cash-flowing — sheltering income. Rental losses are passive: they offset passive income freely, and up to $25,000/yr can offset ordinary (W-2) income if you actively participate and your MAGI is under $100k (phasing out to $0 by $150k); unused losses carry forward. On sale, claimed depreciation is recaptured at up to 25%, and gains may owe capital-gains tax (a 1031 exchange can defer both). Figures are a year-1 estimate at your 24.0% rate — not tax advice; consult a CPA.
Schools (NCES district)
- District
- Washington Parish
- NCES district ID
- 2201860
- Math proficiency
- 27% ▼ -34.00%
- Reading proficiency
- 41% ▼ -29.00%
- Median HH income
- $34,972
- Composite
- 28.03/100
- National rank
- #6844
- State rank
- #38 of 98 in LA
Livability — Franklinton
- Score
- 69/100
- State rank
- #67
- US rank
- #8352
Category grades
Schools grade is shown separately in the Schools card above.
Census & demographics
- Population (ZIP)
- 19,935
Population outlook (Washington County) Hauer SSP2
- Today (2025)
- 44,642 people
- By 2030
- 43,302 · -3.0%
- By 2040
- 40,345 · -9.6%
- By 2050
- 37,434 · -16.1%
- By 2075
- 29,954 · -32.9%
- By 2100
- 21,579 · -51.7%
Race, ethnicity, and origin ACS 2023
- Neighborhood character
- Predominantly White (73%)
- Race & ethnicity
- White 73% Black 22% Two or more races 4% Hispanic / Latino 2%
- Common ancestry
- Lithuanian 9% Slovak 2% German 1%
- Foreign-born
- 0% · Canada
- Languages at home
- 98% English-only · French/Haitian/Cajun 1%
Political lean MEDSL · Washington
- 2024 margin
- Solid R (+40.3) · D 29.3% · R 69.6% · Other 1.1%
- 2008→2024 swing
- -7.6pp toward R · 2008: -32.7pp · 2024: -40.3pp
- All cycles
- 2024: R+40.3 2020: R+37.6 2016: R+36.8 2012: R+28.3 2008: R+32.7
Not yet ingested
- Civics
- —
Market trends
- HPI YoY
- ▼ -31.73%
- Current HPI
- 191.4762
- Rent YoY
- —
- Metro
- —
- State GDP YoY
- ▲ 3.29%
- F500 in state
- 10
Industry mix (Fortune 500 HQ in LA)
| Industry | F500 HQs | Revenue |
|---|---|---|
| Telecommunications | 2 | $23B |
|
||
| Utilities | 1 | $12B |
|
||
| Wholesale / Distribution | 1 | $5B |
|
||
| Advertising | 1 | $2B |
|
||
Price history
+146.4% since first listed7 events — show timeline
- 2026-04-27 Pending — MLSU
- 2026-04-09 Relisted — MLSU
- 2026-03-11 Pending — MLSU
- 2026-02-12 Listed $69,000 MLSU
- 2021-09-13 Sold (Public Records) $45,000 Public Records
- 2008-02-25 Sold (Public Records) $28,000 Public Records
- 2004-04-30 Sold (Public Records) — Public Records
Property tax history
-1.4%/yrLatest (2025): $287 · +0.4% YoY. Source: county tax records.
Cash-flow waterfall
monthlySold comps — $/sqft
last 12 mo · ≤1 miLoading sold comps…