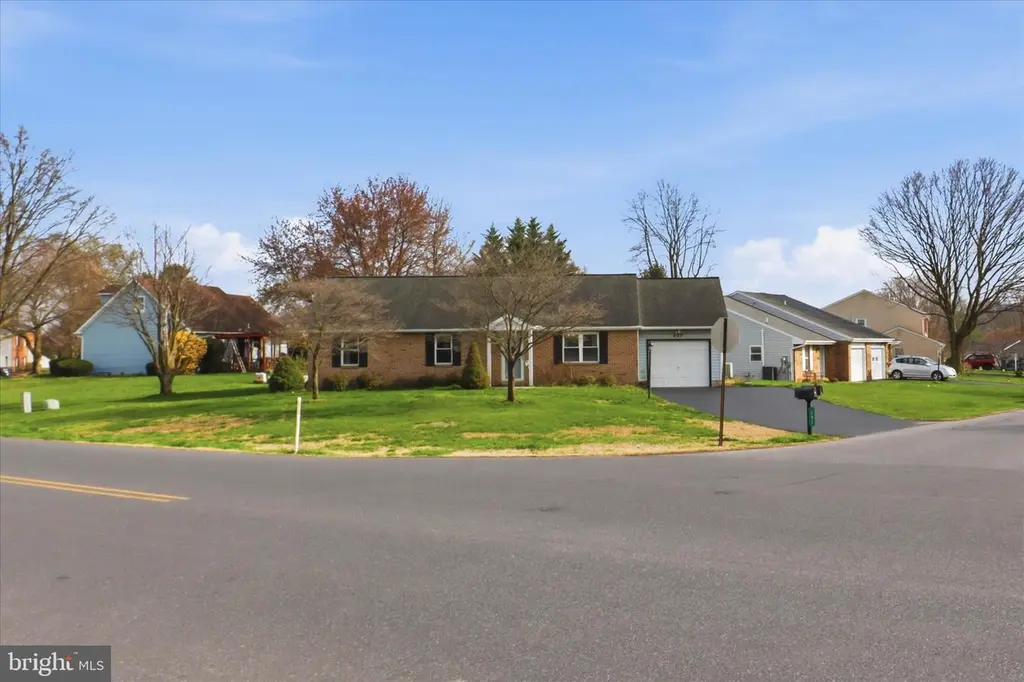
497 Crosswinds Dr · Lititz, PA
Flood risk 1/10 · Minimal
- FEMA flood zone
- X (unshaded)
- Chance of flooding over 30 yrs
- 0.0%
- Est. flood insurance / yr
- $507 – $1,088
Fire risk 1/10 · Minimal
- Est. fire insurance / yr
- $511 – $949
Heat risk 5/10 · Moderate
- Hot days now (above 100°F)
- 7 days/yr
- Hot days in 30 yrs
- 15 days/yr
Wind risk 4/10 · Minor
- Chance of severe wind over 30 yrs
- 16.0%
Air-quality risk 4/10 · Minor
- Unhealthy air days now
- 4 days/yr
- Unhealthy air days in 30 yrs
- 6 days/yr
Risk factors via First Street. Map © Google.
Why this score? — see what drove the D grade
The composite is a weighted blend of 9 inputs, each scored 0–100. Each bar is that input's sub-score; the figure is the points it added to the 100-point composite (weight × sub-score).
- ARV discount +12.2/15.0
- Cash flow +12.1/30.0
- Schools +4.4/10.0
- Livability +4.3/5.0
- DSCR +3.6/10.0
- 1% rule +3.1/10.0
- Rent growth +2.5/5.0
- Condition / age +2.5/5.0
- Appreciation +0.0/10.0
$304,900
🖨 Deal sheet 📄 Offer letter ✓ Due diligence
Listing remarks MLS
Beautifully maintained Rancher on corner lot. Newer heat pump, geothermal water heater, replacement windows and roof. New patio door leads to covered patio and fenced area. Large shed. All appliances included.
Key facts
- 0.27 acre lot
- Garage
- Built 1985
Neighborhood map
What this means for you Summary
Snapshot
- This is a 3-bed/2.0-bath single-family listed at $305k.
Deal economics
- At list price, monthly cash flow is $-68 ($-820/yr) — negative.
- To cash-flow at today's rent, offer at most $293k (4.0% below list).
- To meet the 1% rule (rent ≥ 1% of price), the offer needs to be $247k (19.1% below list).
- Recommended offer: $247k (19.1% below list) — sets the bar for 1% rule.
- Cap rate 6.0% vs local median 3.9% in Lititz — top-decile yield for the area; either an underpriced asset or a hidden risk that comps aren't pricing in. Stress-test before assuming the spread holds.
Location & tenants
- Location reads 86/100 on livability (#57 in PA, #396 nationally) — a professional / high-income tenant draw. Strengths: crime A+, cost of living A+, housing A+; Watch: commute F.
- Warwick SD (suburban): math 42% / reading 58% proficiency, ranked #158 of 539 in PA (top 29%) — acceptable for families but not a draw, mixed tenant base, ~2y average lease; only 20% free/reduced lunch — higher-income household profile.
- Market conditions: 214 active listings in the ZIP; 4 comparable units currently listed for rent nearby; rentals leasing fast (median 14d on market — plan ~1-2 weeks tenant-placement turnaround); solid renter incomes; 1,093 units permitted in Lancaster County in 2024 (201 in 5+ unit buildings).
- This rent runs 30% of the median local income ($97k/yr) — at the standard rent-burdened threshold; future hikes will face affordability resistance.
Forward outlook
- Local home prices are declining (-3.0%/yr); year-one equity from $2k of loan paydown is wiped out by about $9k of value loss. Plan a longer hold.
- Lancaster County population projected at +5% by 2050 — modest demand growth; plan on rents tracking national, not racing it.
Negotiation context
- Only 5 days on market — expect competitive offers; lowballing is unlikely to land.
- 3 sale attempts since 14y ago with the ask held roughly flat each time — persistent listings suggest the price (not the market) is what's stuck; bring a comps-based counter.
- Current owner paid $190k; list at $305k implies a 60% gain — meaningful room to come down on a strong offer.
Risks & watch-outs
- Climate carrying-cost: extreme-heat days projected 7→15/yr by 2055 (HVAC capex compounding) — expect insurance premiums to compound above CPI over the hold.
Questions for the listing agent
- What do current leases actually rent for vs. the listed asking? Can we see a recent rent roll and the last 12 months of T-12 income?
- Is there a deadline driving the sale (1031 exchange, divorce, estate, relocation)? That informs how much negotiation room exists.
- Schools are A-rated — typically a magnet for longer-tenancy family renters. What's the average tenant stay here, and is there a school-zone premium baked into asking?
- The area grade is low — what's the realistic commute time and amenity access for the typical tenant pool here? Any planned neighborhood developments (good or bad) we should know about?
- What's the average days-on-market for RENTAL listings here right now (not sales)? A rising rental-DOM trend means longer vacancies and softer asking-rent achievability than the comps imply.
- What's the recent tenant-quality profile in this submarket — average credit score on applications, eviction rate, late-payment / NSF rate, and stable-employment percentage? A property-management company in the area should have these aggregated.
- How much new for-sale + rental construction is in the pipeline within 1–3 miles? Heavy new supply typically softens prices + rents 12–24 months out; constrained supply supports both.
Investment metrics
- 1% rule
- 0.81% ✗
- Cap rate
- 6.02%
- Cash-on-cash
- -0.96%
- DSCR
- 0.96
- GRM
- 10.3
CMA / ARV
- ARV (on-the-fly)
- $340,860
- Comps found
- 4
Show comp detail 4 sales within ~0.75 mi
| Address | Dist | Beds/Ba | Sqft | Sold | Price | $/sf | Match |
|---|---|---|---|---|---|---|---|
| 631 S Broad St | 0.28mi | 3/1.5 | 1,344 (+12%) | 1mo | $379,900 | $283 | 63 |
| 421 Laurel Ave | 0.58mi | 3/1.0 | 1,229 (+3%) | 8mo | $387,000 | $315 | 58 |
| 320 S Cedar St | 0.61mi | 3/1.5 | 1,215 (+2%) | 22mo | $346,500 | $285 | 49 |
| 705 Woodcrest Ave | 0.55mi | 3/1.0 | 1,179 (-1%) | 24mo | $331,000 | $281 | 48 |
Match score weights: distance 35% · size 25% · config 20% · recency 20%. Top-matched comps best support the ARV.
Projected returns pro-forma
-3.0% appreciation · 3.0% rent growth · sell at horizon
- IRR
- -17.9%
- Equity multiple
- 0.37×
- Total profit
- $-53,775
- Equity at exit
- $45,462
- IRR
- -10.1%
- Equity multiple
- 0.39×
- Total profit
- $-52,503
- Equity at exit
- $26,362
Cash invested: $85,372 (down + closing). Projections, not guarantees.
Landlord ↔ Tenant lean methodology
- Overall (STATE)
- 62 Landlord-Friendly
- State Pennsylvania
- 62 Landlord-Friendly · EVEN
- County
- — inherits STATE
- City
- — inherits STATE
ZIP-level market 17543
- Active inventory
- 214
- Price-to-rent
- 10.3×
Monthly cashflow live
- Estimated rent
- $2,466 medium interval (Pro) →
- Mortgage (P&I)
- −$1,599
- Tax from tax record
- −$290 /mo · $3,485/yr
- Insurance
- −$127
- HOA
- −$0
- Vacancy / Maint / Mgmt
- −$518
- Net cashflow
- $-68
Break-even live
UW: 25.0% down · 7.5% · 30yr · 1.5% tax · 5.0% vac · 8.0% maint · 8.0% mgmt
Financing live
Cash to close
- Down payment
- $76,225
- Closing costs
- $9,147
- Reserves months
- —
- Total cash needed
- —
Loan-product check · same deal, 3 products live
Conventional
25% down · 7.5% · 30yr
- Down + closing
- —
- Monthly P&I
- —
- Monthly cashflow
- —
- DSCR
- —
- Eligible?
- —
Personal DTI + credit; lowest rate.
DSCR
20% down · 8.5% · 30yr
- Down + closing
- —
- Monthly P&I
- —
- Monthly cashflow
- —
- DSCR
- —
- Eligible?
- —
No personal income docs; deal must DSCR.
Hard money
10% down · 12.0% · 12mo
- Down + closing
- —
- Monthly P&I
- —
- Monthly cashflow
- —
- DSCR
- —
- Eligible?
- —
Short-term bridge; refi at stabilization.
Rent comps 4 comps
| Address | Beds | Baths | Sqft | Rent | $/sqft | DOM | Units | Dist |
|---|---|---|---|---|---|---|---|---|
| 446 Crosswinds Dr Lititz, PA | 3.0 | 2.0 | 1284 | $2,250 | $1.75 | 43d | 1 | 0.17mi |
| 446 Crosswinds Dr Lititz, PA | 3.0 | 2.0 | 1300 | $2,250 | $1.73 | 13d | 1 | 0.17mi |
| 100 Wickshire Cir Lititz, PA | 1.0–2.0 | 1.0–2.0 | 1038 | $3,688 | $3.55 | 13d | 4 | 0.48mi |
| 100 W Kleine Ln Lititz, PA | 2.0 | 1.0–2.0 | 874 | $2,095 | $2.40 | 13d | 12 | 1.12mi |
Listing history 11 events
-
2026-04-08status Pending
-
2026-04-04$304,900 Active
-
2026-03-27historical $304,900
-
2018-09-14soldstatus $190,000
-
2018-09-13soldstatus $190,000 Closed 209-char remark
Show marketing remark (209 chars)
Beautifully maintained Rancher on corner lot. Newer heat pump, geothermal water heater, replacement windows and roof. New patio door leads to covered patio and fenced area. Large shed. All appliances included.
-
2018-07-30historical 209-char remark
Show marketing remark (209 chars)
Beautifully maintained Rancher on corner lot. Newer heat pump, geothermal water heater, replacement windows and roof. New patio door leads to covered patio and fenced area. Large shed. All appliances included.
-
2018-07-19$195,000 209-char remark
Show marketing remark (209 chars)
Beautifully maintained Rancher on corner lot. Newer heat pump, geothermal water heater, replacement windows and roof. New patio door leads to covered patio and fenced area. Large shed. All appliances included.
-
2012-11-28soldstatus $157,000
-
2012-11-26soldstatus $157,000 232-char remark
Show marketing remark (232 chars)
Imaculate rancher on corner lot, maintenance free! New carpet LR, large EIK, Master BR w/ master bath. All appliances stay- W, D, Refrig. Tilt-in windows. Covered patio, extra-wide driveway! Call listing office to show. 717-431-0858
-
2012-07-16$157,500 232-char remark
Show marketing remark (232 chars)
Imaculate rancher on corner lot, maintenance free! New carpet LR, large EIK, Master BR w/ master bath. All appliances stay- W, D, Refrig. Tilt-in windows. Covered patio, extra-wide driveway! Call listing office to show. 717-431-0858
-
1989-08-30soldstatus $86,000
ⓘ Source: listings_history table (triggers on properties + properties_extension) + one-shot
backfill from property_details.listing_events for pre-trigger history.
Tax reassessment forecast PA · Partial reset (capped growth)
- Current annual tax
- $3,485 · $290/mo
- Projected year-2 tax
- $4,151 · $346/mo
- Expected delta
- +$666/yr (+$56/mo · 19.1%)
ⓘ Screening estimate from a state-policy table — verify with the county assessor before closing.
Climate risk First Street
- Flood 1/10 Low FEMA zone X (unshaded) · 0% chance over 30 yrs
- Wildfire 1/10 Low
- Heat 5/10 Major 7 d/yr ≥100°F today · 15 d/yr by 30 yrs out
- Wind 4/10 Moderate 16% chance of damaging wind over 30 yrs
- Air quality 4/10 Moderate 4 unhealthy d/yr today · 6 by 30 yrs out
Nearby sold comps map
Loading sold comps map…
Walkable amenities ~0.75 mi
Loading nearby amenities…
Taxation est. · year 1
- Rental income
- $29,591
- − Mortgage interest
- −$17,079
- − Property taxes
- −$3,485
- − Insurance
- −$1,524
- − Repairs & maintenance
- −$2,367
- − Management
- −$2,367
- − Depreciation
- −$8,870
- Taxable loss
- −$6,102
- Est. tax savings @ 24.0%
- +$1,464
- After-tax cash flow
- $645/yr
For passive investors: Depreciation is non-cash, so a rental often shows a tax loss while cash-flowing — sheltering income. Rental losses are passive: they offset passive income freely, and up to $25,000/yr can offset ordinary (W-2) income if you actively participate and your MAGI is under $100k (phasing out to $0 by $150k); unused losses carry forward. On sale, claimed depreciation is recaptured at up to 25%, and gains may owe capital-gains tax (a 1031 exchange can defer both). Figures are a year-1 estimate at your 24.0% rate — not tax advice; consult a CPA.
Schools (NCES district)
- District
- Warwick SD
- NCES district ID
- 4224960
- Math proficiency
- 42% ▼ -6.00%
- Reading proficiency
- 58% ▼ -11.00%
- Median HH income
- $63,696
- Composite
- 44.03/100
- National rank
- #2884
- State rank
- #158 of 539 in PA
Livability — Lititz
- Score
- 86/100
- State rank
- #57
- US rank
- #396
Category grades
Schools grade is shown separately in the Schools card above.
Census & demographics
- County
- Lancaster County · 390,309 people
- City population
- 45,912
- Metro
- Lancaster, PA
- Population (ZIP)
- 45,912
- Household income
- $97,435
- Rent vs Own
- Severe rent burden
- 1164.0
Population outlook (Lancaster County) Hauer SSP2
- Today (2025)
- 561,011 people
- By 2030
- 570,969 · +1.8%
- By 2040
- 585,929 · +4.4%
- By 2050
- 591,056 · +5.4%
- By 2075
- 594,747 · +6.0%
- By 2100
- 558,850 · -0.4%
Race, ethnicity, and origin ACS 2023
- Neighborhood character
- Predominantly White (86%)
- Race & ethnicity
- White 86% Hispanic / Latino 6% Two or more races 5% Asian 3% Black 2%
- Hispanic origin (detail)
- Mexican 1% Puerto Rican 3%
- Common ancestry
- Romanian 3% Lithuanian 2% Italian 2%
- Foreign-born
- 4% · Canada, India, Vietnam
- Languages at home
- 92% English-only · Spanish 3% German/W. Germanic 2% Other Indo-European 1%
Political lean MEDSL · Lancaster
- 2024 margin
- R (+15.9) · D 41.5% · R 57.5%
- 2008→2024 swing
- -4.1pp toward R · 2008: -11.8pp · 2024: -15.9pp
- All cycles
- 2024: R+15.9 2020: R+15.8 2016: R+19.7 2012: R+19.2 2008: R+11.8
Not yet ingested
- Civics
- —
Market trends
- HPI YoY
- ▼ -283.22%
- Current HPI
- 265.3653
- Rent YoY
- —
- Metro
- Lancaster, PA
- State GDP YoY
- ▲ 1.68%
- F500 in state
- 34
Industry mix (Fortune 500 HQ in PA)
| Industry | F500 HQs | Revenue |
|---|---|---|
| Healthcare | 2 | $309B |
|
||
| Insurance | 2 | $27B |
|
||
| Telecommunications / Media | 1 | $124B |
|
||
| Industrial Distribution | 1 | $22B |
|
||
| Financial Services | 1 | $20B |
|
||
| Chemicals / Materials | 1 | $18B |
|
||
Price history
+254.5% since first listed11 events — show timeline
- 2026-04-08 Pending — BRIGHT MLS
- 2026-04-04 Listed $304,900 BRIGHT MLS
- 2026-03-27 Coming Soon $304,900 BRIGHT MLS
- 2018-09-14 Sold (Public Records) $190,000 Public Records
- 2018-09-13 Sold (MLS) $190,000 BRIGHT MLS
- 2018-07-30 Listing Removed — BRIGHT MLS
- 2018-07-19 Listed $195,000 BRIGHT MLS
- 2012-11-28 Sold (Public Records) $157,000 Public Records
- 2012-11-26 Sold (MLS) $157,000 BRIGHT MLS
- 2012-07-16 Listed $157,500 BRIGHT MLS
- 1989-08-30 Sold (Public Records) $86,000 Public Records
Property tax history
+1.8%/yrLatest (2026): $3,485 · +2.1% YoY. Source: county tax records.
Cash-flow waterfall
monthlySold comps — $/sqft
last 12 mo · ≤1 miLoading sold comps…