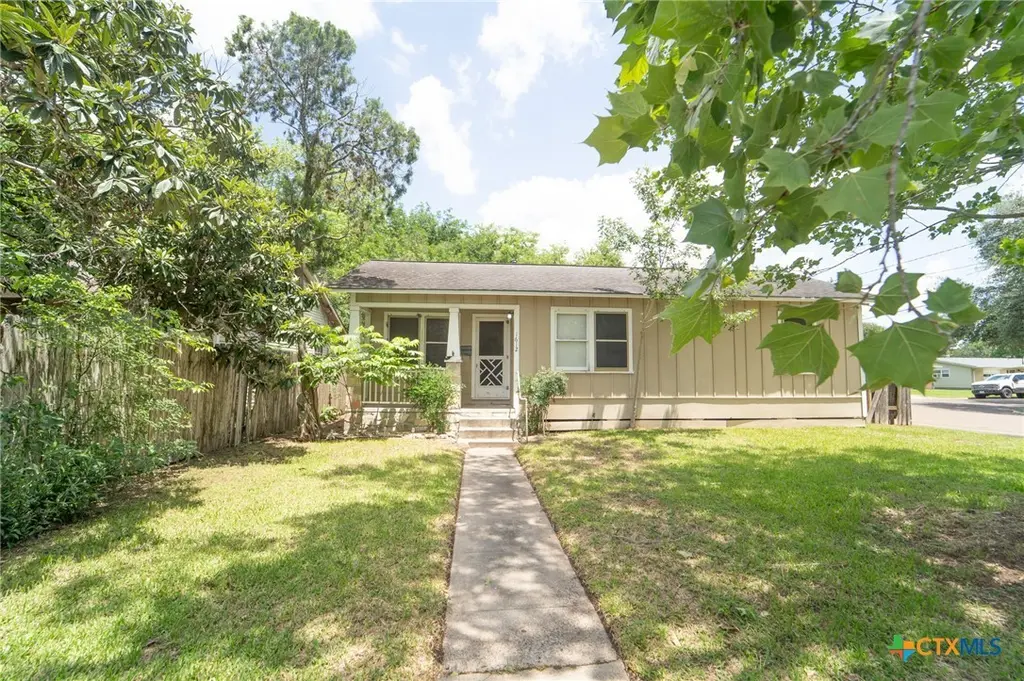
1612 E Mesquite Ln · Victoria, TX
Flood risk 6/10 · Moderate
- FEMA flood zone
- X
- Chance of flooding over 30 yrs
- 0.74%
- Est. flood insurance / yr
- $507 – $1,088
Fire risk 1/10 · Minimal
- Est. fire insurance / yr
- $1,222 – $2,270
Heat risk 9/10 · Severe
- Hot days now (above 111°F)
- 7 days/yr
- Hot days in 30 yrs
- 21 days/yr
Wind risk 8/10 · Major
- Chance of severe wind over 30 yrs
- 99.0%
Air-quality risk 1/10 · Minimal
- Unhealthy air days now
- 0 days/yr
- Unhealthy air days in 30 yrs
- 0 days/yr
Risk factors via First Street. Map © Google.
Why this score? — see what drove the C grade
The composite is a weighted blend of 9 inputs, each scored 0–100. Each bar is that input's sub-score; the figure is the points it added to the 100-point composite (weight × sub-score).
- Cash flow +19.5/30.0
- ARV discount +14.1/15.0
- DSCR +6.2/10.0
- 1% rule +5.1/10.0
- Livability +3.6/5.0
- Schools +2.5/10.0
- Condition / age +2.5/5.0
- Rent growth +2.3/5.0
- Appreciation +0.0/10.0
$115,000
🖨 Deal sheet 📄 Offer letter ✓ Due diligence
Listing remarks MLS
* * Investment Opportunity * * Unlock the potential of this charming 2-bedroom, 1-bath home with a versatile loft, perfectly suited for investors or savvy buyers looking to expand their portfolio. Located in an established area of Victoria, this property offers a unique layout and strong rental potential. Inside, you’ll find a functional floor plan with two comfortable bedrooms, a full bath, and a loft space that can serve as a third sleeping area, home office, or bonus room—adding flexibility and value. The home’s character and layout make it appealing for tenants seeking something beyond the standard rental. Whether you’re looking for a long-term rental, a fix-and-hold, or a light renovation project, this property presents a great opportunity to generate income and build equity. Conveniently located near local amenities, schools, and major roadways, it offers both accessibility and appeal. Don’t miss your chance to invest in a property with potential and versatility—schedule your showing today!
Key facts
- 5,510 sq ft lot
- Parking
- Built 1954
Neighborhood map
What this means for you Summary
Snapshot
- This is a 2-bed/1.0-bath single-family listed at $115k.
Deal economics
- At list price, monthly cash flow is $130 ($2k/yr) — positive.
- The deal already cash-flows at list — no discount required.
- Meets the 1% rule at list price ($1k rent vs $115k).
- Recommended offer: $113k (1.5% below list) — sets the bar for market timing.
- Cap rate 7.6% vs local median 3.7% in Victoria — top-decile yield for the area; either an underpriced asset or a hidden risk that comps aren't pricing in. Stress-test before assuming the spread holds.
Location & tenants
- Location reads 71/100 on livability (#309 in TX) — a middle-class / working-renter tenant base. Strengths: cost of living A+, housing A+, health & safety A+; Watch: crime D+, schools D, amenities F.
- Victoria ISD (urban): math 24% / reading 33% proficiency, ranked #645 of 826 in TX (top 78%) — low school quality limits family demand, transient renter base, plan for 1-2y turnover.
- Market conditions: Rents soft (-0.8%/yr); 196 active listings in the ZIP; 28 comparable units currently listed for rent nearby; rentals lingering (median 44d on market — plan ~5-8 weeks vacancy on turnover, expect pricing pressure); 100% of comp listings sitting > 30 days — soft ceiling on asking rent; 43 units permitted in Victoria County in 2024 (0 in 5+ unit buildings).
Forward outlook
- Local home prices are declining (-3.0%/yr); year-one equity from $795 of loan paydown is wiped out by about $3k of value loss. Plan a longer hold.
- Victoria County population projected at +34% by 2050 — long-run rental-demand tailwind backs the buy-and-hold thesis.
Negotiation context
- It's been on market 24 days — a 2% lower offer ($113k) is reasonable based on typical stale-listing flexibility.
- 2 sale attempts since 8y ago with the ask held roughly flat each time — persistent listings suggest the price (not the market) is what's stuck; bring a comps-based counter.
Risks & watch-outs
- Watch-outs: built in 1954 — expect roof / HVAC / electrical / plumbing capex.
- Climate carrying-cost: major flood risk; severe wind risk, 99% chance of damaging wind over 30y; extreme-heat days projected 7→21/yr by 2055 (HVAC capex compounding) — expect insurance premiums to compound above CPI over the hold.
Questions for the listing agent
- Built in 1954 — when were the roof, HVAC, electrical panel, plumbing, and water heater last replaced?
- Is there a deadline driving the sale (1031 exchange, divorce, estate, relocation)? That informs how much negotiation room exists.
- Schools are D-rated, which usually means shorter tenancies and higher turnover. Who's the typical renter profile here, and what's been the actual vacancy rate?
- Crime grade is D in this area — have there been break-ins, vandalism, or insurance claims at this property in the last 3 years? What carrier currently insures it and at what premium?
- What's the average days-on-market for RENTAL listings here right now (not sales)? A rising rental-DOM trend means longer vacancies and softer asking-rent achievability than the comps imply.
- What's the recent tenant-quality profile in this submarket — average credit score on applications, eviction rate, late-payment / NSF rate, and stable-employment percentage? A property-management company in the area should have these aggregated.
- How much new for-sale + rental construction is in the pipeline within 1–3 miles? Heavy new supply typically softens prices + rents 12–24 months out; constrained supply supports both.
Investment metrics
- 1% rule
- 1.01% ✓
- Cap rate
- 7.65%
- Cash-on-cash
- 4.84%
- DSCR
- 1.22
- GRM
- 8.3
CMA / ARV
- ARV (median comp)
- $134,894
- List price
- $115,000
- Delta
- -14.75%
- Verdict
- UNDERPRICED
- Comps
- 20 within 1.0 mi
Show comp detail 12 sales within ~0.75 mi
| Address | Dist | Beds/Ba | Sqft | Sold | Price | $/sf | Match |
|---|---|---|---|---|---|---|---|
| 1612 E Mesquite Ln | 0.00mi | 2/1.0 | 1,192 (0%) | 0mo | $106,000 | $89 | 100 |
| 1310 E Rosebud Ave | 0.20mi | 3/1.0 (+1) | 1,096 (-8%) | 1mo | $130,000 | $119 | 72 |
| 2007 Mission Dr | 0.67mi | 3/2.0 (+1) | 1,168 (-2%) | 1mo | $132,000 | $113 | 56 |
| 1110 Buena Vista Ave | 0.55mi | 2/2.0 | 1,288 (+8%) | 4mo | $190,000 | $148 | 54 |
| 1304 E Polk Ave | 0.53mi | 3/2.0 (+1) | 1,264 (+6%) | 4mo | $210,000 | $166 | 54 |
| 811 E Rosebud Ave | 0.44mi | 2/1.0 | 1,035 (-13%) | 5mo | $164,000 | $158 | 53 |
| 910 E Polk Ave | 0.65mi | 2/2.0 | 1,264 (+6%) | 4mo | $149,000 | $118 | 52 |
| 2308 Walnut Ave | 0.46mi | 3/2.0 (+1) | 1,320 (+11%) | 3mo | $199,900 | $151 | 49 |
| 1005 Manor Dr | 0.56mi | 3/1.0 (+1) | 1,322 (+11%) | 5mo | $60,000 | $45 | 47 |
| 705 E Hiller | 0.72mi | 3/2.0 (+1) | 1,293 (+8%) | 2mo | $92,000 | $71 | 42 |
| 1308 E Park Ave | 0.67mi | 3/1.0 (+1) | 1,352 (+13%) | 3mo | $138,000 | $102 | 39 |
| 2602 Kay Dr | 0.55mi | 3/2.0 (+1) | 1,368 (+15%) | 5mo | $169,900 | $124 | 37 |
Match score weights: distance 35% · size 25% · config 20% · recency 20%. Top-matched comps best support the ARV.
Projected returns pro-forma
-3.0% appreciation · 0.0% rent growth · sell at horizon
- IRR
- -12.2%
- Equity multiple
- 0.57×
- Total profit
- $-13,756
- Equity at exit
- $17,147
- IRR
- -8.3%
- Equity multiple
- 0.55×
- Total profit
- $-14,415
- Equity at exit
- $9,943
Cash invested: $32,200 (down + closing). Projections, not guarantees.
Landlord ↔ Tenant lean methodology
- Overall (STATE)
- 87 Strongly Landlord-Friendly
- State Texas
- 87 Strongly Landlord-Friendly · R+5
- County
- — inherits STATE
- City
- — inherits STATE
ZIP-level market 77901
- Rents YoY
- -0.8%
- Active inventory
- 196
- Price-to-rent
- 8.3×
Monthly cashflow live
- Estimated rent
- $1,159 high interval (Pro) →
- Mortgage (P&I)
- −$603
- Tax from tax record
- −$135 /mo · $1,619/yr
- Insurance
- −$48
- HOA
- −$0
- Vacancy / Maint / Mgmt
- −$243
- Net cashflow
- $130
Break-even live
UW: 25.0% down · 7.5% · 30yr · 1.5% tax · 5.0% vac · 8.0% maint · 8.0% mgmt
Financing live
Cash to close
- Down payment
- $28,750
- Closing costs
- $3,450
- Reserves months
- —
- Total cash needed
- —
Loan-product check · same deal, 3 products live
Conventional
25% down · 7.5% · 30yr
- Down + closing
- —
- Monthly P&I
- —
- Monthly cashflow
- —
- DSCR
- —
- Eligible?
- —
Personal DTI + credit; lowest rate.
DSCR
20% down · 8.5% · 30yr
- Down + closing
- —
- Monthly P&I
- —
- Monthly cashflow
- —
- DSCR
- —
- Eligible?
- —
No personal income docs; deal must DSCR.
Hard money
10% down · 12.0% · 12mo
- Down + closing
- —
- Monthly P&I
- —
- Monthly cashflow
- —
- DSCR
- —
- Eligible?
- —
Short-term bridge; refi at stabilization.
Rent comps 28 comps
| Address | Beds | Baths | Sqft | Rent | $/sqft | DOM | Units | Dist |
|---|---|---|---|---|---|---|---|---|
| 3001 Arroyo Dr Victoria, TX | 1.0–2.0 | 1.0–2.0 | 857 | $1,330 | $1.55 | 43d | 4 | 0.52mi |
| 1906 Sam Houston Dr Victoria, TX | 1.0–2.0 | 1.0–2.0 | 678 | $1,255 | $1.85 | 43d | 9 | 0.62mi |
| 2303 N Louis St Unit 2307 Victoria, TX | 2.0 | 1.0 | 820 | $850 | $1.04 | 43d | 1 | 0.64mi |
| 2303 N Louis St Unit 2303 Victoria, TX | 3.0 | 1.0 | 850 | $950 | $1.12 | 43d | 1 | 0.64mi |
| 118 Milann St Unit B Victoria, TX | 3.0 | 1.0 | 936 | $1,175 | $1.26 | 43d | 1 | 0.78mi |
| 114 Avant Garde Dr Victoria, TX | 3.0 | 2.0 | 1382 | $1,595 | $1.15 | 43d | 1 | 0.85mi |
| 1605 Bexar Ave Victoria, TX | 3.0 | 1.0 | 762 | $1,395 | $1.83 | 43d | 1 | 0.87mi |
| 1810 E Colorado St Victoria, TX | 1.0–3.0 | 1.0–2.0 | 907 | $1,112 | $1.23 | 43d | 8 | 0.95mi |
| 1603 E Brazos St Victoria, TX | 1.0–2.0 | 1.0 | 796 | $975 | $1.22 | 43d | 6 | 0.99mi |
| 111 Monterrey Dr Unit A Victoria, TX | 2.0 | 2.0 | 1014 | $1,295 | $1.28 | 43d | 1 | 1.00mi |
| 2601 Leary Ln #14 Victoria, TX | 3.0 | 2.0 | 950 | $1,195 | $1.26 | 43d | 1 | 1.04mi |
| 3104 Sam Houston Dr Victoria, TX | 2.0–3.0 | 1.0–1.5 | 925 | $975 | $1.05 | 43d | 2 | 1.07mi |
| 903 Linwood Dr Victoria, TX | 1.0 | 1.0 | 700 | $899 | $1.28 | 44d | 1 | 1.10mi |
| 903 Linwood Dr Victoria, TX | 2.0 | 2.0 | 950 | $1,150 | $1.21 | 43d | 1 | 1.10mi |
| 903 Linwood Dr Apt 406 Victoria, TX | 2.0 | 1.0 | 866 | $975 | $1.13 | 43d | 1 | 1.10mi |
| 301 Westwood St Victoria, TX | 2.0 | 1.0 | 987 | $1,145 | $1.16 | 43d | 1 | 1.19mi |
| 301 Westwood St Apt D Victoria, TX | 2.0 | 1.5 | 987 | $1,145 | $1.16 | 43d | 1 | 1.19mi |
| 2406 E Mockingbird Ln Victoria, TX | 1.0–3.0 | 1.0–2.0 | 1032 | $1,062 | $1.03 | 43d | 4 | 1.20mi |
| 305 E Sabine St Unit A Victoria, TX | 2.0 | 1.0 | 1224 | $1,150 | $0.94 | 43d | 1 | 1.21mi |
| 102 Palmwood Dr Victoria, TX | 2.0 | 2.0 | 1100 | $1,045 | $0.95 | 43d | 1 | 1.22mi |
| 203 Palmwood Dr Unit B Victoria, TX | 3.0 | 2.0 | 1110 | $1,350 | $1.22 | 43d | 1 | 1.22mi |
| 308 Westwood St Unit D Victoria, TX | 2.0 | 1.5 | 1010 | $1,175 | $1.16 | 43d | 1 | 1.26mi |
| 306 Sam Houston Dr Victoria, TX | 1.0–2.0 | 1.0–2.0 | 770 | $1,370 | $1.78 | 43d | 4 | 1.28mi |
| 212 Sam Houston Dr Unit 220 Victoria, TX | 2.0 | 1.0 | 974 | $1,013 | $1.04 | 43d | 1 | 1.32mi |
| 212 Sam Houston Dr Unit 209 Victoria, TX | 2.0 | 1.0 | 974 | $963 | $0.99 | 43d | 1 | 1.32mi |
| 602 Sherwood Dr Unit C Victoria, TX | 2.0 | 2.0 | 1225 | $1,250 | $1.02 | 43d | 1 | 1.32mi |
| 2402 N Ben Wilson St Victoria, TX | 1.0–2.0 | 1.0–2.0 | 987 | $1,580 | $1.60 | 43d | 20 | 1.35mi |
| 407 Versailles St Victoria, TX | 2.0 | 2.0 | 1008 | $1,200 | $1.19 | 43d | 1 | 1.44mi |
Listing history 14 events
-
2026-06-07statusdays on market $115,000 Pending 24 DOM
-
2026-06-03days on market $115,000 Active Under Contract 21 DOM
-
2026-06-02days on market $115,000 Active Under Contract 20 DOM
-
2026-06-01days on market $115,000 Active Under Contract 19 DOM
-
2026-05-31days on market $115,000 Active Under Contract 18 DOM
-
2026-05-30days on market $115,000 Active Under Contract 17 DOM
-
2026-05-13$115,000 Active 1053-char remark
Show marketing remark (1053 chars)
* * Investment Opportunity * * Unlock the potential of this charming 2-bedroom, 1-bath home with a versatile loft, perfectly suited for investors or savvy buyers looking to expand their portfolio. Located in an established area of Victoria, this property offers a unique layout and strong rental potential. Inside, you’ll find a functional floor plan with two comfortable bedrooms, a full bath, and a loft space that can serve as a third sleeping area, home office, or bonus room—adding flexibility and value. The home’s character and layout make it appealing for tenants seeking something beyond the standard rental. Whether you’re looking for a long-term rental, a fix-and-hold, or a light renovation project, this property presents a great opportunity to generate income and build equity. Conveniently located near local amenities, schools, and major roadways, it offers both accessibility and appeal. Don’t miss your chance to invest in a property with potential and versatility—schedule your showing today!
-
2019-03-26historical
-
2018-10-10price $95,000
-
2018-06-05price $99,900
-
2018-03-28price $109,900
-
2018-03-07$115,000 Active
-
2014-10-17soldstatus
-
2012-03-16soldstatus
ⓘ Source: listings_history table (triggers on properties + properties_extension) + one-shot
backfill from property_details.listing_events for pre-trigger history.
Tax reassessment forecast TX · Resets to sale price
- Current annual tax
- $1,619 · $135/mo
- Projected year-2 tax
- $2,104 · $175/mo
- Expected delta
- +$486/yr (+$40/mo · 30.0%)
ⓘ Screening estimate from a state-policy table — verify with the county assessor before closing.
Climate risk First Street
- Flood 6/10 Major FEMA zone X · 74% chance over 30 yrs
- Wildfire 1/10 Low
- Heat 9/10 Extreme 7 d/yr ≥111°F today · 21 d/yr by 30 yrs out
- Wind 8/10 Severe 99% chance of damaging wind over 30 yrs
- Air quality 1/10 Low 0 unhealthy d/yr today · 0 by 30 yrs out
Nearby sold comps map
Loading sold comps map…
Walkable amenities ~0.75 mi
Loading nearby amenities…
Taxation est. · year 1
- Rental income
- $13,908
- − Mortgage interest
- −$6,442
- − Property taxes
- −$1,619
- − Insurance
- −$575
- − Repairs & maintenance
- −$1,113
- − Management
- −$1,113
- − Depreciation
- −$3,345
- Taxable loss
- −$298
- Est. tax savings @ 24.0%
- +$72
- After-tax cash flow
- $1,628/yr
For passive investors: Depreciation is non-cash, so a rental often shows a tax loss while cash-flowing — sheltering income. Rental losses are passive: they offset passive income freely, and up to $25,000/yr can offset ordinary (W-2) income if you actively participate and your MAGI is under $100k (phasing out to $0 by $150k); unused losses carry forward. On sale, claimed depreciation is recaptured at up to 25%, and gains may owe capital-gains tax (a 1031 exchange can defer both). Figures are a year-1 estimate at your 24.0% rate — not tax advice; consult a CPA.
Schools (NCES district)
- District
- Victoria ISD
- NCES district ID
- 4844150
- Math proficiency
- 24% ▼ -12.00%
- Reading proficiency
- 33% ▼ -2.00%
- Median HH income
- $50,534
- Composite
- 24.98/100
- National rank
- #7562
- State rank
- #645 of 826 in TX
Livability — Victoria
- Score
- 71/100
- State rank
- #309
- US rank
- #6960
Category grades
Schools grade is shown separately in the Schools card above.
Census & demographics
- Census place
- Victoria, TX
- County
- Victoria County · 69,915 people
- City population
- 69,915
- Metro
- Victoria, TX
- Population (ZIP)
- 39,854
- Household income
- $57,923
- Rent vs Own
- Severe rent burden
- 1802.0
Population outlook (Victoria County) Hauer SSP2
- Today (2025)
- 106,119 people
- By 2030
- 113,161 · +6.6%
- By 2040
- 127,402 · +20.1%
- By 2050
- 141,953 · +33.8%
- By 2075
- 179,410 · +69.1%
- By 2100
- 200,127 · +88.6%
Race, ethnicity, and origin ACS 2023
- Neighborhood character
- Predominantly Hispanic (66%)
- Race & ethnicity
- Hispanic / Latino 66% Two or more races 30% White 24% Black 7% Asian 2%
- Hispanic origin (detail)
- Mexican 60%
- Common ancestry
- Serbian 2% Lithuanian 1% Italian 1%
- Foreign-born
- 10% · Canada, China
- Languages at home
- 64% English-only · Spanish 35% Chinese 1%
Political lean MEDSL · Victoria
- 2024 margin
- Solid R (+42.6) · D 28.4% · R 71.0%
- 2008→2024 swing
- -9.0pp toward R · 2008: -33.6pp · 2024: -42.6pp
- All cycles
- 2024: R+42.6 2020: R+38.0 2016: R+40.0 2012: R+37.8 2008: R+33.6
Not yet ingested
- Civics
- —
Market trends
- HPI YoY
- ▼ -127.62%
- Current HPI
- 138.3569
- Rent YoY
- ▼ -0.79%
- Metro
- Victoria, TX
- State GDP YoY
- ▲ 3.95%
- F500 in state
- 110
Industry mix (Fortune 500 HQ in TX)
| Industry | F500 HQs | Revenue |
|---|---|---|
| Energy | 16 | $1,198B |
|
||
| Technology | 5 | $198B |
|
||
| Engineering / Construction | 4 | $72B |
|
||
| Energy Services | 3 | $60B |
|
||
| Utilities | 3 | $41B |
|
||
| Healthcare | 2 | $330B |
|
||
Price history
+0.0% since first listed8 events — show timeline
- 2026-05-13 Listed $115,000 CTXMLS
- 2019-03-26 Listing Removed — CTXMLS
- 2018-10-10 Price Changed $95,000 CTXMLS
- 2018-06-05 Price Changed $99,900 CTXMLS
- 2018-03-28 Price Changed $109,900 CTXMLS
- 2018-03-07 Listed $115,000 CTXMLS
- 2014-10-17 Sold (Public Records) — Public Records
- 2012-03-16 Sold (Public Records) — Public Records
Property tax history
-0.2%/yrLatest (2025): $1,619 · -23.3% YoY. Source: county tax records.
Cash-flow waterfall
monthlySold comps — $/sqft
last 12 mo · ≤1 miLoading sold comps…