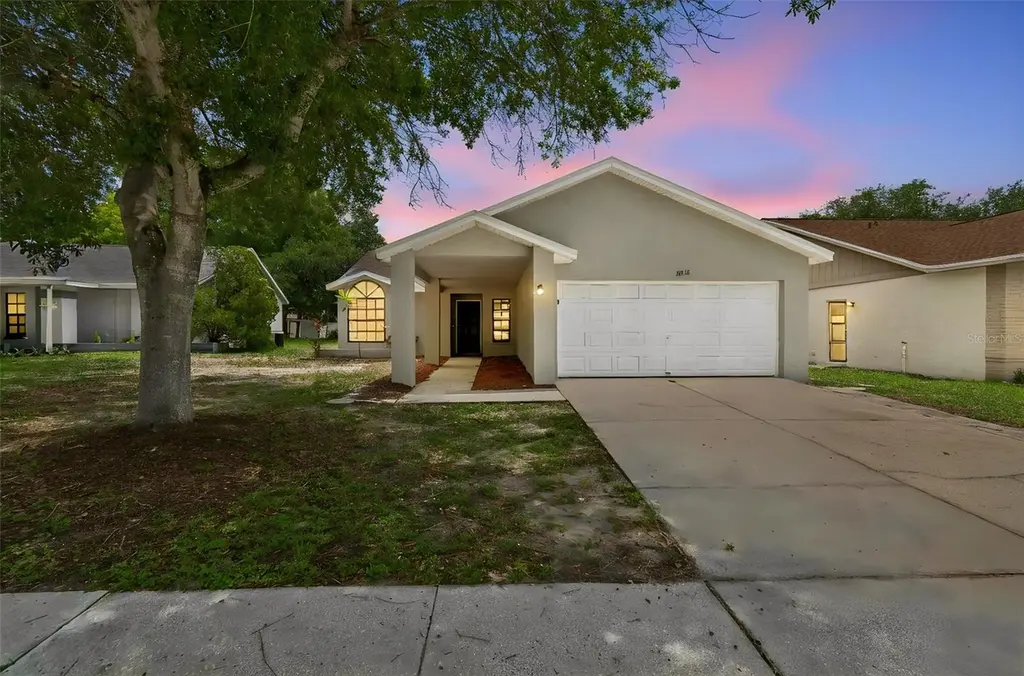
11318 Blackbark Dr · Riverview, FL
Flood risk 5/10 · Moderate
- FEMA flood zone
- X (unshaded)
- Chance of flooding over 30 yrs
- 0.66%
- Est. flood insurance / yr
- $507 – $1,088
Fire risk 4/10 · Minor
- Est. fire insurance / yr
- $947 – $1,759
Heat risk 10/10 · Severe
- Hot days now (above 109°F)
- 7 days/yr
- Hot days in 30 yrs
- 27 days/yr
Wind risk 9/10 · Severe
- Chance of severe wind over 30 yrs
- 99.0%
Air-quality risk 3/10 · Minor
- Unhealthy air days now
- 3 days/yr
- Unhealthy air days in 30 yrs
- 3 days/yr
Risk factors via First Street. Map © Google.
Why this score? — see what drove the D grade
The composite is a weighted blend of 9 inputs, each scored 0–100. Each bar is that input's sub-score; the figure is the points it added to the 100-point composite (weight × sub-score).
- Cash flow +10.9/30.0
- ARV discount +7.5/15.0
- Appreciation +4.3/10.0
- Schools +4.2/10.0
- Livability +4.0/5.0
- DSCR +3.2/10.0
- 1% rule +3.0/10.0
- Rent growth +2.8/5.0
- Condition / age +2.5/5.0
$284,900
🖨 Deal sheet (PDF) 📄 Offer letter ✓ Due diligence
Listing remarks MLS
Welcome to this charming 3-bedroom, 2-bathroom home with a pond view in the Summerfield Community of Riverview. Close to shopping and I75. Schedule a showing today!
Key facts
- Peaceful pond views
- Playgrounds
- Brand-new roof
Tags
Property features AI
Finance
- Other: Total lot dimensions approximately 55 x 100 (0.13 acres); Paved road access
- Financial info: Lease restrictions apply
- HOA & community: Part of Summerfield Master Community Association; Quarterly association fee of $135 (approximately $45/month); Association approval required; Pets allowed
Exterior
- Parking: Attached garage with 2 spaces
- Utilities: Public water; Public sewer; Electricity connected; Water connected
- Home design: Single-family residence; One story; Faces west; Residential zoning (PD)
- Construction: Stucco and frame construction; Shingle roof; Slab foundation; Built with public records living area of 1,271 (listed)
- Exterior features: Rear porch; Sliding doors; Pond view
Interior
- Kitchen: Dishwasher; Microwave; Range; Refrigerator
- Bedrooms: 3 bedrooms
- Flooring: Carpet; Laminate; Tile
- Bathrooms: 2 full bathrooms
- Heating & cooling: Central heating (electric); Central air conditioning
- Interior features: Ceiling fans; Split bedroom layout; Vaulted ceilings
- Laundry & utility: Laundry area located in the garage
Neighborhood map
What this means for you Summary
Snapshot
- This is a 3-bed/2.0-bath single-family listed at $285k.
Deal economics
- At list price, monthly cash flow is $-124 ($-1k/yr) — negative.
- To cash-flow at today's rent, offer at most $263k (7.7% below list).
- To meet the 1% rule (rent ≥ 1% of price), the offer needs to be $228k (19.8% below list).
- Recommended offer: $228k (19.8% below list) — sets the bar for 1% rule.
Location & tenants
- Location reads 79/100 on livability (#134 in FL, #2,000 nationally) — a middle-class / working-renter tenant base. Strengths: housing A+, health & safety A+, employment B+; Watch: amenities F.
- Hillsborough (suburban): math 47% / reading 50% proficiency, ranked #41 of 73 in FL (top 56%) — families likely to look elsewhere, expect single-tenant / working-renter base with shorter leases.
- Zoned schools: Summerfield Elementary School (math 39% / reading 47%, grade F, #1,366 of 2,144 statewide, top 64%, 807 students, 60% FRL); East Bay High School (math 24% / reading 35%, grade F, #447 of 667 statewide, top 68%, 1,995 students, 51% FRL) — zoned schools at 55% FRL track the district average.
- Zoned-school proficiency averages 36% at this address vs 48% district-wide (-12 pts) — the specific schools serving this property underperform the Hillsborough average; the district grade overstates school quality for this exact location.
- Market conditions: Rents rising (+1.2%/yr); 463 active listings in the ZIP; 40 comparable units currently listed for rent nearby; rentals leasing fast (median 7d on market — plan ~1-2 weeks tenant-placement turnaround); high-income renter base; 9,053 units permitted in Hillsborough County in 2024 (4,555 in 5+ unit buildings).
Forward outlook
- Local home prices are declining (-1.4%/yr); year-one equity from $2k of loan paydown is wiped out by about $4k of value loss. Plan a longer hold.
- Hillsborough County population projected at +37% by 2050 — long-run rental-demand tailwind backs the buy-and-hold thesis.
Negotiation context
- It's been on market 16 days — a 2% lower offer ($281k) is reasonable based on typical stale-listing flexibility.
- 4 sale attempts since 9y ago with the ask held roughly flat each time — persistent listings suggest the price (not the market) is what's stuck; bring a comps-based counter.
- Current owner paid $215k; 33% above their basis — modest negotiation headroom, anchor on the comps not their cost.
Risks & watch-outs
- Climate carrying-cost: moderate flood risk; severe wind risk, 99% chance of damaging wind over 30y; extreme-heat days projected 7→27/yr by 2055 (HVAC capex compounding) — expect insurance premiums to compound above CPI over the hold.
Questions for the listing agent
- What do current leases actually rent for vs. the listed asking? Can we see a recent rent roll and the last 12 months of T-12 income?
- What does the HOA fee cover, when was the last increase, and are there any pending special assessments or reserve-fund shortfalls?
- Is there a deadline driving the sale (1031 exchange, divorce, estate, relocation)? That informs how much negotiation room exists.
- Schools are B-rated — typically a magnet for longer-tenancy family renters. What's the average tenant stay here, and is there a school-zone premium baked into asking?
- The area grade is low — what's the realistic commute time and amenity access for the typical tenant pool here? Any planned neighborhood developments (good or bad) we should know about?
- What's the average days-on-market for RENTAL listings here right now (not sales)? A rising rental-DOM trend means longer vacancies and softer asking-rent achievability than the comps imply.
- What's the recent tenant-quality profile in this submarket — average credit score on applications, eviction rate, late-payment / NSF rate, and stable-employment percentage? A property-management company in the area should have these aggregated.
- How much new for-sale + rental construction is in the pipeline within 1–3 miles? Heavy new supply typically softens prices + rents 12–24 months out; constrained supply supports both.
Investment metrics
- 1% rule
- 0.80% ✗
- Cap rate
- 5.77%
- Cash-on-cash
- -1.86%
- DSCR
- 0.92
- GRM
- 10.4
CMA / ARV
No comps found within radius.
Projected returns pro-forma
-1.42% appreciation · 1.18% rent growth · sell at horizon
- IRR
- -11.9%
- Equity multiple
- 0.51×
- Total profit
- $-38,799
- Equity at exit
- $63,058
- IRR
- -6.6%
- Equity multiple
- 0.47×
- Total profit
- $-42,369
- Equity at exit
- $61,462
Cash invested: $79,772 (down + closing). Projections, not guarantees.
Landlord ↔ Tenant lean methodology
- Overall (STATE)
- 87 Strongly Landlord-Friendly
- State Florida
- 87 Strongly Landlord-Friendly · R+3
- County
- — inherits STATE
- City
- — inherits STATE
ZIP-level market 33579
- Home prices YoY
- -0.6%
- Rents YoY
- 1.2%
- Active inventory
- 463
- Price-to-rent
- 10.4×
Monthly cashflow live
- Estimated rent
- $2,284 high interval (Pro) →
- Mortgage (P&I)
- −$1,494
- Tax from tax record
- −$271 /mo · $3,247/yr
- Insurance
- −$119
- HOA
- −$45
- Vacancy / Maint / Mgmt
- −$480
- Net cashflow
- $-124
Break-even live
Sensitivity live
| Price | -10% $38 | -5% $-43 | +0% $-124 | +5% $-204 | +10% $-285 |
|---|---|---|---|---|---|
| Rent | -10% $-304 | -5% $-214 | +0% $-124 | +5% $-33 | +10% $57 |
| Rate | -1.0pp $20 | -0.5pp $-51 | base $-124 | +0.5pp $-198 | +1.0pp $-273 |
UW: 25.0% down · 7.5% · 30yr · 1.5% tax · 5.0% vac · 8.0% maint · 8.0% mgmt
Financing live
Cash to close
- Down payment
- $71,225
- Closing costs
- $8,547
- Reserves months
- —
- Total cash needed
- —
Loan-product check · same deal, 3 products live
Conventional
25% down · 7.5% · 30yr
- Down + closing
- —
- Monthly P&I
- —
- Monthly cashflow
- —
- DSCR
- —
- Eligible?
- —
Personal DTI + credit; lowest rate.
DSCR
20% down · 8.5% · 30yr
- Down + closing
- —
- Monthly P&I
- —
- Monthly cashflow
- —
- DSCR
- —
- Eligible?
- —
No personal income docs; deal must DSCR.
Hard money
10% down · 12.0% · 12mo
- Down + closing
- —
- Monthly P&I
- —
- Monthly cashflow
- —
- DSCR
- —
- Eligible?
- —
Short-term bridge; refi at stabilization.
Rent comps 40 comps
| Address | Beds | Baths | Sqft | Rent | $/sqft | DOM | Units | Dist |
|---|---|---|---|---|---|---|---|---|
| 12712 Longcrest Dr Riverview, FL | 4.0 | 2.0 | 1608 | $2,200 | $1.37 | 26d | 1 | 0.13mi |
| 12605 Longcrest Dr Riverview, FL | 4.0 | 2.0 | 1500 | $2,150 | $1.43 | 5d | 1 | 0.22mi |
| 12722 Evington Point Dr Riverview, FL | 4.0 | 2.0 | 1754 | $2,150 | $1.23 | 26d | 1 | 0.28mi |
| 12722 Evington Point Dr Riverview, FL | 4.0 | 2.0 | 1750 | $2,150 | $1.23 | 6d | 1 | 0.28mi |
| 12845 Longcrest Dr Riverview, FL | 3.0 | 2.0 | 1812 | $2,210 | $1.22 | 0d | 1 | 0.28mi |
| 12906 Longcrest Dr Riverview, FL | 4.0 | 2.0 | 1596 | $2,290 | $1.43 | 3d | 1 | 0.29mi |
| 12612 Ocelot Pl Riverview, FL | 3.0 | 2.0 | 1296 | $2,100 | $1.62 | 6d | 1 | 0.31mi |
| 12914 Astorwood Pl Riverview, FL | 4.0 | 2.0 | 1808 | $2,395 | $1.32 | 1d | 1 | 0.39mi |
| 11759 Lynmoor Dr Riverview, FL | 3.0 | 2.0 | 1355 | $2,019 | $1.49 | 6d | 1 | 0.50mi |
| 12906 Trade Port Pl Riverview, FL | 2.0 | 2.5 | 1532 | $1,800 | $1.17 | 26d | 1 | 0.52mi |
| 11802 Lynmoor Dr Riverview, FL | 3.0 | 2.0 | 1335 | $1,950 | $1.46 | 16d | 1 | 0.53mi |
| 12932 Fieldmoor Ct Riverview, FL | 3.0 | 2.0 | 1355 | $1,895 | $1.40 | 19d | 1 | 0.57mi |
| 12932 Fieldmoor Ct Riverview, FL | 3.0 | 2.0 | 1355 | $1,895 | $1.40 | 16d | 1 | 0.57mi |
| 10943 Keys Gate Dr Riverview, FL | 2.0 | 2.5 | 1532 | $1,800 | $1.17 | 4d | 1 | 0.61mi |
| 10932 Keys Gate Dr Riverview, FL | 3.0 | 2.5 | 1408 | $1,750 | $1.24 | 4d | 1 | 0.61mi |
| 10806 Brickside Ct Riverview, FL | 2.0 | 2.5 | 1448 | $1,650 | $1.14 | 4d | 1 | 0.68mi |
| 10811 Brickside Ct Riverview, FL | 3.0 | 2.5 | 1408 | $1,675 | $1.19 | 26d | 1 | 0.68mi |
| 10811 Brickside Ct Riverview, FL | 3.0 | 2.5 | 1408 | $1,675 | $1.19 | 19d | 1 | 0.68mi |
| 12008 Butler Woods Cir Riverview, FL | 4.0 | 2.0 | 1544 | $2,215 | $1.43 | 0d | 1 | 0.75mi |
| 11931 Lark Song Loop Riverview, FL | 3.0 | 2.0 | 1302 | $2,050 | $1.57 | 26d | 1 | 0.77mi |
| 12019 Butler Woods Cir Riverview, FL | 3.0 | 2.0 | 1693 | $2,230 | $1.32 | 4d | 1 | 0.80mi |
| 12942 Utopia Gardens Way Riverview, FL | 3.0 | 2.5 | 1668 | $2,350 | $1.41 | 4d | 1 | 0.80mi |
| 12942 Utopia Gardens Way Riverview, FL | 3.0 | 2.5 | 1668 | $2,390 | $1.43 | 1d | 1 | 0.80mi |
| 13106 Dobree Pl Riverview, FL | 2.0 | 2.0 | 1404 | $2,350 | $1.67 | 26d | 1 | 0.81mi |
| 12026 Bridge Point Ln Riverview, FL | 3.0 | 2.5 | 1780 | $2,180 | $1.22 | 26d | 1 | 0.81mi |
| 12961 Utopia Gardens Way Riverview, FL | 3.0 | 2.5 | 1668 | $1,890 | $1.13 | 17d | 1 | 0.83mi |
| 13314 Prestwick Dr Riverview, FL | 3.0 | 2.0 | 1465 | $1,895 | $1.29 | 16d | 1 | 0.84mi |
| 12938 Fennway Ridge Dr Riverview, FL | 3.0 | 2.5 | 1541 | $2,000 | $1.30 | 1d | 1 | 0.85mi |
| 11218 Scotchwood Dr Riverview, FL | 3.0 | 2.0 | 1546 | $2,150 | $1.39 | 16d | 1 | 0.86mi |
| 13230 Prestwick Dr Riverview, FL | 3.0 | 2.0 | 1270 | $1,830 | $1.44 | 19d | 1 | 0.86mi |
| 12604 Montford Ln Riverview, FL | 4.0 | 2.0 | 1499 | $1,950 | $1.30 | 5d | 1 | 0.91mi |
| 13114 Fennway Ridge Dr Riverview, FL | 3.0 | 2.5 | 1556 | $2,245 | $1.44 | 4d | 1 | 0.91mi |
| 13130 Fennway Ridge Dr Riverview, FL | 4.0 | 2.5 | 1736 | $2,219 | $1.28 | 4d | 1 | 0.93mi |
| 12116 Feldwood Creek Ln Riverview, FL | 3.0 | 2.0 | 1289 | $1,825 | $1.42 | 22d | 1 | 0.94mi |
| 12115 Feldwood Creek Ln Riverview, FL | 3.0 | 2.0 | 1234 | $1,850 | $1.50 | 6d | 1 | 0.95mi |
| 11030 Whittney Chase Dr Riverview, FL | 3.0 | 2.0 | 1270 | $2,295 | $1.81 | 1d | 1 | 0.96mi |
| 13346 Prestwick Dr Riverview, FL | 3.0 | 2.0 | 1086 | $1,849 | $1.70 | 4d | 1 | 0.96mi |
| 13305 Silvercreek Dr Riverview, FL | 3.0 | 2.0 | 1743 | $2,099 | $1.20 | 6d | 1 | 0.97mi |
| 13311 Laraway Dr Riverview, FL | 3.0 | 2.0 | 1136 | $1,779 | $1.57 | 4d | 1 | 0.99mi |
| 12201 Matchfield Way Riverview, FL | 4.0 | 2.0 | 1522 | $1,595 | $1.05 | 19d | 1 | 0.99mi |
HOA detail
- Monthly dues
- $45 · $540/yr
Listing history 11 events
-
2026-06-21days on market $284,900 Active 16 DOM
-
2026-06-18days on market $284,900 Active 13 DOM
-
2026-06-17days on market $284,900 Active 12 DOM
-
2026-06-16days on market $284,900 Active 11 DOM
-
2026-06-15days on market $284,900 Active 10 DOM
-
2026-06-13days on market $284,900 Active 8 DOM
-
2026-06-13days on market $284,900 Active 7 DOM
-
2026-06-09days on market $284,900 Active 4 DOM
-
2026-06-08days on market $284,900 Active 3 DOM
-
2026-06-07remarks 699-char remark
-
2026-06-07$284,900 Active 2 DOM
ⓘ Source: listings_history table (triggers on properties + properties_extension) + one-shot
backfill from property_details.listing_events for pre-trigger history.
Tax reassessment forecast FL · Resets to sale price
- Current annual tax
- $3,247 · $271/mo
- Projected year-2 tax
- $3,247 · $271/mo
- Expected delta
- $0/yr ($0/mo · 0.0%)
ⓘ Screening estimate from a state-policy table — verify with the county assessor before closing.
Climate risk First Street
- Flood 5/10 Major FEMA zone X (unshaded) · 66% chance over 30 yrs
- Wildfire 4/10 Moderate
- Heat 10/10 Extreme 7 d/yr ≥109°F today · 27 d/yr by 30 yrs out
- Wind 9/10 Extreme 99% chance of damaging wind over 30 yrs
- Air quality 3/10 Moderate 3 unhealthy d/yr today · 3 by 30 yrs out
Nearby sold comps map
Loading sold comps map…
Walkable amenities ~0.75 mi
Loading nearby amenities…
Taxation est. · year 1
- Rental income
- $27,412
- − Mortgage interest
- −$15,959
- − Property taxes
- −$3,247
- − Insurance
- −$1,424
- − Repairs & maintenance
- −$2,193
- − Management
- −$2,193
- − HOA
- −$540
- − Depreciation
- −$8,288
- Taxable loss
- −$6,432
- Est. tax savings @ 24.0%
- +$1,544
- After-tax cash flow
- $60/yr
For passive investors: Depreciation is non-cash, so a rental often shows a tax loss while cash-flowing — sheltering income. Rental losses are passive: they offset passive income freely, and up to $25,000/yr can offset ordinary (W-2) income if you actively participate and your MAGI is under $100k (phasing out to $0 by $150k); unused losses carry forward. On sale, claimed depreciation is recaptured at up to 25%, and gains may owe capital-gains tax (a 1031 exchange can defer both). Figures are a year-1 estimate at your 24.0% rate — not tax advice; consult a CPA.
Schools (NCES district)
- District
- Hillsborough
- NCES district ID
- 1200870
- Math proficiency
- 47% ▼ -8.00%
- Reading proficiency
- 50% ▼ -4.00%
- Median HH income
- $50,622
- Composite
- 41.6/100
- National rank
- #3435
- State rank
- #41 of 73 in FL
Livability — Riverview
- Score
- 79/100
- State rank
- #134
- US rank
- #2000
Category grades
Schools grade is shown separately in the Schools card above.
Census & demographics
- Census place
- Riverview, FL
- County
- Hillsborough County · 1,540,968 people
- City population
- 137,988
- Metro
- Tampa-St. Petersburg-Clearwater, FL
- Population (ZIP)
- 49,470
- Household income
- $116,134
- Rent vs Own
- Severe rent burden
- 258.0
Population outlook (Hillsborough County) Hauer SSP2
- Today (2025)
- 1,607,022 people
- By 2030
- 1,733,968 · +7.9%
- By 2040
- 1,979,565 · +23.2%
- By 2050
- 2,203,427 · +37.1%
- By 2075
- 2,667,893 · +66.0%
- By 2100
- 2,891,558 · +79.9%
Race, ethnicity, and origin ACS 2023
- Neighborhood character
- Highly diverse neighborhood (Simpson 0.71)
- Race & ethnicity
- White 42% Hispanic / Latino 25% Black 24% Two or more races 19% Asian 5%
- Hispanic origin (detail)
- Mexican 3% Puerto Rican 12% Cuban 3% Dominican 1%
- Common ancestry
- Hispanic 1% British 1% Romanian 1%
- Foreign-born
- 17% · Canada, Jamaica, China
- Languages at home
- 73% English-only · Spanish 19% Other Indo-European 2% French/Haitian/Cajun 1%
Political lean MEDSL · Hillsborough
- 2024 margin
- Toss-up / Even · D 47.8% · R 50.9% · Other 1.3%
- 2008→2024 swing
- -10.2pp toward R · 2008: 7.1pp · 2024: -3.1pp
- All cycles
- 2024: R+3.1 2020: D+6.9 2016: D+6.8 2012: D+6.7 2008: D+7.1
Not yet ingested
- Civics
- —
Market trends
- HPI YoY
- ▼ -1.42%
- Current HPI
- 240.5825
- Rent YoY
- ▲ 1.18%
- Metro
- Tampa-St. Petersburg-Clearwater, FL
- State GDP YoY
- ▲ 3.28%
- F500 in state
- 36
Industry mix (Fortune 500 HQ in FL)
| Industry | F500 HQs | Revenue |
|---|---|---|
| Industrial Technology | 2 | $29B |
|
||
| Insurance | 2 | $17B |
|
||
| Retail | 1 | $60B |
|
||
| Technology Distribution | 1 | $58B |
|
||
| Homebuilding | 1 | $35B |
|
||
| Technology Manufacturing | 1 | $35B |
|
||
Price history
+277.4% since first listed15 events — show timeline
- 2026-06-05 Listed $284,900 Stellar MLS as Distributed by MLS Grid
- 2025-09-21 Rental Removed $1,975 TENANTTURNER2
- 2025-09-11 Price Changed $1,975 TENANTTURNER2
- 2025-08-09 Price Changed $1,995 TENANTTURNER2
- 2025-08-08 Listed for Rent $2,175 TENANTTURNER2
- 2025-05-19 Sold (Public Records) $215,000 Public Records
- 2025-05-16 Sold (MLS) $215,000 Stellar MLS as Distributed by MLS Grid
- 2025-04-09 Pending — Stellar MLS as Distributed by MLS Grid
- 2025-04-02 Listed $350,000 Stellar MLS as Distributed by MLS Grid
- 2017-06-05 Sold (Public Records) $160,000 Public Records
- 2017-05-23 Sold (MLS) $160,000 Stellar MLS as Distributed by MLS Grid
- 2017-04-15 Pending — Stellar MLS as Distributed by MLS Grid
- 2017-04-11 Price Changed $164,900 Stellar MLS as Distributed by MLS Grid
- 2017-04-03 Listed $169,900 Stellar MLS as Distributed by MLS Grid
- 1990-07-01 Sold (Public Records) $75,500 Public Records
Property tax history
+10.1%/yrLatest (2025): $3,247 · +11.9% YoY. Source: county tax records.
Cash-flow waterfall
monthlySold comps — $/sqft
last 12 mo · ≤1 miLoading sold comps…