 🌊 Lakefront
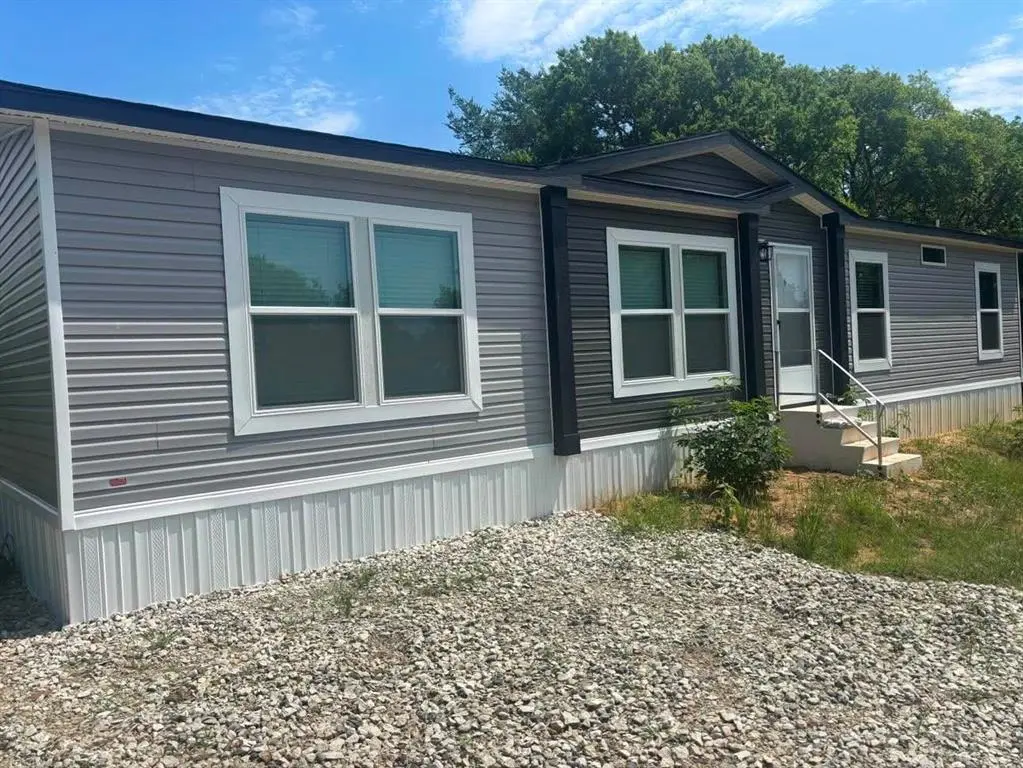
1429 Oak Hill Dr · Seven Points, TX
Flood risk 1/10 · Minimal
- FEMA flood zone
- X (unshaded)
- Chance of flooding over 30 yrs
- 0.0%
- Est. flood insurance / yr
- $507 – $1,088
Fire risk 3/10 · Minor
- Est. fire insurance / yr
- $1,222 – $2,270
Heat risk 7/10 · Major
- Hot days now (above 110°F)
- 7 days/yr
- Hot days in 30 yrs
- 26 days/yr
Wind risk 8/10 · Major
- Chance of severe wind over 30 yrs
- 80.0%
Air-quality risk 2/10 · Minimal
- Unhealthy air days now
- 0 days/yr
- Unhealthy air days in 30 yrs
- 1 days/yr
Risk factors via First Street. Map © Google.
Why this score? — see what drove the C+ grade
The composite is a weighted blend of 9 inputs, each scored 0–100. Each bar is that input's sub-score; the figure is the points it added to the 100-point composite (weight × sub-score).
- Cash flow +27.0/30.0
- DSCR +9.3/10.0
- ARV discount +7.5/15.0
- 1% rule +6.1/10.0
- Livability +3.0/5.0
- Schools +2.6/10.0
- Rent growth +2.5/5.0
- Condition / age +2.5/5.0
- Appreciation +0.0/10.0
$257,900
🖨 Deal sheet 📄 Offer letter ✓ Due diligence
Listing remarks MLS
Discover the potential of this . 60-acre lot in the Pleasant Oak Beach subdivision of Kemp, just minutes from Cedar Creek Lake. Whether you're an investor looking to build a profitable vacation rental or a buyer dreaming of your own lakeside retreat, this property offers the perfect opportunity. With plenty of space to design and create, and close access to the water, this lot is ideal for building a getaway, full-time home, or income-producing property. Don't miss your chance to secure your place near the lake—come see it today!
Key facts
- Farm style sink
- Big island
- Brand new appliances
Tags
Property features AI
Finance
- Other: Lot about 0.612 acre (Assessor); Dock not permitted; Soil type: sandy loam
- Financial info: Listing accepts Cash, FHA, USDA and VA financing; No second mortgage
- HOA & community: No association
Exterior
- Parking: Driveway
- Utilities: City water; City sewer; No municipal utility district
- Home design: Residential mobile home; Single-story; New construction (completed 2025); Attached
- Construction: Built in 2025; New construction — complete
- Exterior features: Lot with few trees; Irregular-shaped lot; Located on Cedar Creek
Interior
- Kitchen: Dishwasher; Electric cooktop; Electric oven; Refrigerator; Kitchen island; Farm sink; Pantry
- Bedrooms: 3 bedrooms (all on the main level); Primary bedroom with dual sinks, garden tub and separate shower
- Bathrooms: 2 full bathrooms
- Heating & cooling: Central air conditioning; Electric heating
- Interior features: Kitchen island; Farm sink; Pantry; Fireplace with blower fan; Open living and dining areas (one living area, one dining area)
- Laundry & utility: Main-level laundry room
Neighborhood map
What this means for you Summary
Snapshot
- This is a 3-bed/2.0-bath manufactured listed at $258k.
Deal economics
- At list price, monthly cash flow is $719 ($9k/yr) — positive.
- The deal already cash-flows at list — no discount required.
- Meets the 1% rule at list price ($3k rent vs $258k).
- Recommended offer: $254k (1.5% below list) — sets the bar for market timing.
- Cap rate 9.6% vs local median 3.1% in Seven Points — top-decile yield for the area; either an underpriced asset or a hidden risk that comps aren't pricing in. Stress-test before assuming the spread holds.
Location & tenants
- Location reads 60/100 on livability (#1,063 in TX) — a middle-class / working-renter tenant base. Strengths: cost of living A+, housing A+, crime B+; Watch: employment D, amenities F, commute F.
- Kemp ISD (rural): math 33% / reading 29% proficiency, ranked #605 of 826 in TX (top 73%) — families likely to look elsewhere, expect single-tenant / working-renter base with shorter leases.
- Zoned schools: Kemp Pri (503 students, 81% FRL) — zoned schools average 81% FRL vs 54% district-wide (27 pts higher); higher-poverty schools than district average — tighter screening recommended.
- Market conditions: 440 active listings in the ZIP; 1 comparable units currently listed for rent nearby; 263 units permitted in Henderson County in 2024 (0 in 5+ unit buildings).
Forward outlook
- Local home prices are declining (-3.0%/yr); year-one equity from $2k of loan paydown is wiped out by about $8k of value loss. Plan a longer hold.
- At projected returns (-3.0% appreciation + 3.0% rent growth), your $72k cash investment doubles in ~10 years — after that, you're playing with house money.
Negotiation context
- It's been on market 20 days — a 2% lower offer ($254k) is reasonable based on typical stale-listing flexibility.
- 3 sale attempts with the ask held roughly flat each time — persistent listings suggest the price (not the market) is what's stuck; bring a comps-based counter.
Risks & watch-outs
- Climate carrying-cost: severe wind risk, 80% chance of damaging wind over 30y; extreme-heat days projected 7→26/yr by 2055 (HVAC capex compounding) — expect insurance premiums to compound above CPI over the hold.
Questions for the listing agent
- Is there a deadline driving the sale (1031 exchange, divorce, estate, relocation)? That informs how much negotiation room exists.
- Schools are F-rated, which usually means shorter tenancies and higher turnover. Who's the typical renter profile here, and what's been the actual vacancy rate?
- This sits on a lake — are riparian / water-frontage rights deeded with the parcel? Any dock permits, shoreline easements, or HOA water-use restrictions?
- What's the documented flood / surge / shoreline-erosion history here (FEMA AND non-FEMA — e.g., storm surge, creek backup, septic-field saturation)?
- Any water-quality or seasonal algae-bloom issues that affect tenant satisfaction or short-term-rental demand?
- What's the average days-on-market for RENTAL listings here right now (not sales)? A rising rental-DOM trend means longer vacancies and softer asking-rent achievability than the comps imply.
- What's the recent tenant-quality profile in this submarket — average credit score on applications, eviction rate, late-payment / NSF rate, and stable-employment percentage? A property-management company in the area should have these aggregated.
- How much new for-sale + rental construction is in the pipeline within 1–3 miles? Heavy new supply typically softens prices + rents 12–24 months out; constrained supply supports both.
Investment metrics
- 1% rule
- 1.11% ✓
- Cap rate
- 9.64%
- Cash-on-cash
- 11.96%
- DSCR
- 1.53
- GRM
- 7.5
CMA / ARV
- ARV (on-the-fly)
- $66,976
- Comps found
- 1
Show comp detail 1 sale within ~0.75 mi
| Address | Dist | Beds/Ba | Sqft | Sold | Price | $/sf | Match |
|---|---|---|---|---|---|---|---|
| 1040 Red Bird | 0.57mi | 4/2.0 (+1) | 1,400 (-4%) | 13mo | $65,000 | $46 | 51 |
Match score weights: distance 35% · size 25% · config 20% · recency 20%. Top-matched comps best support the ARV.
Projected returns pro-forma
-3.0% appreciation · 3.0% rent growth · sell at horizon
- IRR
- 1.4%
- Equity multiple
- 1.05×
- Total profit
- $3,922
- Equity at exit
- $38,454
- IRR
- 11.0%
- Equity multiple
- 1.86×
- Total profit
- $61,971
- Equity at exit
- $22,298
Cash invested: $72,212 (down + closing). Projections, not guarantees.
Landlord ↔ Tenant lean methodology
- Overall (STATE)
- 87 Strongly Landlord-Friendly
- State Texas
- 87 Strongly Landlord-Friendly · R+5
- County
- — inherits STATE
- City
- — inherits STATE
ZIP-level market 75143
- Home prices YoY
- -11.4%
- Active inventory
- 440
- Price-to-rent
- 7.5×
Monthly cashflow live
- Estimated rent
- $2,850 medium interval (Pro) →
- Mortgage (P&I)
- −$1,352
- Tax from tax record
- −$72 /mo · $865/yr
- Insurance
- −$107
- HOA
- −$0
- Vacancy / Maint / Mgmt
- −$598
- Net cashflow
- $719
Break-even live
UW: 25.0% down · 7.5% · 30yr · 1.5% tax · 5.0% vac · 8.0% maint · 8.0% mgmt
Financing live
Cash to close
- Down payment
- $64,475
- Closing costs
- $7,737
- Reserves months
- —
- Total cash needed
- —
Loan-product check · same deal, 3 products live
Conventional
25% down · 7.5% · 30yr
- Down + closing
- —
- Monthly P&I
- —
- Monthly cashflow
- —
- DSCR
- —
- Eligible?
- —
Personal DTI + credit; lowest rate.
DSCR
20% down · 8.5% · 30yr
- Down + closing
- —
- Monthly P&I
- —
- Monthly cashflow
- —
- DSCR
- —
- Eligible?
- —
No personal income docs; deal must DSCR.
Hard money
10% down · 12.0% · 12mo
- Down + closing
- —
- Monthly P&I
- —
- Monthly cashflow
- —
- DSCR
- —
- Eligible?
- —
Short-term bridge; refi at stabilization.
Rent comps 1 comps
| Address | Beds | Baths | Sqft | Rent | $/sqft | DOM | Units | Dist |
|---|---|---|---|---|---|---|---|---|
| 1340 E Cedar Creek Pkwy Kemp, TX | 3.0 | 2.0 | 1330 | $2,850 | $2.14 | 43d | 1 | 1.12mi |
Listing history 14 events
-
2026-06-18days on market $257,900 Active 20 DOM
-
2026-06-17days on market $257,900 Active 19 DOM
-
2026-06-16days on market $257,900 Active 18 DOM
-
2026-06-15days on market $257,900 Active 17 DOM
-
2026-06-13days on market $257,900 Active 15 DOM
-
2026-06-13days on market $257,900 Active 14 DOM
-
2026-06-09days on market $257,900 Active 11 DOM
-
2026-06-08days on market $257,900 Active 10 DOM
-
2026-06-07days on market $257,900 Active 9 DOM
-
2026-06-04days on market $257,900 Active 6 DOM
-
2026-06-03days on market $257,900 Active 5 DOM
-
2026-06-02days on market $257,900 Active 4 DOM
-
2026-06-01days on market $257,900 Active 3 DOM
-
2026-05-31days on market $257,900 Active 2 DOM
ⓘ Source: listings_history table (triggers on properties + properties_extension) + one-shot
backfill from property_details.listing_events for pre-trigger history.
Tax reassessment forecast TX · Resets to sale price
- Current annual tax
- $865 · $72/mo
- Projected year-2 tax
- $4,720 · $393/mo
- Expected delta
- +$3,854/yr (+$321/mo · 445.4%)
ⓘ Screening estimate from a state-policy table — verify with the county assessor before closing.
Climate risk First Street
- Flood 1/10 Low FEMA zone X (unshaded) · 0% chance over 30 yrs
- Wildfire 3/10 Moderate
- Heat 7/10 Severe 7 d/yr ≥110°F today · 26 d/yr by 30 yrs out
- Wind 8/10 Severe 80% chance of damaging wind over 30 yrs
- Air quality 2/10 Low 0 unhealthy d/yr today · 1 by 30 yrs out
Nearby sold comps map
Loading sold comps map…
Walkable amenities ~0.75 mi
Loading nearby amenities…
Taxation est. · year 1
- Rental income
- $34,200
- − Mortgage interest
- −$14,446
- − Property taxes
- −$865
- − Insurance
- −$1,290
- − Repairs & maintenance
- −$2,736
- − Management
- −$2,736
- − Depreciation
- −$7,503
- Taxable income
- $4,624
- Est. tax owed @ 24.0%
- −$1,110
- After-tax cash flow
- $7,524/yr
For passive investors: Depreciation is non-cash, so a rental often shows a tax loss while cash-flowing — sheltering income. Rental losses are passive: they offset passive income freely, and up to $25,000/yr can offset ordinary (W-2) income if you actively participate and your MAGI is under $100k (phasing out to $0 by $150k); unused losses carry forward. On sale, claimed depreciation is recaptured at up to 25%, and gains may owe capital-gains tax (a 1031 exchange can defer both). Figures are a year-1 estimate at your 24.0% rate — not tax advice; consult a CPA.
Schools (NCES district)
- District
- Kemp ISD
- NCES district ID
- 4825320
- Math proficiency
- 33% ▼ -11.00%
- Reading proficiency
- 29% ▼ -5.00%
- Median HH income
- $42,788
- Composite
- 26.37/100
- National rank
- #7233
- State rank
- #605 of 826 in TX
Livability — Seven Points
- Score
- 60/100
- State rank
- #1063
- US rank
- #18899
Category grades
Schools grade is shown separately in the Schools card above.
Census & demographics
- Population (ZIP)
- 14,676
Population outlook (Henderson County) Hauer SSP2
- Today (2025)
- 80,471 people
- By 2030
- 80,608 · +0.2%
- By 2040
- 80,087 · -0.5%
- By 2050
- 78,208 · -2.8%
- By 2075
- 72,423 · -10.0%
- By 2100
- 61,012 · -24.2%
Race, ethnicity, and origin ACS 2023
- Neighborhood character
- Predominantly White (80%)
- Race & ethnicity
- White 80% Hispanic / Latino 13% Two or more races 8% Black 2%
- Hispanic origin (detail)
- Mexican 13%
- Common ancestry
- Italian 2% Iranian 2% Lithuanian 1%
- Foreign-born
- 4% · Canada, China
- Languages at home
- 90% English-only · Spanish 9%
Political lean MEDSL · Henderson
- 2024 margin
- Solid R (+63.5) · D 18.0% · R 81.4%
- 2008→2024 swing
- -18.8pp toward R · 2008: -44.6pp · 2024: -63.5pp
- All cycles
- 2024: R+63.5 2020: R+60.2 2016: R+60.0 2012: R+54.8 2008: R+44.6
Not yet ingested
- Civics
- —
Market trends
- HPI YoY
- ▼ -42.99%
- Current HPI
- 332.57
- Rent YoY
- —
- Metro
- —
- State GDP YoY
- ▲ 3.95%
- F500 in state
- 110
Industry mix (Fortune 500 HQ in TX)
| Industry | F500 HQs | Revenue |
|---|---|---|
| Energy | 16 | $1,198B |
|
||
| Technology | 5 | $198B |
|
||
| Engineering / Construction | 4 | $72B |
|
||
| Energy Services | 3 | $60B |
|
||
| Utilities | 3 | $41B |
|
||
| Healthcare | 2 | $330B |
|
||
Price history
+759.7% since first listed8 events — show timeline
- 2026-05-29 Listed $257,900 NTREIS
- 2025-11-21 Sold (Public Records) — Public Records
- 2025-11-20 Sold (MLS) — NTREIS
- 2025-11-20 Sold (MLS) — HCBOR
- 2025-09-10 Pending — HCBOR
- 2025-09-10 Pending — NTREIS
- 2025-09-02 Listed $30,000 HCBOR
- 2025-09-02 Listed $30,000 NTREIS
Property tax history
+3.8%/yrLatest (2025): $865 · +18.5% YoY. Source: county tax records.
Cash-flow waterfall
monthlySold comps — $/sqft
last 12 mo · ≤1 miLoading sold comps…