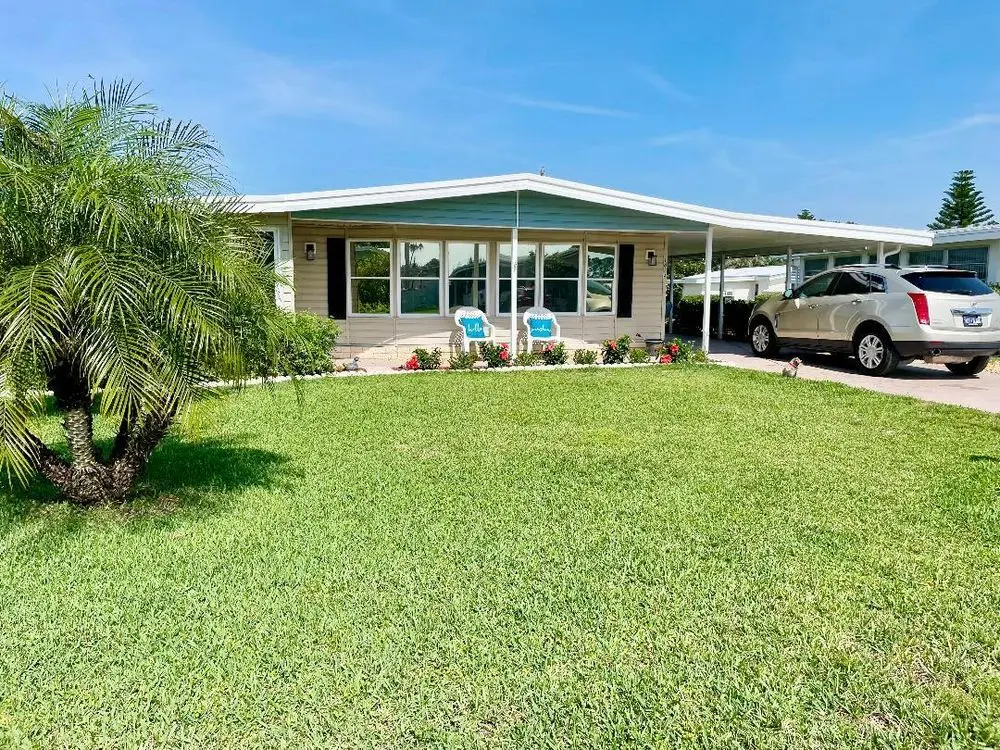
1433 Apache Cir · Tavares, FL
Flood risk 1/10 · Minimal
- FEMA flood zone
- X (unshaded)
- Chance of flooding over 30 yrs
- 0.0%
- Est. flood insurance / yr
- $507 – $1,088
Fire risk 1/10 · Minimal
- Est. fire insurance / yr
- $947 – $1,759
Heat risk 8/10 · Major
- Hot days now (above 108°F)
- 7 days/yr
- Hot days in 30 yrs
- 20 days/yr
Wind risk 9/10 · Severe
- Chance of severe wind over 30 yrs
- 99.0%
Air-quality risk 2/10 · Minimal
- Unhealthy air days now
- 1 days/yr
- Unhealthy air days in 30 yrs
- 1 days/yr
Risk factors via First Street. Map © Google.
Why this score? — see what drove the F grade
The composite is a weighted blend of 9 inputs, each scored 0–100. Each bar is that input's sub-score; the figure is the points it added to the 100-point composite (weight × sub-score).
- Cash flow +12.2/30.0
- Schools +4.2/10.0
- Livability +3.8/5.0
- DSCR +3.6/10.0
- Rent growth +3.5/5.0
- 1% rule +3.3/10.0
- Condition / age +2.5/5.0
- ARV discount +0.0/15.0
- Appreciation +0.0/10.0
$211,000
🖨 Deal sheet 📄 Offer letter ✓ Due diligence
Listing remarks MLS
This Lake Frances Estates beauty is in fantastic condition and ready to occupy. Great community with amenities such as indoor and outdoor swimming pools, recreation center, shuffleboard courts and Lake Frances access. Shopping and dining are just minutes away! An additional 10x20 enclosed family room featuring thermal windows and sunny location make this 1104 SF another 200SF bigger. A spacious light and bright kitchen dining combo make entertaining and meal times a real pleasure. Great floor plan with desirable traffic flow. The oversized washer/dryer room is plenty big for a workshop area. The plumbing and vinyl siding have been replaced. The furnishings are negotiable making this a turn key move in. This home is real pretty outside and in. .. come see it!
Key facts
- Quartz countertops
- New refrigerator
- Fresh landscaping
Tags
Property features AI
Exterior
- Home design: House; 1,306 sq ft living area
- Exterior features: Lot approximately 10,889 sq ft
Neighborhood map
What this means for you Summary
Snapshot
- This is a 2-bed/2.0-bath manufactured listed at $211k.
Deal economics
- At list price, monthly cash flow is $-44 ($-532/yr) — negative.
- To cash-flow at today's rent, offer at most $203k (3.7% below list).
- To meet the 1% rule (rent ≥ 1% of price), the offer needs to be $175k (17.1% below list).
- Recommended offer: $175k (17.1% below list) — sets the bar for 1% rule.
- Cap rate 6.0% vs local median 4.5% in Tavares — top-decile yield for the area; either an underpriced asset or a hidden risk that comps aren't pricing in. Stress-test before assuming the spread holds.
Location & tenants
- Location reads 76/100 on livability (#220 in FL, #3,464 nationally) — a middle-class / working-renter tenant base. Strengths: crime A+, cost of living A+, housing A+; Watch: employment D, amenities F, commute F.
- Lake (suburban): math 49% / reading 50% proficiency, ranked #37 of 73 in FL (top 51%) — families likely to look elsewhere, expect single-tenant / working-renter base with shorter leases.
- Market conditions: Rents rising fast (+4.0%/yr); 501 active listings in the ZIP; 11 comparable units currently listed for rent nearby; rentals at typical pace (median 18d on market — plan ~3-4 weeks tenant-placement turnaround); 4,799 units permitted in Lake County in 2024 (814 in 5+ unit buildings).
- This rent runs 33% of the median local income ($63k/yr) — at the standard rent-burdened threshold; future hikes will face affordability resistance.
Forward outlook
- Local home prices are declining (-3.0%/yr); year-one equity from $1k of loan paydown is wiped out by about $6k of value loss. Plan a longer hold.
- Lake County population projected at +37% by 2050 — long-run rental-demand tailwind backs the buy-and-hold thesis.
Negotiation context
- Only 14 days on market — expect competitive offers; lowballing is unlikely to land.
- 4 sale attempts since 22y ago with the ask held roughly flat each time — persistent listings suggest the price (not the market) is what's stuck; bring a comps-based counter.
- Current owner paid $80k; list at $211k implies a 164% gain — meaningful room to come down on a strong offer.
Risks & watch-outs
- Climate carrying-cost: severe wind risk, 99% chance of damaging wind over 30y; extreme-heat days projected 7→20/yr by 2055 (HVAC capex compounding) — expect insurance premiums to compound above CPI over the hold.
Questions for the listing agent
- What do current leases actually rent for vs. the listed asking? Can we see a recent rent roll and the last 12 months of T-12 income?
- Is there a deadline driving the sale (1031 exchange, divorce, estate, relocation)? That informs how much negotiation room exists.
- The area grade is low — what's the realistic commute time and amenity access for the typical tenant pool here? Any planned neighborhood developments (good or bad) we should know about?
- What's the average days-on-market for RENTAL listings here right now (not sales)? A rising rental-DOM trend means longer vacancies and softer asking-rent achievability than the comps imply.
- What's the recent tenant-quality profile in this submarket — average credit score on applications, eviction rate, late-payment / NSF rate, and stable-employment percentage? A property-management company in the area should have these aggregated.
- How much new for-sale + rental construction is in the pipeline within 1–3 miles? Heavy new supply typically softens prices + rents 12–24 months out; constrained supply supports both.
Investment metrics
- 1% rule
- 0.83% ✗
- Cap rate
- 6.04%
- Cash-on-cash
- -0.90%
- DSCR
- 0.96
- GRM
- 10.1
CMA / ARV
- ARV (on-the-fly)
- $152,352
- Comps found
- 9
Show comp detail 9 sales within ~0.75 mi
| Address | Dist | Beds/Ba | Sqft | Sold | Price | $/sf | Match |
|---|---|---|---|---|---|---|---|
| 1424 Mohawk Cir | 0.08mi | 2/2.0 | 1,160 (+5%) | 2mo | $195,000 | $168 | 86 |
| 1024 Capella Dr | 0.24mi | 2/2.0 | 1,104 (0%) | 4mo | $55,000 | $50 | 85 |
| 1408 Skyline Ct | 0.09mi | 2/2.0 | 1,144 (+4%) | 8mo | $92,000 | $80 | 83 |
| 1681 Elkhart Cir | 0.22mi | 2/2.0 | 1,125 (+2%) | 7mo | $172,000 | $153 | 81 |
| 1209 Apache Cir | 0.15mi | 2/2.0 | 1,152 (+4%) | 9mo | $128,000 | $111 | 78 |
| 1437 Mohawk Cir | 0.14mi | 2/2.0 | 1,248 (+13%) | 1mo | $172,500 | $138 | 71 |
| 1687 Elkhart Cir | 0.24mi | 2/2.0 | 1,000 (-9%) | 6mo | $160,000 | $160 | 68 |
| 1528 Schult Ct | 0.13mi | 2/2.0 | 1,248 (+13%) | 6mo | $170,000 | $136 | 67 |
| 1156 Capella Dr | 0.24mi | 2/2.0 | 1,248 (+13%) | 11mo | $184,900 | $148 | 58 |
Match score weights: distance 35% · size 25% · config 20% · recency 20%. Top-matched comps best support the ARV.
Projected returns pro-forma
-3.0% appreciation · 4.05% rent growth · sell at horizon
- IRR
- -16.6%
- Equity multiple
- 0.41×
- Total profit
- $-35,140
- Equity at exit
- $31,461
- IRR
- -6.7%
- Equity multiple
- 0.55×
- Total profit
- $-26,383
- Equity at exit
- $18,243
Cash invested: $59,080 (down + closing). Projections, not guarantees.
Landlord ↔ Tenant lean methodology
- Overall (STATE)
- 87 Strongly Landlord-Friendly
- State Florida
- 87 Strongly Landlord-Friendly · R+3
- County
- — inherits STATE
- City
- — inherits STATE
ZIP-level market 32778
- Home prices YoY
- -23.4%
- Rents YoY
- 4.0%
- Active inventory
- 501
- Price-to-rent
- 10.1×
Monthly cashflow live
- Estimated rent
- $1,749 high interval (Pro) →
- Mortgage (P&I)
- −$1,107
- Tax from tax record
- −$231 /mo · $2,775/yr
- Insurance
- −$88
- HOA
- −$0
- Vacancy / Maint / Mgmt
- −$367
- Net cashflow
- $-44
Break-even live
UW: 25.0% down · 7.5% · 30yr · 1.5% tax · 5.0% vac · 8.0% maint · 8.0% mgmt
Financing live
Cash to close
- Down payment
- $52,750
- Closing costs
- $6,330
- Reserves months
- —
- Total cash needed
- —
Loan-product check · same deal, 3 products live
Conventional
25% down · 7.5% · 30yr
- Down + closing
- —
- Monthly P&I
- —
- Monthly cashflow
- —
- DSCR
- —
- Eligible?
- —
Personal DTI + credit; lowest rate.
DSCR
20% down · 8.5% · 30yr
- Down + closing
- —
- Monthly P&I
- —
- Monthly cashflow
- —
- DSCR
- —
- Eligible?
- —
No personal income docs; deal must DSCR.
Hard money
10% down · 12.0% · 12mo
- Down + closing
- —
- Monthly P&I
- —
- Monthly cashflow
- —
- DSCR
- —
- Eligible?
- —
Short-term bridge; refi at stabilization.
Rent comps 11 comps
| Address | Beds | Baths | Sqft | Rent | $/sqft | DOM | Units | Dist |
|---|---|---|---|---|---|---|---|---|
| 1105 N Rockingham Ave Tavares, FL | 2.0 | 2.0 | 806 | $1,650 | $2.05 | 5d | 1 | 0.37mi |
| 807 McLain Ct Tavares, FL | 2.0 | 2.0 | 1104 | $1,700 | $1.54 | 16d | 1 | 0.52mi |
| 2225 Cypress Ct Unit 2C Tavares, FL | 2.0 | 2.0 | 1334 | $2,000 | $1.50 | 24d | 1 | 0.62mi |
| 542 E Caroline St Tavares, FL | 2.0 | 1.0 | 812 | $1,400 | $1.72 | 24d | 1 | 0.68mi |
| 743 E Alfred St Tavares, FL | 2.0 | 1.0 | 1000 | $1,450 | $1.45 | 24d | 1 | 0.71mi |
| 380 Dora Ave Tavares, FL | 2.0 | 1.0 | 750 | $1,399 | $1.87 | 14d | 1 | 0.73mi |
| 1632 Tudor Ln Unit 1632 Tavares, FL | 2.0 | 2.0 | 1047 | $1,595 | $1.52 | 17d | 1 | 0.73mi |
| 1403 E Alfred St Unit 200 Tavares, FL | 2.0 | 1.5 | 1000 | $2,000 | $2.00 | 17d | 1 | 0.92mi |
| 2420 Ann Rou Rd Unit 201 Tavares, FL | 1.0 | 1.0 | 1000 | $1,555 | $1.55 | 17d | 1 | 1.19mi |
| 123 N Lake Ave Tavares, FL | 2.0 | 1.0 | 1120 | $1,595 | $1.42 | 24d | 1 | 1.22mi |
| 2460 Ann Rou Rd Unit 606 Tavares, FL | 2.0 | 2.0 | 1167 | $1,750 | $1.50 | 17d | 1 | 1.30mi |
Listing history 10 events
-
2026-06-18days on market $211,000 Active 14 DOM
-
2026-06-17days on market $211,000 Active 13 DOM
-
2026-06-16days on market $211,000 Active 12 DOM
-
2026-06-15days on market $211,000 Active 11 DOM
-
2026-06-13days on market $211,000 Active 9 DOM
-
2026-06-09days on market $211,000 Active 5 DOM
-
2026-06-08days on market $211,000 Active 4 DOM
-
2026-06-07days on market $211,000 Active 3 DOM
-
2026-06-04remarks 699-char remark
-
2026-06-04$211,000 Active 1 DOM
ⓘ Source: listings_history table (triggers on properties + properties_extension) + one-shot
backfill from property_details.listing_events for pre-trigger history.
Tax reassessment forecast FL · Resets to sale price
- Current annual tax
- $2,775 · $231/mo
- Projected year-2 tax
- $2,775 · $231/mo
- Expected delta
- $0/yr ($0/mo · 0.0%)
ⓘ Screening estimate from a state-policy table — verify with the county assessor before closing.
Climate risk First Street
- Flood 1/10 Low FEMA zone X (unshaded) · 0% chance over 30 yrs
- Wildfire 1/10 Low
- Heat 8/10 Severe 7 d/yr ≥108°F today · 20 d/yr by 30 yrs out
- Wind 9/10 Extreme 99% chance of damaging wind over 30 yrs
- Air quality 2/10 Low 1 unhealthy d/yr today · 1 by 30 yrs out
Nearby sold comps map
Loading sold comps map…
Walkable amenities ~0.75 mi
Loading nearby amenities…
Taxation est. · year 1
- Rental income
- $20,982
- − Mortgage interest
- −$11,819
- − Property taxes
- −$2,775
- − Insurance
- −$1,055
- − Repairs & maintenance
- −$1,679
- − Management
- −$1,679
- − Depreciation
- −$6,138
- Taxable loss
- −$4,162
- Est. tax savings @ 24.0%
- +$999
- After-tax cash flow
- $467/yr
For passive investors: Depreciation is non-cash, so a rental often shows a tax loss while cash-flowing — sheltering income. Rental losses are passive: they offset passive income freely, and up to $25,000/yr can offset ordinary (W-2) income if you actively participate and your MAGI is under $100k (phasing out to $0 by $150k); unused losses carry forward. On sale, claimed depreciation is recaptured at up to 25%, and gains may owe capital-gains tax (a 1031 exchange can defer both). Figures are a year-1 estimate at your 24.0% rate — not tax advice; consult a CPA.
Schools (NCES district)
- District
- Lake
- NCES district ID
- 1201050
- Math proficiency
- 49% ▼ -7.00%
- Reading proficiency
- 50% ▼ -4.00%
- Median HH income
- $46,632
- Composite
- 42.05/100
- National rank
- #3327
- State rank
- #37 of 73 in FL
Livability — Tavares
- Score
- 76/100
- State rank
- #220
- US rank
- #3464
Category grades
Schools grade is shown separately in the Schools card above.
Census & demographics
- Census place
- Tavares, FL
- County
- Lake County · 364,602 people
- City population
- 25,042
- Metro
- Orlando-Kissimmee-Sanford, FL
- Population (ZIP)
- 25,042
- Household income
- $63,472
- Rent vs Own
- Severe rent burden
- 586.0
Population outlook (Lake County) Hauer SSP2
- Today (2025)
- 386,640 people
- By 2030
- 417,107 · +7.9%
- By 2040
- 476,676 · +23.3%
- By 2050
- 531,296 · +37.4%
- By 2075
- 648,303 · +67.7%
- By 2100
- 698,530 · +80.7%
Race, ethnicity, and origin ACS 2023
- Neighborhood character
- Predominantly White (72%)
- Race & ethnicity
- White 72% Hispanic / Latino 14% Two or more races 8% Black 8% Asian 2%
- Hispanic origin (detail)
- Mexican 1% Puerto Rican 7% Cuban 2% Dominican 1%
- Common ancestry
- Romanian 4% Italian 3% Slovak 2%
- Foreign-born
- 9% · Canada, Dominican Republic, Jamaica
- Languages at home
- 85% English-only · Spanish 11% Other Indo-European 2% Other Asian/Pacific 1%
Political lean MEDSL · Lake
- 2024 margin
- Strong R (+24.7) · D 37.3% · R 62.0%
- 2008→2024 swing
- -11.2pp toward R · 2008: -13.5pp · 2024: -24.7pp
- All cycles
- 2024: R+24.7 2020: R+20.0 2016: R+23.1 2012: R+17.1 2008: R+13.5
Not yet ingested
- Civics
- —
Market trends
- HPI YoY
- ▼ -88.07%
- Current HPI
- 288.7123
- Rent YoY
- ▲ 4.05%
- Metro
- Orlando-Kissimmee-Sanford, FL
- State GDP YoY
- ▲ 3.28%
- F500 in state
- 36
Industry mix (Fortune 500 HQ in FL)
| Industry | F500 HQs | Revenue |
|---|---|---|
| Industrial Technology | 2 | $29B |
|
||
| Insurance | 2 | $17B |
|
||
| Retail | 1 | $60B |
|
||
| Technology Distribution | 1 | $58B |
|
||
| Homebuilding | 1 | $35B |
|
||
| Technology Manufacturing | 1 | $35B |
|
||
Price history
+234.9% since first listed13 events — show timeline
- 2026-06-04 Listed $211,000 ForSaleByOwner.com
- 2016-05-04 Sold (Public Records) $80,000 Public Records
- 2016-05-03 Sold (MLS) $80,000 Stellar MLS as Distributed by MLS Grid
- 2016-04-19 Pending — Stellar MLS as Distributed by MLS Grid
- 2016-03-16 Contingent — Stellar MLS as Distributed by MLS Grid
- 2016-03-01 Listed $78,500 Stellar MLS as Distributed by MLS Grid
- 2013-10-23 Sold (Public Records) $55,000 Public Records
- 2013-10-21 Sold (MLS) $55,000 Stellar MLS as Distributed by MLS Grid
- 2013-07-29 Listed $62,000 Stellar MLS as Distributed by MLS Grid
- 2005-01-25 Sold (Public Records) $71,000 Public Records
- 2005-01-14 Sold (MLS) $71,000 Stellar MLS as Distributed by MLS Grid
- 2004-11-11 Listed $74,900 Stellar MLS as Distributed by MLS Grid
- 2003-08-06 Sold (Public Records) $63,000 Public Records
Property tax history
+17.2%/yrLatest (2025): $2,775 · +12.8% YoY. Source: county tax records.
Cash-flow waterfall
monthlySold comps — $/sqft
last 12 mo · ≤1 miLoading sold comps…