 🏷️ Likely Rental
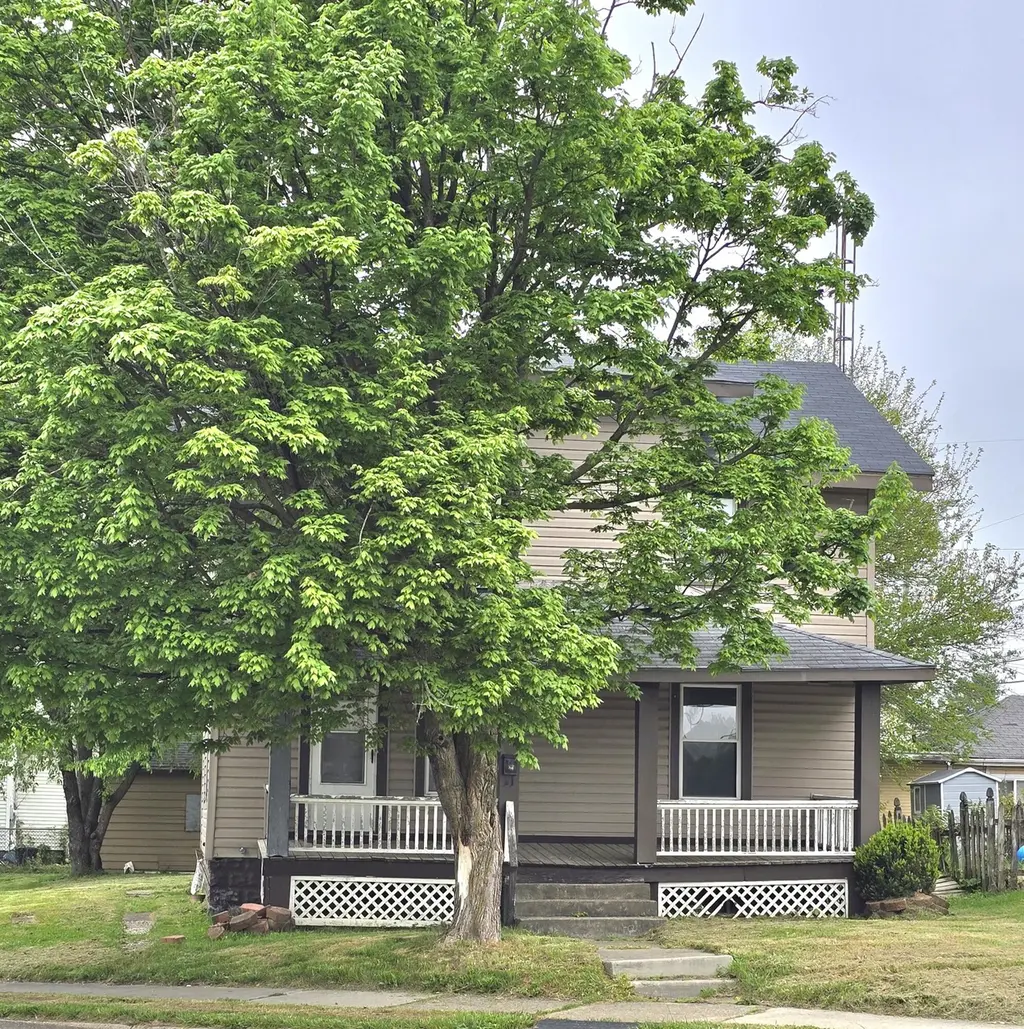
826 N Belmont Ave · Springfield, OH
Flood risk 1/10 · Minimal
- FEMA flood zone
- X (unshaded)
- Chance of flooding over 30 yrs
- 0.0%
- Est. flood insurance / yr
- $473 – $860
Fire risk 1/10 · Minimal
- Est. fire insurance / yr
- $713 – $1,323
Heat risk 3/10 · Minor
- Hot days now (above 100°F)
- 7 days/yr
- Hot days in 30 yrs
- 18 days/yr
Wind risk 2/10 · Minimal
- Chance of severe wind over 30 yrs
- —
Air-quality risk 3/10 · Minor
- Unhealthy air days now
- 2 days/yr
- Unhealthy air days in 30 yrs
- 3 days/yr
Risk factors via First Street. Map © Google.
Why this score? — see what drove the B- grade
The composite is a weighted blend of 9 inputs, each scored 0–100. Each bar is that input's sub-score; the figure is the points it added to the 100-point composite (weight × sub-score).
- Cash flow +25.8/30.0
- ARV discount +15.0/15.0
- DSCR +8.6/10.0
- 1% rule +6.6/10.0
- Livability +2.8/5.0
- Rent growth +2.5/5.0
- Condition / age +2.5/5.0
- Schools +1.9/10.0
- Appreciation +0.0/10.0
$99,900
🖨 Deal sheet 📄 Offer letter ✓ Due diligence
Listing remarks
Great investment property or live much cheaper than rent! Current owner was getting $875 a month from previous tenant, but home is currently vacant. 3 bedrooms, 1 bath home with detached 1 car garage. Large front porch, full basement and some updated windows on the main level. The home comes an extra parcel 64000700023107001 Located close to the East Main Street shopping and restaurants. Home is being sold as is.
Key facts
- Close to restaurants
- Extra parcel
- Large front porch
Tags
Property features AI
Exterior
- Parking: Attached garage with 1 parking space
- Utilities: Public sewer; Natural gas connected; Water supplied
- Home design: Single family residence; Residential property; Built in 1913
- Construction: Vinyl siding; Shingle roof
- Exterior features: Porch; Residential lot
Interior
- Kitchen: Kitchen (13 x 10); Gas water heater
- Bedrooms: Bedroom 1 (13 x 11); Bedroom 2 (16 x 9); Bedroom 3 (13 x 7)
- Flooring: Wood flooring
- Bathrooms: 1 full bathroom
- Heating & cooling: Forced air heating; Natural gas
- Interior features: Full basement; 6 total rooms
- Laundry & utility: Gas water heater
Neighborhood map
What this means for you Summary
Snapshot
- This is a 3-bed/1.0-bath single-family listed at $100k.
Deal economics
- At list price, monthly cash flow is $243 ($3k/yr) — positive.
- The deal already cash-flows at list — no discount required.
- Meets the 1% rule at list price ($1k rent vs $100k).
- Recommended offer: $97k (3.0% below list) — sets the bar for market timing.
- Cap rate 9.2% vs local median 4.8% in Springfield — top-decile yield for the area; either an underpriced asset or a hidden risk that comps aren't pricing in. Stress-test before assuming the spread holds.
Location & tenants
- Location reads 56/100 on livability (#1,108 in OH) — a working-class tenant base; expect higher turnover. Strengths: cost of living A+, housing A+; Watch: crime F, amenities F, commute F.
- Springfield City School District (urban): math 20% / reading 27% proficiency, ranked #616 of 656 in OH (top 94%) — low school quality limits family demand, transient renter base, plan for 1-2y turnover; 75% free/reduced lunch — lower-income household profile, screen leases tightly.
- Market conditions: 142 active listings in the ZIP; 4 comparable units currently listed for rent nearby; rentals leasing fast (median 11d on market — plan ~1-2 weeks tenant-placement turnaround); 232 units permitted in Clark County in 2024 (116 in 5+ unit buildings).
Forward outlook
- Local home prices are declining (-3.0%/yr); year-one equity from $691 of loan paydown is wiped out by about $3k of value loss. Plan a longer hold.
- Clark County population projected at -16% by 2050 — secular population decline; favor cash flow + early exit over multi-decade hold.
Negotiation context
- It's been on market 55 days — a 3% lower offer ($97k) is reasonable based on typical stale-listing flexibility.
- 5 sale attempts since 18y ago; this cycle's ask has dropped $10k (9%) from the opening price — seller is motivated, your offer sets the floor, not the list.
- Current owner paid $20k; list at $100k implies a 400% gain — meaningful room to come down on a strong offer.
Risks & watch-outs
- Watch-outs: built in 1913 — expect roof / HVAC / electrical / plumbing capex.
Questions for the listing agent
- It's been on market 55 days. Have you received any prior offers? Is the seller open to a 3% concession, seller financing, or rate buy-down credit?
- Built in 1913 — when were the roof, HVAC, electrical panel, plumbing, and water heater last replaced?
- Is there a deadline driving the sale (1031 exchange, divorce, estate, relocation)? That informs how much negotiation room exists.
- Crime grade is F in this area — have there been break-ins, vandalism, or insurance claims at this property in the last 3 years? What carrier currently insures it and at what premium?
- What's the average days-on-market for RENTAL listings here right now (not sales)? A rising rental-DOM trend means longer vacancies and softer asking-rent achievability than the comps imply.
- What's the recent tenant-quality profile in this submarket — average credit score on applications, eviction rate, late-payment / NSF rate, and stable-employment percentage? A property-management company in the area should have these aggregated.
- How much new for-sale + rental construction is in the pipeline within 1–3 miles? Heavy new supply typically softens prices + rents 12–24 months out; constrained supply supports both.
Investment metrics
- 1% rule
- 1.16% ✓
- Cap rate
- 9.22%
- Cash-on-cash
- 10.44%
- DSCR
- 1.46
- GRM
- 7.2
CMA / ARV
- ARV (median comp)
- $133,366
- List price
- $99,900
- Delta
- -25.09%
- Verdict
- UNDERPRICED
- Comps
- 20 within 1.0 mi
Show comp detail 12 sales within ~0.75 mi
| Address | Dist | Beds/Ba | Sqft | Sold | Price | $/sf | Match |
|---|---|---|---|---|---|---|---|
| 801 Bellevue Ave | 0.31mi | 3/1.0 | 1,344 (0%) | 1mo | $169,900 | $126 | 85 |
| 107 N Clairmont Ave | 0.58mi | 3/1.0 | 1,344 (0%) | 1mo | $170,000 | $126 | 72 |
| 2020 Woodside Ave | 0.10mi | 3/2.0 | 1,176 (-12%) | 2mo | $145,000 | $123 | 69 |
| 320 N Clairmont Ave | 0.45mi | 3/1.5 | 1,307 (-3%) | 5mo | $157,000 | $120 | 69 |
| 718 N Florence St | 0.40mi | 2/1.5 (-1) | 1,368 (+2%) | 6mo | $119,900 | $88 | 67 |
| 105 N Clairmont Ave | 0.59mi | 3/2.0 | 1,344 (0%) | 5mo | $190,000 | $141 | 64 |
| 1568 Lagonda Ave | 0.36mi | 2/1.0 (-1) | 1,440 (+7%) | 7mo | $100,000 | $69 | 61 |
| 1703 Highland Ave | 0.61mi | 3/1.0 | 1,273 (-5%) | 3mo | $48,000 | $38 | 60 |
| 1654 Catawba Ave | 0.28mi | 2/1.0 (-1) | 1,145 (-15%) | 1mo | $119,400 | $104 | 56 |
| 1810 Summit St | 0.32mi | 2/2.0 (-1) | 1,188 (-12%) | 4mo | $119,000 | $100 | 54 |
| 129 N Burnett Rd | 0.70mi | 4/1.5 (+1) | 1,455 (+8%) | 1mo | $127,500 | $88 | 46 |
| 1624 Highland Ave | 0.61mi | 3/2.0 | 1,536 (+14%) | 7mo | $122,000 | $79 | 38 |
Match score weights: distance 35% · size 25% · config 20% · recency 20%. Top-matched comps best support the ARV.
Projected returns pro-forma
-3.0% appreciation · 3.0% rent growth · sell at horizon
- IRR
- -0.6%
- Equity multiple
- 0.98×
- Total profit
- $-685
- Equity at exit
- $14,895
- IRR
- 9.0%
- Equity multiple
- 1.69×
- Total profit
- $19,378
- Equity at exit
- $8,638
Cash invested: $27,972 (down + closing). Projections, not guarantees.
Landlord ↔ Tenant lean methodology
- Overall (STATE)
- 73 Landlord-Friendly
- State Ohio
- 73 Landlord-Friendly · R+6
- County
- — inherits STATE
- City
- — inherits STATE
ZIP-level market 45503
- Active inventory
- 142
- Price-to-rent
- 7.2×
Monthly cashflow live
- Estimated rent
- $1,154 medium interval (Pro) →
- Mortgage (P&I)
- −$524
- Tax from tax record
- −$103 /mo · $1,238/yr
- Insurance
- −$42
- HOA
- −$0
- Vacancy / Maint / Mgmt
- −$242
- Net cashflow
- $243
Break-even live
UW: 25.0% down · 7.5% · 30yr · 1.5% tax · 5.0% vac · 8.0% maint · 8.0% mgmt
Financing live
Cash to close
- Down payment
- $24,975
- Closing costs
- $2,997
- Reserves months
- —
- Total cash needed
- —
Loan-product check · same deal, 3 products live
Conventional
25% down · 7.5% · 30yr
- Down + closing
- —
- Monthly P&I
- —
- Monthly cashflow
- —
- DSCR
- —
- Eligible?
- —
Personal DTI + credit; lowest rate.
DSCR
20% down · 8.5% · 30yr
- Down + closing
- —
- Monthly P&I
- —
- Monthly cashflow
- —
- DSCR
- —
- Eligible?
- —
No personal income docs; deal must DSCR.
Hard money
10% down · 12.0% · 12mo
- Down + closing
- —
- Monthly P&I
- —
- Monthly cashflow
- —
- DSCR
- —
- Eligible?
- —
Short-term bridge; refi at stabilization.
Rent comps 4 comps
| Address | Beds | Baths | Sqft | Rent | $/sqft | DOM | Units | Dist |
|---|---|---|---|---|---|---|---|---|
| 127 N Belmont Ave Unit 1 Springfield, OH | 2.0 | 1.0 | 1052 | $1,050 | $1.00 | 1d | 1 | 0.50mi |
| 515 Ludlow Ave Springfield, OH | 3.0 | 1.0 | 1000 | $950 | $0.95 | 43d | 1 | 1.14mi |
| 509 E Northern Ave Unit 511 Springfield, OH | 3.0 | 1.0 | 995 | $995 | $1.00 | 1d | 1 | 1.24mi |
| 401 Section St Springfield, OH | 4.0 | 2.0 | 1612 | $1,850 | $1.15 | 11d | 1 | 1.48mi |
Listing history 30 events
-
2026-06-19days on market $99,900 Active 55 DOM
-
2026-06-18days on market $99,900 Active 54 DOM
-
2026-06-17days on market $99,900 Active 53 DOM
-
2026-06-16days on market $99,900 Active 52 DOM
-
2026-06-15days on market $99,900 Active 51 DOM
-
2026-06-14days on market $99,900 Active 49 DOM
-
2026-06-12days on market $99,900 Active 48 DOM
-
2026-06-09days on market $99,900 Active 45 DOM
-
2026-06-08days on market $99,900 Active 44 DOM
-
2026-06-07days on market $99,900 Active 43 DOM
-
2026-06-05pricedays on market $99,900 Active 40 DOM
-
2026-06-02days on market $109,900 Active 38 DOM
-
2026-06-01days on market $109,900 Active 37 DOM
-
2026-05-31days on market $109,900 Active 36 DOM
-
2026-05-30days on market $109,900 Active 35 DOM
-
2026-04-25$109,900 Active 416-char remark
-
2012-11-30historical
-
2012-11-30historical
-
2012-10-12historical
-
2012-09-01$39,900
-
2012-09-01$39,900
-
2012-09-01$39,900
-
2008-08-25soldstatus $20,000
-
2008-06-30$26,000
-
2007-02-12soldstatus $69,000
-
1993-10-05soldstatus $42,637
-
1991-07-03soldstatus $42,500
-
1989-04-18soldstatus $37,900
-
1987-02-25soldstatus $33,600
-
1986-06-30soldstatus $15,000
ⓘ Source: listings_history table (triggers on properties + properties_extension) + one-shot
backfill from property_details.listing_events for pre-trigger history.
Tax reassessment forecast OH · Partial reset (capped growth)
- Current annual tax
- $1,238 · $103/mo
- Projected year-2 tax
- $1,398 · $117/mo
- Expected delta
- +$160/yr (+$13/mo · 12.9%)
ⓘ Screening estimate from a state-policy table — verify with the county assessor before closing.
Climate risk First Street
- Flood 1/10 Low FEMA zone X (unshaded) · 0% chance over 30 yrs
- Wildfire 1/10 Low
- Heat 3/10 Moderate 7 d/yr ≥100°F today · 18 d/yr by 30 yrs out
- Wind 2/10 Low
- Air quality 3/10 Moderate 2 unhealthy d/yr today · 3 by 30 yrs out
Nearby sold comps map
Loading sold comps map…
Walkable amenities ~0.75 mi
Loading nearby amenities…
Taxation est. · year 1
- Rental income
- $13,854
- − Mortgage interest
- −$5,596
- − Property taxes
- −$1,238
- − Insurance
- −$500
- − Repairs & maintenance
- −$1,108
- − Management
- −$1,108
- − Depreciation
- −$2,906
- Taxable income
- $1,397
- Est. tax owed @ 24.0%
- −$335
- After-tax cash flow
- $2,585/yr
For passive investors: Depreciation is non-cash, so a rental often shows a tax loss while cash-flowing — sheltering income. Rental losses are passive: they offset passive income freely, and up to $25,000/yr can offset ordinary (W-2) income if you actively participate and your MAGI is under $100k (phasing out to $0 by $150k); unused losses carry forward. On sale, claimed depreciation is recaptured at up to 25%, and gains may owe capital-gains tax (a 1031 exchange can defer both). Figures are a year-1 estimate at your 24.0% rate — not tax advice; consult a CPA.
Schools (NCES district)
- District
- Springfield City School District
- NCES district ID
- 3904481
- Math proficiency
- 20% ▼ -16.00%
- Reading proficiency
- 27% ▼ -12.00%
- Median HH income
- $32,541
- Composite
- 19.12/100
- National rank
- #8834
- State rank
- #616 of 656 in OH
Livability — Springfield
- Score
- 56/100
- State rank
- #1108
- US rank
- #22551
Category grades
Schools grade is shown separately in the Schools card above.
Census & demographics
- Census place
- Springfield, OH
- County
- Clark · 134,280 people
- City population
- 33,261
- Metro
- Springfield, OH
- Population (ZIP)
- 32,673
- Household income
- $54,561
- Rent vs Own
- Severe rent burden
- 4.7
Population outlook (Clark County) Hauer SSP2
- Today (2025)
- 130,703 people
- By 2030
- 126,952 · -2.9%
- By 2040
- 118,344 · -9.5%
- By 2050
- 109,590 · -16.2%
- By 2075
- 89,464 · -31.6%
- By 2100
- 68,810 · -47.4%
Race, ethnicity, and origin ACS 2023
- Neighborhood character
- Predominantly White (84%)
- Race & ethnicity
- White 84% Black 9% Two or more races 5% Hispanic / Latino 2%
- Common ancestry
- Italian 2% Lithuanian 1% Slovak 1%
- Foreign-born
- 2% · Canada
- Languages at home
- 98% English-only · French/Haitian/Cajun 1% Spanish 1%
Political lean MEDSL · Clark
- 2024 margin
- Strong R (+29.5) · D 34.8% · R 64.3%
- 2008→2024 swing
- -27.0pp toward R · 2008: -2.5pp · 2024: -29.5pp
- All cycles
- 2024: R+29.5 2020: R+23.3 2016: R+19.5 2012: R+1.8 2008: R+2.5
Not yet ingested
- Civics
- —
Market trends
- HPI YoY
- ▼ -211.92%
- Current HPI
- 257.5694
- Rent YoY
- —
- Metro
- —
- State GDP YoY
- ▲ 1.98%
- F500 in state
- 48
Industry mix (Fortune 500 HQ in OH)
| Industry | F500 HQs | Revenue |
|---|---|---|
| Insurance | 3 | $145B |
|
||
| Industrial Machinery | 3 | $49B |
|
||
| Financial Services | 3 | $24B |
|
||
| Consumer Goods | 2 | $93B |
|
||
| Aerospace / Defense | 2 | $47B |
|
||
| Utilities | 2 | $33B |
|
||
Price history
+566.0% since first listed16 events — show timeline
- 2026-06-04 Price Changed $99,900 WRIST
- 2026-04-25 Listed $109,900 WRIST
- 2012-11-30 Listing Removed — WRIST
- 2012-11-30 Listing Removed — Dayton MLS
- 2012-10-12 Listing Removed — CBRMLS
- 2012-09-01 Listed $39,900 CBRMLS
- 2012-09-01 Listed $39,900 WRIST
- 2012-09-01 Listed $39,900 Dayton MLS
- 2008-08-25 Sold (MLS) $20,000 WRIST
- 2008-06-30 Listed $26,000 WRIST
- 2007-02-12 Sold (Public Records) $69,000 Public Records
- 1993-10-05 Sold (Public Records) $42,637 Public Records
- 1991-07-03 Sold (Public Records) $42,500 Public Records
- 1989-04-18 Sold (Public Records) $37,900 Public Records
- 1987-02-25 Sold (Public Records) $33,600 Public Records
- 1986-06-30 Sold (Public Records) $15,000 Public Records
Property tax history
+4.0%/yrLatest (2025): $1,238 · +38.9% YoY. Source: county tax records.
Cash-flow waterfall
monthlySold comps — $/sqft
last 12 mo · ≤1 miLoading sold comps…