1216 Sholar Ave · Chattanooga, TN
Flood risk 10/10 · Severe
- FEMA flood zone
- X (shaded)
- Chance of flooding over 30 yrs
- 0.99%
- Est. flood insurance / yr
- $507 – $1,088
Fire risk 3/10 · Minor
- Est. fire insurance / yr
- $949 – $1,763
Heat risk 6/10 · Moderate
- Hot days now (above 104°F)
- 7 days/yr
- Hot days in 30 yrs
- 19 days/yr
Wind risk 4/10 · Minor
- Chance of severe wind over 30 yrs
- 10.0%
Air-quality risk 4/10 · Minor
- Unhealthy air days now
- 3 days/yr
- Unhealthy air days in 30 yrs
- 4 days/yr
Risk factors via First Street. Map © Google.
Why this score? — see what drove the B+ grade
The composite is a weighted blend of 9 inputs, each scored 0–100. Each bar is that input's sub-score; the figure is the points it added to the 100-point composite (weight × sub-score).
- Cash flow +30.0/30.0
- ARV discount +15.0/15.0
- 1% rule +10.0/10.0
- DSCR +10.0/10.0
- Livability +3.9/5.0
- Rent growth +3.8/5.0
- Schools +2.7/10.0
- Condition / age +2.2/5.0
- Appreciation +0.0/10.0
$90,000
🖨 Deal sheet (PDF) 📄 Offer letter ✓ Due diligence
Listing remarks
Excellent investment opportunity in a rapidly growing area with new construction nearby. Formerly configured as a duplex and currently functioning as a single-family residence, this property offers spacious living areas or future income-producing opportunities. Buyer to verify zoning, permits and intended use. Contents in the house are to be transferred with the property. Some repairs needed. Seller will consider best offer. Only one electrical meter. Several offers have been received. Seller has requested highest and best offer due Friday, 5/22 at 5:00 p. m.
Key facts
- 5,320 sq ft lot
- Built 1964
- Listed 10 days
Property features AI
Finance
- Other: Located in the Bauml Joe Resub subdivision
Exterior
- Parking: Driveway
- Utilities: Public water; Public sewer; Electricity available
- Home design: Single-family residence (Residential property); 1,456 above-grade finished area
- Construction: Brick construction; Block foundation; Built on a 0.12-acre lot
- Exterior features: No notable exterior features listed; 40 x 133 lot dimensions
Interior
- Bathrooms: 2 full bathrooms; 1 half bathroom
- Heating & cooling: Electric cooling
- Interior features: 7 total rooms
Neighborhood map
What this means for you Summary
Snapshot
- This is a 3-bed/2.5-bath single-family listed at $90k. Condition is rated fair.
Deal economics
- At list price, monthly cash flow is $722 ($9k/yr) — positive.
- The deal already cash-flows at list — no discount required.
- Meets the 1% rule at list price ($2k rent vs $90k).
- Cap rate 16.8% vs local median 3.4% in Chattanooga — top-decile yield for the area; either an underpriced asset or a hidden risk that comps aren't pricing in. Stress-test before assuming the spread holds.
Location & tenants
- Location reads 78/100 on livability (#3 in TN, #2,582 nationally) — a middle-class / working-renter tenant base. Strengths: amenities A+, commute A+, cost of living A+; Watch: employment D+, crime F.
- Hamilton County (urban): math 31% / reading 31% proficiency, ranked #42 of 139 in TN (top 30%) — families likely to look elsewhere, expect single-tenant / working-renter base with shorter leases.
- Zoned schools: Orchard Knob Elementary (math 12% / reading 2%, grade F, #863 of 952 statewide, top 92%, 477 students, 0% FRL); Orchard Knob Middle (math 5% / reading 6%, grade F, #291 of 333 statewide, top 88%, 334 students, 0% FRL); Brainerd High School (math 2% / reading 12%, grade F, #294 of 332 statewide, top 91%, 635 students, 0% FRL) — zoned schools average 0% FRL vs 52% district-wide (52 pts lower); this property's tenant base skews higher-income than the district average.
- Zoned-school proficiency averages 7% at this address vs 31% district-wide (-24 pts) — the specific schools serving this property underperform the Hamilton County average; the district grade overstates school quality for this exact location.
- Market conditions: Rents rising fast (+5.1%/yr); 130 active listings in the ZIP; 28 comparable units currently listed for rent nearby; rentals at typical pace (median 25d on market — plan ~3-4 weeks tenant-placement turnaround); lower-income renter base — watch delinquency; 2,133 units permitted in Hamilton County in 2024 (405 in 5+ unit buildings).
- At $1,786/mo this rent would consume 48% of the median local household income ($45k/yr) (locally 759% of renters already pay >50% of income on rent) — very limited rent-growth headroom before tenants either downsize or default.
Forward outlook
- Local home prices are declining (-3.0%/yr); year-one equity from $622 of loan paydown is wiped out by about $3k of value loss. Plan a longer hold.
- Hamilton County population projected at +23% by 2050 — long-run rental-demand tailwind backs the buy-and-hold thesis.
- At projected returns (-3.0% appreciation + 5.1% rent growth), your $25k cash investment doubles in ~4 years — after that, you're playing with house money.
Negotiation context
- Only 10 days on market — expect competitive offers; lowballing is unlikely to land.
Risks & watch-outs
- Watch-outs: flood insurance adds $66/mo.
- Climate carrying-cost: severe flood risk; extreme-heat days projected 7→19/yr by 2055 (HVAC capex compounding) — expect insurance premiums to compound above CPI over the hold.
Questions for the listing agent
- Have any recent inspections been done? Can we get a copy of the seller's disclosures and any deferred-maintenance estimates?
- Built in 1964 — when were the roof, HVAC, electrical panel, plumbing, and water heater last replaced?
- What's the actual annual flood-insurance premium (NFIP or private), and is the property in a SFHA with mandatory coverage?
- Is there a deadline driving the sale (1031 exchange, divorce, estate, relocation)? That informs how much negotiation room exists.
- Schools are F-rated, which usually means shorter tenancies and higher turnover. Who's the typical renter profile here, and what's been the actual vacancy rate?
- Crime grade is F in this area — have there been break-ins, vandalism, or insurance claims at this property in the last 3 years? What carrier currently insures it and at what premium?
- What's the average days-on-market for RENTAL listings here right now (not sales)? A rising rental-DOM trend means longer vacancies and softer asking-rent achievability than the comps imply.
- What's the recent tenant-quality profile in this submarket — average credit score on applications, eviction rate, late-payment / NSF rate, and stable-employment percentage? A property-management company in the area should have these aggregated.
- How much new for-sale + rental construction is in the pipeline within 1–3 miles? Heavy new supply typically softens prices + rents 12–24 months out; constrained supply supports both.
Investment metrics
- 1% rule
- 1.98% ✓
- Cap rate
- 16.81%
- Cash-on-cash
- 37.56%
- DSCR
- 2.67
- GRM
- 4.2
CMA / ARV
- ARV (on-the-fly)
- $151,424
- Comps found
- 12
Show comp detail 12 sales within ~0.75 mi
| Address | Dist | Beds/Ba | Sqft | Sold | Price | $/sf | Match |
|---|---|---|---|---|---|---|---|
| 2015 Windsor St | 0.40mi | 3/2.0 | 1,352 (-7%) | 2mo | $115,000 | $85 | 66 |
| 1407 N Orchard Knob Ave | 0.33mi | 4/2.0 (+1) | 1,512 (+4%) | 12mo | $140,000 | $93 | 61 |
| 1907 Cooley St | 0.28mi | 3/2.0 | 1,578 (+8%) | 14mo | $154,000 | $98 | 59 |
| 2001 Sharp St | 0.62mi | 3/2.0 | 1,386 (-5%) | 3mo | $225,000 | $162 | 58 |
| 1812 Newton St | 0.31mi | 4/1.5 (+1) | 1,296 (-11%) | 4mo | $70,000 | $54 | 55 |
| 2001 Camden St | 0.47mi | 3/1.0 | 1,435 (-1%) | 18mo | $95,000 | $66 | 54 |
| 1203 N Chamberlain Ave | 0.72mi | 3/2.5 | 1,550 (+6%) | 2mo | $360,000 | $232 | 54 |
| 2011 Laura St | 0.36mi | 3/1.5 | 1,292 (-11%) | 14mo | $195,000 | $151 | 49 |
| 1806 Ocoee St | 0.46mi | 3/2.0 | 1,280 (-12%) | 9mo | $268,000 | $209 | 48 |
| 1405 Wheeler Ave | 0.69mi | 4/2.0 (+1) | 1,594 (+10%) | 7mo | $153,240 | $96 | 40 |
| 440 Roberts St | 0.66mi | 3/2.5 | 1,281 (-12%) | 18mo | $219,000 | $171 | 34 |
| 2015 Blackford St | 0.74mi | 3/2.0 | 1,248 (-14%) | 17mo | $130,000 | $104 | 25 |
Match score weights: distance 35% · size 25% · config 20% · recency 20%. Top-matched comps best support the ARV.
Projected returns pro-forma
-3.0% appreciation · 5.13% rent growth · sell at horizon
- IRR
- 32.4%
- Equity multiple
- 2.40×
- Total profit
- $35,402
- Equity at exit
- $13,419
- IRR
- 40.7%
- Equity multiple
- 5.25×
- Total profit
- $107,101
- Equity at exit
- $7,782
Cash invested: $25,200 (down + closing). Projections, not guarantees.
Landlord ↔ Tenant lean methodology
- Overall (STATE)
- 87 Strongly Landlord-Friendly
- State Tennessee
- 87 Strongly Landlord-Friendly · R+13
- County
- — inherits STATE
- City
- — inherits STATE
ZIP-level market 37406
- Home prices YoY
- -23.8%
- Rents YoY
- 5.1%
- Active inventory
- 130
- Price-to-rent
- 4.2×
Monthly cashflow live
- Estimated rent
- $1,786 high interval (Pro) →
- Mortgage (P&I)
- −$472
- Tax est. 1.5%
- −$112 /mo · $1,350/yr
- Insurance
- −$38
- Flood insurance flood zone
- −$66 /mo · $798/yr
- HOA
- −$0
- Vacancy / Maint / Mgmt
- −$375
- Net cashflow
- $722
Break-even live
Sensitivity live
| Price | -10% $785 | -5% $753 | +0% $722 | +5% $691 | +10% $660 |
|---|---|---|---|---|---|
| Rent | -10% $581 | -5% $652 | +0% $722 | +5% $793 | +10% $863 |
| Rate | -1.0pp $768 | -0.5pp $745 | base $722 | +0.5pp $699 | +1.0pp $675 |
UW: 25.0% down · 7.5% · 30yr · 1.5% tax · 5.0% vac · 8.0% maint · 8.0% mgmt
Financing live
Cash to close
- Down payment
- $22,500
- Closing costs
- $2,700
- Reserves months
- —
- Total cash needed
- —
Loan-product check · same deal, 3 products live
Conventional
25% down · 7.5% · 30yr
- Down + closing
- —
- Monthly P&I
- —
- Monthly cashflow
- —
- DSCR
- —
- Eligible?
- —
Personal DTI + credit; lowest rate.
DSCR
20% down · 8.5% · 30yr
- Down + closing
- —
- Monthly P&I
- —
- Monthly cashflow
- —
- DSCR
- —
- Eligible?
- —
No personal income docs; deal must DSCR.
Hard money
10% down · 12.0% · 12mo
- Down + closing
- —
- Monthly P&I
- —
- Monthly cashflow
- —
- DSCR
- —
- Eligible?
- —
Short-term bridge; refi at stabilization.
Rent comps 28 comps
| Address | Beds | Baths | Sqft | Rent | $/sqft | DOM | Units | Dist |
|---|---|---|---|---|---|---|---|---|
| 1754 Ocoee St Chattanooga, TN | 3.0 | 1.5 | 1050 | $1,250 | $1.19 | 15d | 1 | 0.41mi |
| 2011 Milne St Unit b Chattanooga, TN | 3.0 | 1.0 | 976 | $1,345 | $1.38 | 15d | 1 | 0.42mi |
| 1409 Bradt St Chattanooga, TN | 3.0 | 1.0 | 960 | $1,275 | $1.33 | 25d | 1 | 0.43mi |
| 1908 Robbins St Chattanooga, TN | 3.0 | 2.0 | 1783 | $1,750 | $0.98 | 15d | 1 | 0.46mi |
| 2009 Camden St Chattanooga, TN | 3.0 | 1.5 | 1148 | $1,450 | $1.26 | 25d | 1 | 0.47mi |
| 2105 Rawlings St Chattanooga, TN | 3.0 | 1.0 | 1064 | $1,300 | $1.22 | 15d | 1 | 0.52mi |
| 709 N Holly St Chattanooga, TN | 3.0 | 2.0 | 1092 | $1,850 | $1.69 | 15d | 1 | 0.52mi |
| 1601 Arlington Ave Chattanooga, TN | 3.0 | 1.0 | 1416 | $1,650 | $1.17 | 15d | 1 | 0.68mi |
| 950 Riverside Dr Chattanooga, TN | 2.0 | 1.0–2.0 | 908 | $2,309 | $2.54 | 15d | 22 | 0.73mi |
| 2001 Garfield St Chattanooga, TN | 4.0 | 2.0 | 1413 | $1,700 | $1.20 | 25d | 1 | 0.80mi |
| 1706 Wheeler Ave Chattanooga, TN | 3.0 | 1.0 | 1317 | $1,625 | $1.23 | 25d | 1 | 0.81mi |
| 1322 District Ln Chattanooga, TN | 2.0 | 1.0–2.0 | 913 | $2,324 | $2.55 | 15d | 25 | 0.83mi |
| 2009 Taylor St Chattanooga, TN | 3.0 | 1.5 | 1800 | $1,950 | $1.08 | 25d | 1 | 0.92mi |
| 226 N Hickory St Chattanooga, TN | 3.0 | 2.0 | 1350 | $1,895 | $1.40 | 23d | 1 | 0.97mi |
| 1905 Ivy St Chattanooga, TN | 4.0 | 3.0 | 1860 | $2,495 | $1.34 | 25d | 1 | 1.02mi |
| 2709 Citico Ave Chattanooga, TN | 2.0–3.0 | 1.0 | 1038 | $1,400 | $1.35 | 25d | 1 | 1.08mi |
| 2111 Oak St Chattanooga, TN | 2.0 | 2.0 | 1100 | $1,595 | $1.45 | 15d | 1 | 1.21mi |
| 2009 McCallie Ave Chattanooga, TN | 2.0 | 2.0 | 1000 | $1,430 | $1.43 | 15d | 1 | 1.22mi |
| 513 Central Ave Chattanooga, TN | 3.0 | 2.0 | 1000 | $1,800 | $1.80 | 25d | 1 | 1.25mi |
| 2400 Crutchfield St Chattanooga, TN | 3.0 | 1.0 | 984 | $1,200 | $1.22 | 23d | 1 | 1.26mi |
| 2420 Vine St Chattanooga, TN | 3.0 | 1.0 | 1260 | $1,800 | $1.43 | 25d | 1 | 1.34mi |
| 2106 Duncan Ave Unit 102 Chattanooga, TN | 3.0 | 2.5 | 1600 | $2,295 | $1.43 | 25d | 1 | 1.34mi |
| 659 Bespoke WAY Chattanooga, TN | 3.0 | 3.0 | 1564 | $2,750 | $1.76 | 25d | 1 | 1.36mi |
| 1705 Bailey Ave Chattanooga, TN | 3.0 | 2.0 | 1632 | $1,850 | $1.13 | 25d | 1 | 1.36mi |
| 756 Bespoke Way Chattanooga, TN | 3.0 | 3.0 | 1510 | $4,000 | $2.65 | 15d | 1 | 1.36mi |
| 2603 Dodson Ave Chattanooga, TN | 4.0 | 1.0 | 1104 | $1,250 | $1.13 | 23d | 1 | 1.40mi |
| 912 Oak St Apt 1 Chattanooga, TN | 2.0 | 2.0 | 1000 | $1,400 | $1.40 | 25d | 1 | 1.41mi |
| 2425 Chamberlain Ave Chattanooga, TN | 3.0 | 2.0 | 1422 | $1,795 | $1.26 | 25d | 1 | 1.50mi |
Listing history 2 events
-
2026-05-23status Pending
-
2026-05-12$90,000 Active
ⓘ Source: listings_history table (triggers on properties + properties_extension) + one-shot
backfill from property_details.listing_events for pre-trigger history.
Climate risk First Street
- Flood 10/10 Extreme FEMA zone X (shaded) · 99% chance over 30 yrs
- Wildfire 3/10 Moderate
- Heat 6/10 Major 7 d/yr ≥104°F today · 19 d/yr by 30 yrs out
- Wind 4/10 Moderate 10% chance of damaging wind over 30 yrs
- Air quality 4/10 Moderate 3 unhealthy d/yr today · 4 by 30 yrs out
Nearby sold comps map
Loading sold comps map…
Walkable amenities ~0.75 mi
Loading nearby amenities…
Taxation est. · year 1
- Rental income
- $21,430
- − Mortgage interest
- −$5,041
- − Property taxes
- −$1,350
- − Insurance
- −$1,248
- − Repairs & maintenance
- −$1,714
- − Management
- −$1,714
- − Depreciation
- −$2,618
- Taxable income
- $7,744
- Est. tax owed @ 24.0%
- −$1,859
- After-tax cash flow
- $6,810/yr
For passive investors: Depreciation is non-cash, so a rental often shows a tax loss while cash-flowing — sheltering income. Rental losses are passive: they offset passive income freely, and up to $25,000/yr can offset ordinary (W-2) income if you actively participate and your MAGI is under $100k (phasing out to $0 by $150k); unused losses carry forward. On sale, claimed depreciation is recaptured at up to 25%, and gains may owe capital-gains tax (a 1031 exchange can defer both). Figures are a year-1 estimate at your 24.0% rate — not tax advice; consult a CPA.
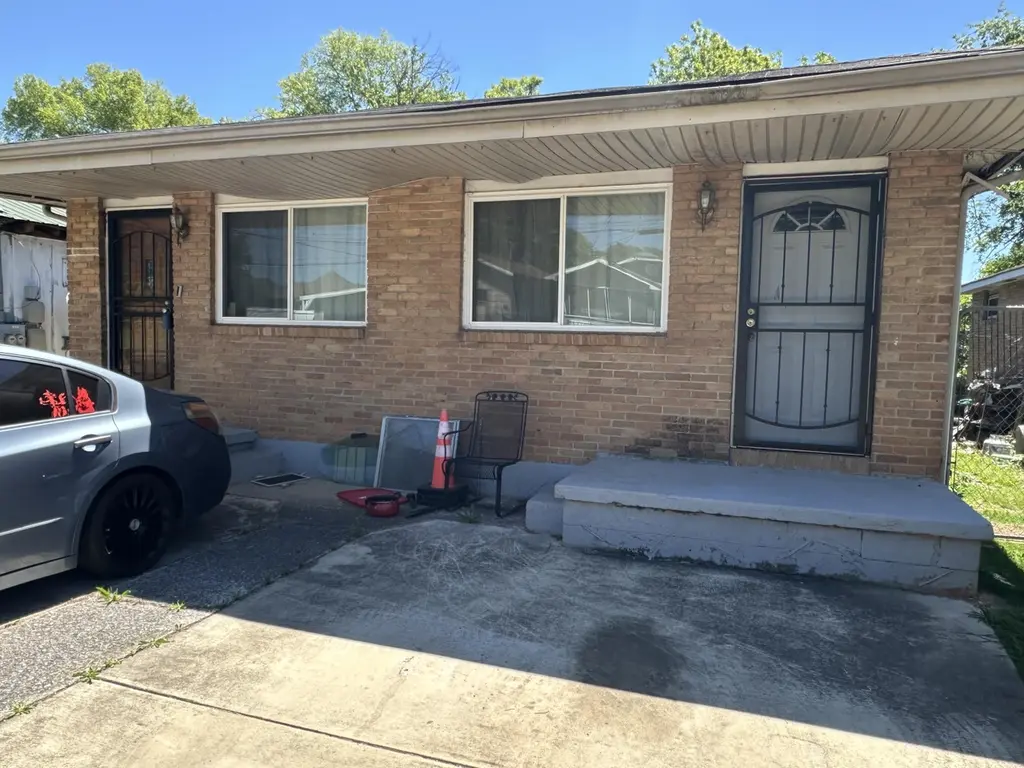
Condition & rehab AI · 2 photos
This property requires moderate renovations, focusing on exterior repairs and maintenance to improve its curb appeal and resale value.
Repairs flagged
- Major Brick facade — Severe weathering and staining
- Major Concrete driveway and steps — Significant wear
Value-add opportunities
- Both Paint exterior — Enhances curb appeal and resale value
- Both Replace windows — Improves energy efficiency and resale value
- Both Upgrade HVAC system — Enhances comfort and reduces utility costs
Renovation cost estimate screening
| Repair item | Severity | Est. cost |
|---|---|---|
| Brick facade · Severe weathering and staining | Major | $15,000–50,000 |
| Concrete driveway and steps · Significant wear | Major | $15,000–50,000 |
| Total estimated repair cost · 2 items | $30,000–100,000 |
Value-add ROI direction
- Both Paint exterior — Enhances curb appeal and resale value ↑
- Both Replace windows — Improves energy efficiency and resale value ↑
- Both Upgrade HVAC system — Enhances comfort and reduces utility costs ↑
ⓘ Cost ranges are severity-bucket heuristics (US national rule-of-thumb). Get contractor quotes + a written scope before underwriting a rehab budget.
Schools (NCES district)
- District
- Hamilton County
- NCES district ID
- 4701590
- Math proficiency
- 31% ▼ -10.00%
- Reading proficiency
- 31% ▼ -3.00%
- Median HH income
- $47,456
- Composite
- 26.8/100
- National rank
- #7122
- State rank
- #42 of 139 in TN
Livability — Chattanooga
- Score
- 78/100
- State rank
- #3
- US rank
- #2582
Category grades
Schools grade is shown separately in the Schools card above.
Census & demographics
- Census place
- Chattanooga, TN
- County
- Hamilton County · 312,777 people
- City population
- 131,999
- Metro
- Chattanooga, TN-GA
- Population (ZIP)
- 13,364
- Household income
- $44,850
- Rent vs Own
- Severe rent burden
- 759.0
Population outlook (Hamilton County) Hauer SSP2
- Today (2025)
- 393,784 people
- By 2030
- 412,983 · +4.9%
- By 2040
- 449,502 · +14.1%
- By 2050
- 484,341 · +23.0%
- By 2075
- 565,746 · +43.7%
- By 2100
- 618,394 · +57.0%
Race, ethnicity, and origin ACS 2023
- Neighborhood character
- Predominantly Black (70%)
- Race & ethnicity
- Black 70% White 21% Hispanic / Latino 6% Two or more races 5%
- Hispanic origin (detail)
- Puerto Rican 1%
- Common ancestry
- Italian 1% Slovak 1%
- Foreign-born
- 5% · Canada
- Languages at home
- 92% English-only · Spanish 6% Other Indo-European 1%
Political lean MEDSL · Hamilton
- 2024 margin
- R (+13.1) · D 42.7% · R 55.7% · Other 1.6%
- 2008→2024 swing
- -1.2pp toward R · 2008: -11.8pp · 2024: -13.1pp
- All cycles
- 2024: R+13.1 2020: R+9.7 2016: R+16.6 2012: R+14.8 2008: R+11.8
Not yet ingested
- Civics
- —
Market trends
- HPI YoY
- ▼ -63.73%
- Current HPI
- 203.5858
- Rent YoY
- ▲ 5.13%
- Metro
- Chattanooga, TN-GA
- State GDP YoY
- ▲ 2.78%
- F500 in state
- 22
Industry mix (Fortune 500 HQ in TN)
| Industry | F500 HQs | Revenue |
|---|---|---|
| Healthcare | 3 | $91B |
|
||
| Retail | 3 | $72B |
|
||
| Transportation / Logistics | 1 | $88B |
|
||
| Paper / Packaging | 1 | $19B |
|
||
| Insurance | 1 | $13B |
|
||
| Energy | 1 | $12B |
|
||
Price history
2 events — show timeline
- 2026-05-23 Pending — GCAR
- 2026-05-12 Listed $90,000 GCAR
Cash-flow waterfall
monthlySold comps — $/sqft
last 12 mo · ≤1 miLoading sold comps…