25 County Road 120 · Moulton, AL
Flood risk 7/10 · Major
- FEMA flood zone
- X (unshaded)
- Chance of flooding over 30 yrs
- 0.99%
- Est. flood insurance / yr
- $507 – $1,088
Fire risk 3/10 · Minor
- Est. fire insurance / yr
- $916 – $1,700
Heat risk 6/10 · Moderate
- Hot days now (above 106°F)
- 7 days/yr
- Hot days in 30 yrs
- 20 days/yr
Wind risk 6/10 · Moderate
- Chance of severe wind over 30 yrs
- 27.0%
Air-quality risk 2/10 · Minimal
- Unhealthy air days now
- 1 days/yr
- Unhealthy air days in 30 yrs
- 1 days/yr
Risk factors via First Street. Map © Google.
Why this score? — see what drove the C+ grade
The composite is a weighted blend of 9 inputs, each scored 0–100. Each bar is that input's sub-score; the figure is the points it added to the 100-point composite (weight × sub-score).
- Cash flow +26.4/30.0
- DSCR +9.0/10.0
- ARV discount +7.5/15.0
- 1% rule +7.1/10.0
- Livability +3.0/5.0
- Rent growth +2.5/5.0
- Condition / age +2.5/5.0
- Schools +2.2/10.0
- Appreciation +0.0/10.0
$80,000
🖨 Deal sheet 📄 Offer letter ✓ Due diligence
Listing remarks
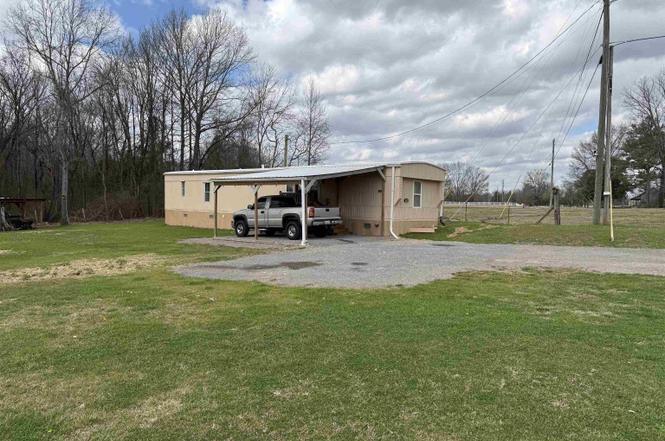
Great location on this 2 bedroom 1 bathroom mobile home sitting on . 30 acres. If you're looking for something out of town but still within quick driving distance then this is the one for you. Attached carport makes for easy covered parking to keep your vehicle out of the weather. Back porch makes for great relaxing time and grilling practical as it is right off the kitchen. All buildings, porches, carports have power ran to them which makes working on things very easy.
Key facts
- Attached carport
- Back porch
- 0.3 acre lot
Tags
Property features AI
Finance
- Other: Property listed as Metes And Bounds
- HOA & community: No association
Exterior
- Parking: Attached carport (1 car); Additional carport; Gravel driveway
- Utilities: Public water; Septic tank
- Home design: Manufactured / Mobile home; One level; Built in 1987; Residential property
- Construction: No fireplaces
- Exterior features: Covered deck; Covered porch; Front porch; Lot approximately 0.3 acres
Interior
- Bathrooms: 1 full bathroom
- Heating & cooling: Propane heating (see remarks); Has heating; Cooling: Other
- Interior features: Crawl space basement; 6 total rooms
Neighborhood map
What this means for you Summary
Snapshot
- This is a 2-bed/1.0-bath manufactured listed at $80k.
Deal economics
- At list price, monthly cash flow is $143 ($2k/yr) — positive.
- The deal already cash-flows at list — no discount required.
- Meets the 1% rule at list price ($965 rent vs $80k).
- Recommended offer: $73k (9.0% below list) — sets the bar for market timing.
- Cap rate 9.4% vs local median 3.5% in Moulton — top-decile yield for the area; either an underpriced asset or a hidden risk that comps aren't pricing in. Stress-test before assuming the spread holds.
Location & tenants
- Location reads 60/100 on livability (#296 in AL) — a middle-class / working-renter tenant base. Strengths: cost of living A+, housing A+; Watch: amenities F, commute F, employment F.
- Lawrence County (rural): math 14% / reading 38% proficiency, ranked #85 of 129 in AL (top 66%) — low school quality limits family demand, transient renter base, plan for 1-2y turnover.
- Zoned schools: Moulton Elementary School (math 32% / reading 53%, grade F, #209 of 627 statewide, top 34%, 644 students, 58% FRL); Moulton Middle School (math 9% / reading 42%, grade F, #158 of 257 statewide, top 63%, 509 students, 65% FRL); Lawrence County High School (math 12% / reading 22%, grade F, #195 of 305 statewide, top 68%, 613 students, 61% FRL).
- Market conditions: 94 active listings in the ZIP; 5 units permitted in Lawrence County in 2024 (0 in 5+ unit buildings).
Forward outlook
- Local home prices are declining (-3.0%/yr); year-one equity from $553 of loan paydown is wiped out by about $2k of value loss. Plan a longer hold.
- Lawrence County population projected at -25% by 2050 — secular population decline; favor cash flow + early exit over multi-decade hold.
Negotiation context
- It's been on market 108 days — a 9% lower offer ($73k) is reasonable based on typical stale-listing flexibility.
- 2 sale attempts with the ask held roughly flat each time — persistent listings suggest the price (not the market) is what's stuck; bring a comps-based counter.
Risks & watch-outs
- Watch-outs: flood insurance adds $66/mo.
- Climate carrying-cost: major flood risk; major wind risk, 27% chance of damaging wind over 30y; extreme-heat days projected 7→20/yr by 2055 (HVAC capex compounding) — expect insurance premiums to compound above CPI over the hold.
Questions for the listing agent
- It's been on market 108 days. Have you received any prior offers? Is the seller open to a 9% concession, seller financing, or rate buy-down credit?
- What's the actual annual flood-insurance premium (NFIP or private), and is the property in a SFHA with mandatory coverage?
- Why hasn't it sold? Are there any deal-killer items the seller is aware of (foundation, flood, title, zoning, code violations)?
- Is there a deadline driving the sale (1031 exchange, divorce, estate, relocation)? That informs how much negotiation room exists.
- Schools are F-rated, which usually means shorter tenancies and higher turnover. Who's the typical renter profile here, and what's been the actual vacancy rate?
- What's the average days-on-market for RENTAL listings here right now (not sales)? A rising rental-DOM trend means longer vacancies and softer asking-rent achievability than the comps imply.
- What's the recent tenant-quality profile in this submarket — average credit score on applications, eviction rate, late-payment / NSF rate, and stable-employment percentage? A property-management company in the area should have these aggregated.
- How much new for-sale + rental construction is in the pipeline within 1–3 miles? Heavy new supply typically softens prices + rents 12–24 months out; constrained supply supports both.
Investment metrics
- 1% rule
- 1.21% ✓
- Cap rate
- 9.44%
- Cash-on-cash
- 11.23%
- DSCR
- 1.50
- GRM
- 6.9
CMA / ARV
No comps found within radius.
Projected returns pro-forma
-3.0% appreciation · 3.0% rent growth · sell at horizon
- IRR
- -4.5%
- Equity multiple
- 0.83×
- Total profit
- $-3,794
- Equity at exit
- $11,928
- IRR
- 5.2%
- Equity multiple
- 1.39×
- Total profit
- $8,656
- Equity at exit
- $6,917
Cash invested: $22,400 (down + closing). Projections, not guarantees.
Landlord ↔ Tenant lean methodology
- Overall (STATE)
- 90 Strongly Landlord-Friendly
- State Alabama
- 90 Strongly Landlord-Friendly · R+15
- County
- — inherits STATE
- City
- — inherits STATE
ZIP-level market 35650
- Home prices YoY
- -23.4%
- Active inventory
- 94
- Price-to-rent
- 6.9×
Monthly cashflow live
- Estimated rent
- $965 medium interval (Pro) →
- Mortgage (P&I)
- −$420
- Tax est. 1.5%
- −$100 /mo · $1,200/yr
- Insurance
- −$33
- Flood insurance flood zone
- −$66 /mo · $798/yr
- HOA
- −$0
- Vacancy / Maint / Mgmt
- −$203
- Net cashflow
- $143
Break-even live
UW: 25.0% down · 7.5% · 30yr · 1.5% tax · 5.0% vac · 8.0% maint · 8.0% mgmt
Financing live
Cash to close
- Down payment
- $20,000
- Closing costs
- $2,400
- Reserves months
- —
- Total cash needed
- —
Loan-product check · same deal, 3 products live
Conventional
25% down · 7.5% · 30yr
- Down + closing
- —
- Monthly P&I
- —
- Monthly cashflow
- —
- DSCR
- —
- Eligible?
- —
Personal DTI + credit; lowest rate.
DSCR
20% down · 8.5% · 30yr
- Down + closing
- —
- Monthly P&I
- —
- Monthly cashflow
- —
- DSCR
- —
- Eligible?
- —
No personal income docs; deal must DSCR.
Hard money
10% down · 12.0% · 12mo
- Down + closing
- —
- Monthly P&I
- —
- Monthly cashflow
- —
- DSCR
- —
- Eligible?
- —
Short-term bridge; refi at stabilization.
Listing history 22 events
-
2026-06-19days on market $80,000 Active 108 DOM
-
2026-06-18days on market $80,000 Active 107 DOM
-
2026-06-17days on market $80,000 Active 106 DOM
-
2026-06-17status $80,000 Active 105 DOM
-
2026-06-16days on market $80,000 Contingent 105 DOM
-
2026-06-15days on market $80,000 Contingent 104 DOM
-
2026-06-14days on market $80,000 Contingent 102 DOM
-
2026-06-13days on market $80,000 Contingent 101 DOM
-
2026-06-10days on market $80,000 Contingent 99 DOM
-
2026-06-09days on market $80,000 Contingent 98 DOM
-
2026-06-08days on market $80,000 Contingent 97 DOM
-
2026-06-07days on market $80,000 Contingent 96 DOM
-
2026-06-05days on market $80,000 Contingent 93 DOM
-
2026-06-02days on market $80,000 Contingent 91 DOM
-
2026-06-01days on market $80,000 Contingent 90 DOM
-
2026-05-31days on market $80,000 Contingent 89 DOM
-
2026-05-30days on market $80,000 Contingent 88 DOM
-
2026-04-06historical Contingent
-
2026-03-03$80,000 Active
-
2026-02-16price $80,000
-
2026-01-09price $85,000
-
2025-12-05$89,900 Active
ⓘ Source: listings_history table (triggers on properties + properties_extension) + one-shot
backfill from property_details.listing_events for pre-trigger history.
Climate risk First Street
- Flood 7/10 Severe FEMA zone X (unshaded) · 99% chance over 30 yrs
- Wildfire 3/10 Moderate
- Heat 6/10 Major 7 d/yr ≥106°F today · 20 d/yr by 30 yrs out
- Wind 6/10 Major 27% chance of damaging wind over 30 yrs
- Air quality 2/10 Low 1 unhealthy d/yr today · 1 by 30 yrs out
Nearby sold comps map
Loading sold comps map…
Walkable amenities ~0.75 mi
Loading nearby amenities…
Taxation est. · year 1
- Rental income
- $11,581
- − Mortgage interest
- −$4,481
- − Property taxes
- −$1,200
- − Insurance
- −$1,198
- − Repairs & maintenance
- −$926
- − Management
- −$926
- − Depreciation
- −$2,327
- Taxable income
- $522
- Est. tax owed @ 24.0%
- −$125
- After-tax cash flow
- $1,592/yr
For passive investors: Depreciation is non-cash, so a rental often shows a tax loss while cash-flowing — sheltering income. Rental losses are passive: they offset passive income freely, and up to $25,000/yr can offset ordinary (W-2) income if you actively participate and your MAGI is under $100k (phasing out to $0 by $150k); unused losses carry forward. On sale, claimed depreciation is recaptured at up to 25%, and gains may owe capital-gains tax (a 1031 exchange can defer both). Figures are a year-1 estimate at your 24.0% rate — not tax advice; consult a CPA.
Schools (NCES district)
- District
- Lawrence County
- NCES district ID
- 0102040
- Math proficiency
- 14% ▼ -25.00%
- Reading proficiency
- 38% ▼ -4.00%
- Median HH income
- $40,669
- Composite
- 21.9/100
- National rank
- #8230
- State rank
- #85 of 129 in AL
Livability — Moulton
- Score
- 60/100
- State rank
- #296
- US rank
- #19034
Category grades
Schools grade is shown separately in the Schools card above.
Census & demographics
- Population (ZIP)
- 13,485
Population outlook (Lawrence County) Hauer SSP2
- Today (2025)
- 30,827 people
- By 2030
- 29,343 · -4.8%
- By 2040
- 26,268 · -14.8%
- By 2050
- 23,052 · -25.2%
- By 2075
- 17,414 · -43.5%
- By 2100
- 13,600 · -55.9%
Race, ethnicity, and origin ACS 2023
- Neighborhood character
- Predominantly White (82%)
- Race & ethnicity
- White 82% Two or more races 8% Black 4% Native American 3% Hispanic / Latino 3%
- Common ancestry
- Slovak 3% Serbian 1% Italian 1%
- Foreign-born
- 1% · Canada
- Languages at home
- 97% English-only · Spanish 3%
Political lean MEDSL · Lawrence
- 2024 margin
- Solid R (+62.3) · D 18.5% · R 80.8%
- 2008→2024 swing
- -34.3pp toward R · 2008: -28.0pp · 2024: -62.3pp
- All cycles
- 2024: R+62.3 2020: R+54.6 2016: R+48.7 2012: R+27.0 2008: R+28.0
Not yet ingested
- Civics
- —
Market trends
- HPI YoY
- ▼ -61.22%
- Current HPI
- 200.4657
- Rent YoY
- —
- Metro
- —
- State GDP YoY
- ▲ 2.94%
- F500 in state
- 4
Industry mix (Fortune 500 HQ in AL)
| Industry | F500 HQs | Revenue |
|---|---|---|
| Financial Services | 1 | $8B |
|
||
| Healthcare | 1 | $5B |
|
||
Price history
-11.0% since first listed5 events — show timeline
- 2026-04-06 Contingent — VMLS
- 2026-03-03 Listed $80,000 VMLS
- 2026-02-16 Price Changed $80,000 VMLS
- 2026-01-09 Price Changed $85,000 VMLS
- 2025-12-05 Listed $89,900 VMLS
Property tax history
+5.8%/yrLatest (2023): $49 · +58.7% YoY. Source: county tax records.
Cash-flow waterfall
monthlySold comps — $/sqft
last 12 mo · ≤1 miLoading sold comps…