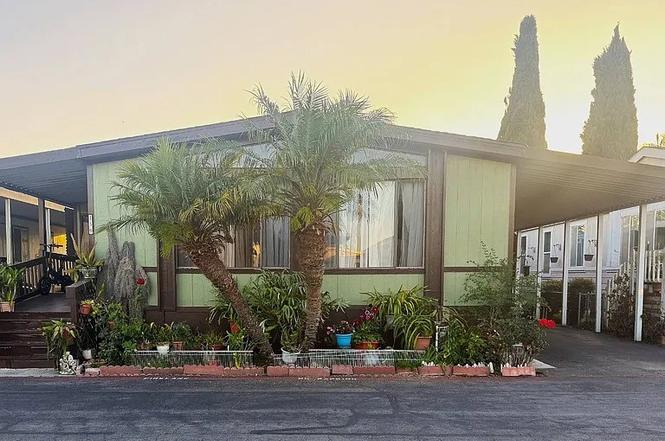
139 La Burnum Ln #139 · Fountain Valley, CA
Flood risk 1/10 · Minimal
- FEMA flood zone
- X
- Chance of flooding over 30 yrs
- 0.0%
- Est. flood insurance / yr
- $507 – $1,088
Fire risk 1/10 · Minimal
- Est. fire insurance / yr
- $659 – $1,223
Heat risk 5/10 · Moderate
- Hot days now (above 86°F)
- 7 days/yr
- Hot days in 30 yrs
- 24 days/yr
Wind risk 1/10 · Minimal
- Chance of severe wind over 30 yrs
- —
Air-quality risk 4/10 · Minor
- Unhealthy air days now
- 5 days/yr
- Unhealthy air days in 30 yrs
- 7 days/yr
Risk factors via First Street. Map © Google.
Why this score? — see what drove the B grade
The composite is a weighted blend of 9 inputs, each scored 0–100. Each bar is that input's sub-score; the figure is the points it added to the 100-point composite (weight × sub-score).
- Cash flow +30.0/30.0
- 1% rule +10.0/10.0
- DSCR +10.0/10.0
- ARV discount +7.8/15.0
- Schools +6.5/10.0
- Rent growth +3.3/5.0
- Livability +3.2/5.0
- Condition / age +2.5/5.0
- Appreciation +0.0/10.0
$159,000
🖨 Deal sheet 📄 Offer letter ✓ Due diligence
Listing remarks
LOCATION!!! Ready to move in. Near Fountain Valley High school, shopping centers. 12 minutes away from Phuc Loc Tho. The 3rd bedroom has already been added. There is still more room to add a 4th bedroom. SOLD AS-IS. Buyer and Buyer agent are responsible to verify all information.
Key facts
- 1,500 sq ft lot
- Built 1981
- Listed 7 days
Tags
Property features AI
Finance
- Other: Accessibility features noted (see remarks); Lot density approx. 36-40 units/acre; Year built source: Builder; Total stories: 1
- Financial info: Land lease of $2,700 per month (park provided)
- HOA & community: Part of an association; Community sidewalks; Park name: Fountain Valley; Manager approval required for move-in; Pets allowed with breed restrictions
Exterior
- Parking: Private parking; Located in Fountain Valley park (access via city streets, maintained road frontage)
- Security: Carbon monoxide detector(s)
- Utilities: Standard electric service; Natural gas connected; Electricity connected; Other water source; Other sewer
- Home design: Single-story home; Entry at main door; Mobile home dimensions approx. 24' x 56'; Mobile home remains; Clay roof
- Construction: Frame construction with drywall walls; Other construction elements; Frame skirt; Pier jacks foundation
- Exterior features: Guest house on property; Patio; TV antenna; No fencing; Flow control water conservation; Recycled materials used; Wind energy generation; Energy-efficient doors
Interior
- Kitchen: Gas & Electric range; Utility sink
- Bedrooms: All bedrooms on main level
- Flooring: Vinyl
- Bathrooms: 2 full bathrooms; Bathtub
- Heating & cooling: Central furnace (heating)
- Interior features: Granite counters; Panel doors; Energy Star windows; Carbon monoxide detector(s)
- Laundry & utility: Washer/dryer hookup with gas dryer connection
Neighborhood map
What this means for you Summary
Snapshot
- This is a 2-bed/2.0-bath manufactured listed at $159k.
Deal economics
- At list price, monthly cash flow is $2k ($23k/yr) — positive.
- The deal already cash-flows at list — no discount required.
- Meets the 1% rule at list price ($4k rent vs $159k).
- Cap rate 20.5% vs local median 2.0% in Fountain Valley — top-decile yield for the area; either an underpriced asset or a hidden risk that comps aren't pricing in. Stress-test before assuming the spread holds.
Location & tenants
- Location reads 64/100 on livability (#403 in CA) — a middle-class / working-renter tenant base. Strengths: employment A+, crime B; Watch: commute F, cost of living F, health & safety F.
- Huntington Beach Union High (suburban): math 65% / reading 82% proficiency, ranked #39 of 517 in CA (top 8%) — strong family-tenant draw, lease renewals of 3-5y typical.
- Zoned schools: Fountain Valley High (math 80% / reading 94%, grade A, #21 of 1,170 statewide, top 2%, 3,180 students, 49% FRL).
- Zoned-school proficiency averages 87% at this address vs 74% district-wide (+14 pts) — the actual schools serving this property are materially stronger than the Huntington Beach Union High average implies; a family-tenant draw the district grade alone would hide.
- Market conditions: Rents rising (+3.1%/yr); 57 active listings in the ZIP; 33 comparable units currently listed for rent nearby; rentals leasing fast (median 1d on market — plan ~1-2 weeks tenant-placement turnaround); high-income renter base; 6,974 units permitted in Orange County in 2024 (3,839 in 5+ unit buildings).
- This rent runs 39% of the median local income ($115k/yr) — at the standard rent-burdened threshold; future hikes will face affordability resistance.
Forward outlook
- Local home prices are declining (-3.0%/yr); year-one equity from $1k of loan paydown is wiped out by about $5k of value loss. Plan a longer hold.
- Orange County population projected at +14% by 2050 — modest demand growth; plan on rents tracking national, not racing it.
- At projected returns (-3.0% appreciation + 3.1% rent growth), your $45k cash investment doubles in ~3 years — after that, you're playing with house money.
Negotiation context
- Only 7 days on market — expect competitive offers; lowballing is unlikely to land.
- 3 sale attempts since 14y ago with the ask held roughly flat each time — persistent listings suggest the price (not the market) is what's stuck; bring a comps-based counter.
- Current owner paid $20k; list at $159k implies a 699% gain — meaningful room to come down on a strong offer.
Risks & watch-outs
- Climate carrying-cost: extreme-heat days projected 7→24/yr by 2055 (HVAC capex compounding) — expect insurance premiums to compound above CPI over the hold.
Questions for the listing agent
- Is there a deadline driving the sale (1031 exchange, divorce, estate, relocation)? That informs how much negotiation room exists.
- Schools are A-rated — typically a magnet for longer-tenancy family renters. What's the average tenant stay here, and is there a school-zone premium baked into asking?
- What's the average days-on-market for RENTAL listings here right now (not sales)? A rising rental-DOM trend means longer vacancies and softer asking-rent achievability than the comps imply.
- What's the recent tenant-quality profile in this submarket — average credit score on applications, eviction rate, late-payment / NSF rate, and stable-employment percentage? A property-management company in the area should have these aggregated.
- How much new for-sale + rental construction is in the pipeline within 1–3 miles? Heavy new supply typically softens prices + rents 12–24 months out; constrained supply supports both.
Investment metrics
- 1% rule
- 2.37% ✓
- Cap rate
- 20.46%
- Cash-on-cash
- 50.61%
- DSCR
- 3.25
- GRM
- 3.5
CMA / ARV
- ARV (on-the-fly)
- $159,936
- Comps found
- 12
Show comp detail 12 sales within ~0.75 mi
| Address | Dist | Beds/Ba | Sqft | Sold | Price | $/sf | Match |
|---|---|---|---|---|---|---|---|
| 201 Road Runner | 0.09mi | 3/2.0 (+1) | 1,344 (0%) | 3mo | $87,000 | $65 | 88 |
| 101 Myna Ln | 0.25mi | 2/2.0 | 1,334 (-1%) | 8mo | $159,000 | $119 | 80 |
| 130 Sumac Ln | 0.09mi | 3/2.0 (+1) | 1,240 (-8%) | 9mo | $148,000 | $119 | 70 |
| 203 Parrot Ln | 0.16mi | 3/2.0 (+1) | 1,440 (+7%) | 8mo | $170,000 | $118 | 69 |
| 310 Magpie | 0.29mi | 3/2.0 (+1) | 1,440 (+7%) | 2mo | $195,000 | $135 | 68 |
| 209 Road Runner | 0.12mi | 3/2.0 (+1) | 1,512 (+12%) | 2mo | $165,000 | $109 | 67 |
| 715 Catalpa Ln | 0.39mi | 2/2.0 | 1,440 (+7%) | 6mo | $125,000 | $87 | 65 |
| 108 Pigeon Ln | 0.16mi | 3/2.0 (+1) | 1,512 (+12%) | 5mo | $170,000 | $112 | 63 |
| 411 Gold Finch Ln | 0.34mi | 3/2.0 (+1) | 1,506 (+12%) | 1mo | $240,000 | $159 | 58 |
| 907 Ironwood | 0.46mi | 3/2.0 (+1) | 1,200 (-11%) | 2mo | $235,000 | $196 | 54 |
| 302 Magpie Ln | 0.29mi | 3/2.0 (+1) | 1,520 (+13%) | 14mo | $265,000 | $174 | 48 |
| 701 Catalpa Ln | 0.39mi | 3/2.0 (+1) | 1,545 (+15%) | 15mo | $252,500 | $163 | 39 |
Match score weights: distance 35% · size 25% · config 20% · recency 20%. Top-matched comps best support the ARV.
Projected returns pro-forma
-3.0% appreciation · 3.12% rent growth · sell at horizon
- IRR
- 48.5%
- Equity multiple
- 3.12×
- Total profit
- $94,326
- Equity at exit
- $23,707
- IRR
- 54.2%
- Equity multiple
- 6.35×
- Total profit
- $238,218
- Equity at exit
- $13,747
Cash invested: $44,520 (down + closing). Projections, not guarantees.
Landlord ↔ Tenant lean methodology
- Overall (STATE)
- 18 Strongly Tenant-Friendly
- State California
- 18 Strongly Tenant-Friendly · D+13
- County
- — inherits STATE
- City
- — inherits STATE
ZIP-level market 92708
- Rents YoY
- 3.1%
- Active inventory
- 57
- Price-to-rent
- 3.5×
Monthly cashflow live
- Estimated rent
- $3,767 high interval (Pro) →
- Mortgage (P&I)
- −$834
- Tax est. 1.5%
- −$199 /mo · $2,385/yr
- Insurance
- −$66
- HOA
- −$0
- Vacancy / Maint / Mgmt
- −$791
- Net cashflow
- $1,877
Break-even live
UW: 25.0% down · 7.5% · 30yr · 1.5% tax · 5.0% vac · 8.0% maint · 8.0% mgmt
Financing live
Cash to close
- Down payment
- $39,750
- Closing costs
- $4,770
- Reserves months
- —
- Total cash needed
- —
Loan-product check · same deal, 3 products live
Conventional
25% down · 7.5% · 30yr
- Down + closing
- —
- Monthly P&I
- —
- Monthly cashflow
- —
- DSCR
- —
- Eligible?
- —
Personal DTI + credit; lowest rate.
DSCR
20% down · 8.5% · 30yr
- Down + closing
- —
- Monthly P&I
- —
- Monthly cashflow
- —
- DSCR
- —
- Eligible?
- —
No personal income docs; deal must DSCR.
Hard money
10% down · 12.0% · 12mo
- Down + closing
- —
- Monthly P&I
- —
- Monthly cashflow
- —
- DSCR
- —
- Eligible?
- —
Short-term bridge; refi at stabilization.
Rent comps 33 comps
| Address | Beds | Baths | Sqft | Rent | $/sqft | DOM | Units | Dist |
|---|---|---|---|---|---|---|---|---|
| 18131 S 3rd St Fountain Valley, CA | 3.0 | 2.0 | 1254 | $5,000 | $3.99 | 1d | 1 | 0.19mi |
| 9213 El Tango Cir Fountain Valley, CA | 3.0 | 3.0 | 1670 | $4,800 | $2.87 | 1d | 1 | 0.31mi |
| 9595 Toucan Ave Fountain Valley, CA | 3.0 | 2.5 | 1548 | $4,200 | $2.71 | 16d | 1 | 0.35mi |
| 18236 Sanmian Ct Fountain Valley, CA | 3.0 | 3.0 | 1690 | $4,100 | $2.43 | 21d | 1 | 0.53mi |
| 8579 Volga River Cir Fountain Valley, CA | 3.0 | 2.0 | 1425 | $3,500 | $2.46 | 24d | 1 | 0.69mi |
| 9580 El Rey Ave Fountain Valley, CA | 1.0–2.0 | 1.0–2.0 | 908 | $3,469 | $3.82 | 1d | 10 | 0.79mi |
| 18341 Gum Tree Ln Huntington Beach, CA | 3.0 | 2.5 | 1658 | $4,500 | $2.71 | 2d | 1 | 0.88mi |
| 10220 El Monterey Ave Fountain Valley, CA | 3.0 | 2.0 | 1820 | $5,000 | $2.75 | 15d | 1 | 1.05mi |
| 10220 El Monterey Ave Fountain Valley, CA | 3.0 | 2.0 | 1820 | $5,000 | $2.75 | 16d | 1 | 1.05mi |
| 17375 Brookhurst St Fountain Valley, CA | 1.0–2.0 | 1.0 | 860 | $2,720 | $3.16 | 1d | 5 | 1.05mi |
| 8402 Slater Ave Huntington Beach, CA | 2.0 | 1.0 | 900 | $3,200 | $3.56 | 1d | 1 | 1.06mi |
| 18229 Olympic Ct Fountain Valley, CA | 3.0 | 2.0 | 1144 | $4,300 | $3.76 | 1d | 1 | 1.07mi |
| 17025 Buttonwood St Fountain Valley, CA | 3.0 | 2.0 | 1805 | $4,999 | $2.77 | 10d | 1 | 1.20mi |
| 17570 Van Buren Ln Huntington Beach, CA | 3.0 | 2.5 | 1269 | $3,950 | $3.11 | 1d | 1 | 1.21mi |
| 19343 McLaren Ln Huntington Beach, CA | 3.0 | 2.0 | 1654 | $4,000 | $2.42 | 24d | 1 | 1.22mi |
| 19282 Salmon Ln Huntington Beach, CA | 2.0 | 1.0 | 896 | $4,500 | $5.02 | 1d | 1 | 1.24mi |
| 9440 Clover Ave Fountain Valley, CA | 1.0–2.0 | 1.0–2.0 | 863 | $2,718 | $3.15 | 1d | 4 | 1.24mi |
| 18671 Libra Cir Apt 3 Huntington Beach, CA | 2.0 | 2.0 | 900 | $2,500 | $2.78 | 3d | 1 | 1.29mi |
| 18661 Libra Cir Apt 3 Huntington Beach, CA | 2.0 | 2.0 | 900 | $2,500 | $2.78 | 15d | 1 | 1.29mi |
| 7881 Beachpoint Cir Unit BD19 Huntington Beach, CA | 2.0 | 2.0 | 1006 | $3,225 | $3.21 | 14d | 1 | 1.30mi |
| 17610 Cameron Ln Unit H Huntington Beach, CA | 2.0 | 2.5 | 1020 | $2,700 | $2.65 | 1d | 1 | 1.32mi |
| 8945 Riverbend Dr Huntington Beach, CA | 1.0–2.0 | 1.0–2.0 | 772 | $3,574 | $4.63 | 1d | 3 | 1.33mi |
| 8072 Constantine Dr Unit A Huntington Beach, CA | 3.0 | 2.0 | 1200 | $3,295 | $2.75 | 15d | 1 | 1.37mi |
| 10441 Slater Ave Fountain Valley, CA | 1.0–2.0 | 1.0–2.0 | 911 | $3,167 | $3.48 | 1d | 23 | 1.38mi |
| 7882 Orchid Dr Huntington Beach, CA | 3.0 | 2.5 | 1868 | $4,995 | $2.67 | 10d | 1 | 1.38mi |
| 10636 La Perla Ave Unit A Fountain Valley, CA | 2.0 | 2.0 | 935 | $3,150 | $3.37 | 1d | 1 | 1.38mi |
| 7891 Ellis Ave Huntington Beach, CA | 2.0 | 1.0 | 1000 | $2,800 | $2.80 | 1d | 1 | 1.39mi |
| 7901 Newman Ave Apt C Huntington Beach, CA | 2.0 | 2.0 | 900 | $2,425 | $2.69 | 1d | 1 | 1.42mi |
| 7811 Talbert Ave Huntington Beach, CA | 2.0 | 1.0 | 950 | $2,969 | $3.13 | 1d | 1 | 1.44mi |
| 8081 Holland Dr Huntington Beach, CA | 1.0–2.0 | 1.0 | 790 | $2,878 | $3.64 | 1d | 9 | 1.46mi |
| 17972 Baron Cir Unit 4 Huntington Beach, CA | 2.0 | 1.0 | 876 | $2,695 | $3.08 | 1d | 1 | 1.48mi |
| 10244 Warner Ave Fountain Valley, CA | 1.0–2.0 | 1.0–2.0 | 861 | $3,279 | $3.81 | 1d | 22 | 1.48mi |
| 7822 Newman Ave Unit B Huntington Beach, CA | 2.0 | 1.5 | 950 | $2,500 | $2.63 | 1d | 1 | 1.49mi |
Listing history 8 events
-
2026-06-18days on market $159,000 Active 7 DOM
-
2026-06-17days on market $159,000 Active 6 DOM
-
2026-06-16days on market $159,000 Active 5 DOM
-
2026-06-15remarks 280-char remark
-
2026-06-15days on market $159,000 Active 4 DOM
-
2026-06-13days on market $159,000 Active 2 DOM
-
2026-06-13remarks 279-char remark
-
2026-06-13$159,000 Active 1 DOM
ⓘ Source: listings_history table (triggers on properties + properties_extension) + one-shot
backfill from property_details.listing_events for pre-trigger history.
Climate risk First Street
- Flood 1/10 Low FEMA zone X · 0% chance over 30 yrs
- Wildfire 1/10 Low
- Heat 5/10 Major 7 d/yr ≥86°F today · 24 d/yr by 30 yrs out
- Wind 1/10 Low
- Air quality 4/10 Moderate 5 unhealthy d/yr today · 7 by 30 yrs out
Nearby sold comps map
Loading sold comps map…
Walkable amenities ~0.75 mi
Loading nearby amenities…
Taxation est. · year 1
- Rental income
- $45,210
- − Mortgage interest
- −$8,906
- − Property taxes
- −$2,385
- − Insurance
- −$795
- − Repairs & maintenance
- −$3,617
- − Management
- −$3,617
- − Depreciation
- −$4,625
- Taxable income
- $21,264
- Est. tax owed @ 24.0%
- −$5,103
- After-tax cash flow
- $17,426/yr
For passive investors: Depreciation is non-cash, so a rental often shows a tax loss while cash-flowing — sheltering income. Rental losses are passive: they offset passive income freely, and up to $25,000/yr can offset ordinary (W-2) income if you actively participate and your MAGI is under $100k (phasing out to $0 by $150k); unused losses carry forward. On sale, claimed depreciation is recaptured at up to 25%, and gains may owe capital-gains tax (a 1031 exchange can defer both). Figures are a year-1 estimate at your 24.0% rate — not tax advice; consult a CPA.
Schools (NCES district)
- District
- Huntington Beach Union High
- NCES district ID
- 0618060
- Math proficiency
- 65% ▲ 17.00%
- Reading proficiency
- 82% ▲ 8.00%
- Median HH income
- $78,159
- Composite
- 64.9/100
- National rank
- #511
- State rank
- #39 of 517 in CA
Livability — Fountain Valley
- Score
- 64/100
- State rank
- #403
- US rank
- #13744
Category grades
Schools grade is shown separately in the Schools card above.
Census & demographics
- Census place
- Fountain Valley, CA
- County
- Orange County · 3,096,323 people
- City population
- 56,258
- Metro
- Los Angeles-Long Beach-Anaheim, CA
- Population (ZIP)
- 56,258
- Household income
- $115,237
- Rent vs Own
- Severe rent burden
- 1924.0
Population outlook (Orange County) Hauer SSP2
- Today (2025)
- 3,477,456 people
- By 2030
- 3,613,117 · +3.9%
- By 2040
- 3,835,945 · +10.3%
- By 2050
- 3,968,736 · +14.1%
- By 2075
- 4,097,053 · +17.8%
- By 2100
- 3,903,633 · +12.3%
Race, ethnicity, and origin ACS 2023
- Neighborhood character
- Diverse neighborhood (Simpson 0.69)
- Race & ethnicity
- White 38% Asian 37% Hispanic / Latino 17% Two or more races 13% Black 1%
- Hispanic origin (detail)
- Mexican 13%
- Common ancestry
- Italian 2% Romanian 1% Lithuanian 1%
- Foreign-born
- 32% · Vietnam, Canada, China
- Languages at home
- 54% English-only · Vietnamese 22% Spanish 10% Arabic 4%
Political lean MEDSL · Orange
- 2024 margin
- Toss-up / Even · D 49.7% · R 47.1% · Other 3.2%
- 2008→2024 swing
- +5.2pp toward D · 2008: -2.6pp · 2024: 2.6pp
- All cycles
- 2024: D+2.6 2020: D+9.0 2016: D+7.7 2012: R+8.3 2008: R+2.6
Not yet ingested
- Civics
- —
Market trends
- HPI YoY
- ▼ -928.61%
- Current HPI
- 462.4337
- Rent YoY
- ▲ 3.12%
- Metro
- Los Angeles-Long Beach-Anaheim, CA
- State GDP YoY
- ▲ 3.21%
- F500 in state
- 116
Industry mix (Fortune 500 HQ in CA)
| Industry | F500 HQs | Revenue |
|---|---|---|
| Technology | 27 | $1,492B |
|
||
| Financial Services | 3 | $174B |
|
||
| Retail | 3 | $44B |
|
||
| Insurance | 3 | $26B |
|
||
| Media / Entertainment | 2 | $115B |
|
||
| Pharmaceuticals / Biotech | 2 | $62B |
|
||
Price history
+278.6% since first listed6 events — show timeline
- 2026-06-11 Listed $159,000 CRMLS
- 2013-02-05 Sold (MLS) $19,900 CRMLS
- 2012-12-03 Listed $19,900 CRMLS
- 2012-11-21 Listing Removed — CRMLS
- 2012-11-16 Price Changed $19,900 CRMLS
- 2012-09-24 Listed $42,000 CRMLS
Cash-flow waterfall
monthlySold comps — $/sqft
last 12 mo · ≤1 miLoading sold comps…