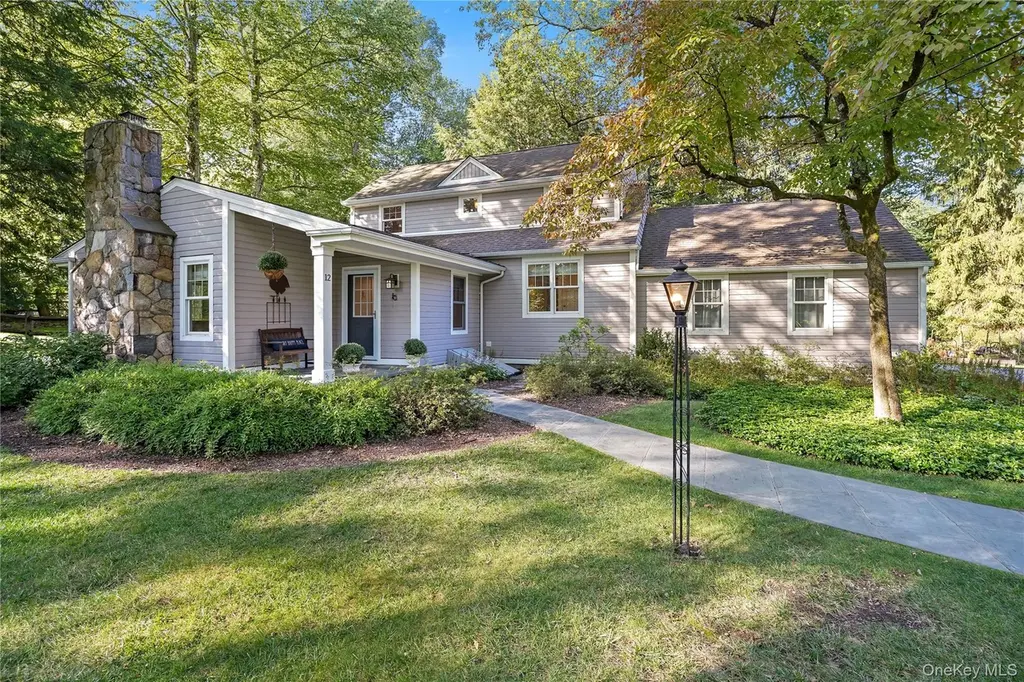
12 N Lake Cir · West Mountain, CT
Flood risk 1/10 · Minimal
- FEMA flood zone
- X (unshaded)
- Chance of flooding over 30 yrs
- 0.0%
- Est. flood insurance / yr
- $507 – $1,088
Fire risk 2/10 · Minimal
- Est. fire insurance / yr
- $691 – $1,283
Heat risk 4/10 · Minor
- Hot days now (above 98°F)
- 7 days/yr
- Hot days in 30 yrs
- 15 days/yr
Wind risk 6/10 · Moderate
- Chance of severe wind over 30 yrs
- 27.0%
Air-quality risk 4/10 · Minor
- Unhealthy air days now
- 3 days/yr
- Unhealthy air days in 30 yrs
- 6 days/yr
Risk factors via First Street. Map © Google.
Why this score? — see what drove the B- grade
The composite is a weighted blend of 9 inputs, each scored 0–100. Each bar is that input's sub-score; the figure is the points it added to the 100-point composite (weight × sub-score).
- Cash flow +30.0/30.0
- 1% rule +10.0/10.0
- DSCR +10.0/10.0
- Schools +7.5/10.0
- Rent growth +2.5/5.0
- Livability +2.5/5.0
- Condition / age +2.5/5.0
- ARV discount +1.1/15.0
- Appreciation +0.0/10.0
$899,000
🖨 Deal sheet 📄 Offer letter ✓ Due diligence
Listing remarks MLS
Totally renovated 3 BR, 2 BTH CAPE on park-like, flat property w/ deeded lake rights to lakes Oscaleta & Rippowam. New kitchen, new baths, ac, new roof - A pleasure to see!
Key facts
- Slate patio
- Stone fireplace
- Eco-friendly home
Tags
Property features AI
Finance
- Other: Living area reported as 1700 (source: public records)
- Financial info: Details not specified
- HOA & community: Quarterly additional fee of $125 for water
Exterior
- Parking: Attached parking; Driveway; 2-car garage
- Security: Details not specified
- Utilities: Electricity connected (NYSEG); Water connected; Septic tank; Phone connected; Propane; Private trash collection
- Home design: Single family residence
- Construction: Wood siding; Unfinished attic; Basement with Bilco doors, storage space, unfinished
- Exterior features: Patio; Back yard; Front yard; Landscaped; Level lot; Fenced backyard; Not waterfront; Generator
Interior
- Kitchen: Dishwasher; Electric oven; Microwave; Refrigerator; Stainless steel appliances; Granite countertops; Open kitchen with breakfast bar
- Bedrooms: Details not specified
- Flooring: Carpet; Hardwood; Tile
- Bathrooms: 2 full bathrooms
- Heating & cooling: Geothermal heating; Geothermal cooling
- Interior features: Beamed ceilings; Breakfast bar; Entrance foyer; Granite counters; Open kitchen; Primary bathroom; Double-pane windows; Patio
- Laundry & utility: Laundry in hall; Dryer; Geothermal water heater
Neighborhood map
What this means for you Summary
Snapshot
- This is a 3-bed/2.0-bath single-family listed at $899k.
Deal economics
- At list price, monthly cash flow is $5k ($60k/yr) — positive.
- The deal already cash-flows at list — no discount required.
- Meets the 1% rule at list price ($14k rent vs $899k).
- Cap rate 13.0% vs local median 3.1% in West Mountain — top-decile yield for the area; either an underpriced asset or a hidden risk that comps aren't pricing in. Stress-test before assuming the spread holds.
Location & tenants
- Location reads: area grade B — affects rentability + tenant quality, not the cash-flow math above.
- Katonah-Lewisboro Union Free School District (suburban): math 75% / reading 82% proficiency, ranked #32 of 590 in NY (top 5%) — strong family-tenant draw, lease renewals of 3-5y typical; only 3% free/reduced lunch — higher-income household profile.
- Zoned schools: Increase Miller Elementary School (math 82% / reading 87%, grade A+, #93 of 2,108 statewide, top 6%, 489 students, 9% FRL); John Jay Middle School (math 58% / reading 79%, grade A, #94 of 729 statewide, top 13%, 662 students, 7% FRL); John Jay High School (math 98% / reading 82%, grade A+, #238 of 1,100 statewide, top 23%, 917 students, 9% FRL).
- Market conditions: 4 comparable units currently listed for rent nearby; rentals leasing fast (median 3d on market — plan ~1-2 weeks tenant-placement turnaround); 954 units permitted in Westchester County in 2024 (649 in 5+ unit buildings).
Forward outlook
- Local home prices are declining (-3.0%/yr); year-one equity from $6k of loan paydown is wiped out by about $27k of value loss. Plan a longer hold.
- Westchester County population projected at +10% by 2050 — modest demand growth; plan on rents tracking national, not racing it.
- At projected returns (-3.0% appreciation + 3.0% rent growth), your $252k cash investment doubles in ~6 years — after that, you're playing with house money.
Negotiation context
- Only 5 days on market — expect competitive offers; lowballing is unlikely to land.
- 5 sale attempts since 23y ago with the ask held roughly flat each time — persistent listings suggest the price (not the market) is what's stuck; bring a comps-based counter.
- Current owner paid $690k; 30% above their basis — modest negotiation headroom, anchor on the comps not their cost.
Risks & watch-outs
- Watch-outs: built in 1954 — expect roof / HVAC / electrical / plumbing capex.
- Climate carrying-cost: major wind risk, 27% chance of damaging wind over 30y — expect insurance premiums to compound above CPI over the hold.
Questions for the listing agent
- Built in 1954 — when were the roof, HVAC, electrical panel, plumbing, and water heater last replaced?
- Is there a deadline driving the sale (1031 exchange, divorce, estate, relocation)? That informs how much negotiation room exists.
- What's the average days-on-market for RENTAL listings here right now (not sales)? A rising rental-DOM trend means longer vacancies and softer asking-rent achievability than the comps imply.
- What's the recent tenant-quality profile in this submarket — average credit score on applications, eviction rate, late-payment / NSF rate, and stable-employment percentage? A property-management company in the area should have these aggregated.
- How much new for-sale + rental construction is in the pipeline within 1–3 miles? Heavy new supply typically softens prices + rents 12–24 months out; constrained supply supports both.
Investment metrics
- 1% rule
- 1.60% ✓
- Cap rate
- 12.97%
- Cash-on-cash
- 23.85%
- DSCR
- 2.06
- GRM
- 5.2
CMA / ARV
- ARV (on-the-fly)
- $787,100
- Comps found
- 3
Show comp detail 3 sales within ~0.75 mi
| Address | Dist | Beds/Ba | Sqft | Sold | Price | $/sf | Match |
|---|---|---|---|---|---|---|---|
| 12 N Lake Cir | 0.00mi | 3/2.0 | 1,700 (0%) | 1mo | $1,059,000 | $623 | 100 |
| 1 Orchard Dr | 0.18mi | 3/2.0 | 1,770 (+4%) | 10mo | $820,000 | $463 | 77 |
| 25 Twin Lakes Rd | 0.05mi | 4/3.0 (+1) | 1,944 (+14%) | 8mo | $675,000 | $347 | 58 |
Match score weights: distance 35% · size 25% · config 20% · recency 20%. Top-matched comps best support the ARV.
Projected returns pro-forma
-3.0% appreciation · 3.0% rent growth · sell at horizon
- IRR
- 17.1%
- Equity multiple
- 1.69×
- Total profit
- $173,326
- Equity at exit
- $134,044
- IRR
- 25.6%
- Equity multiple
- 3.24×
- Total profit
- $562,603
- Equity at exit
- $77,729
Cash invested: $251,720 (down + closing). Projections, not guarantees.
Landlord ↔ Tenant lean methodology
- Overall (STATE)
- 27 Tenant-Leaning
- State Connecticut
- 27 Tenant-Leaning · D+7
- County
- — inherits STATE
- City
- — inherits STATE
ZIP-level market 10590
- Home prices YoY
- -30.8%
- Price-to-rent
- 5.2×
Monthly cashflow live
- Estimated rent
- $14,422 medium interval (Pro) →
- Mortgage (P&I)
- −$4,714
- Tax from tax record
- −$1,301 /mo · $15,612/yr
- Insurance
- −$375
- HOA
- −$0
- Vacancy / Maint / Mgmt
- −$3,029
- Net cashflow
- $5,004
Break-even live
UW: 25.0% down · 7.5% · 30yr · 1.5% tax · 5.0% vac · 8.0% maint · 8.0% mgmt
Financing live
Cash to close
- Down payment
- $224,750
- Closing costs
- $26,970
- Reserves months
- —
- Total cash needed
- —
Loan-product check · same deal, 3 products live
Conventional
25% down · 7.5% · 30yr
- Down + closing
- —
- Monthly P&I
- —
- Monthly cashflow
- —
- DSCR
- —
- Eligible?
- —
Personal DTI + credit; lowest rate.
DSCR
20% down · 8.5% · 30yr
- Down + closing
- —
- Monthly P&I
- —
- Monthly cashflow
- —
- DSCR
- —
- Eligible?
- —
No personal income docs; deal must DSCR.
Hard money
10% down · 12.0% · 12mo
- Down + closing
- —
- Monthly P&I
- —
- Monthly cashflow
- —
- DSCR
- —
- Eligible?
- —
Short-term bridge; refi at stabilization.
Rent comps 4 comps
| Address | Beds | Baths | Sqft | Rent | $/sqft | DOM | Units | Dist |
|---|---|---|---|---|---|---|---|---|
| 34 Twin Lakes Rd South Salem, NY | 3.0 | 2.0 | 1866 | $15,000 | $8.04 | 2d | 1 | 0.11mi |
| 24 Cove Rd South Salem, NY | 3.0 | 2.0 | 1600 | $18,000 | $11.25 | 2d | 1 | 0.53mi |
| 53 Cove Rd South Salem, NY | 2.0 | 1.5 | 1101 | $6,500 | $5.90 | 2d | 1 | 0.70mi |
| 57 Truesdale Lake Dr South Salem, NY | 3.0 | 2.5 | 1350 | $7,000 | $5.19 | 2d | 1 | 1.49mi |
Listing history 15 events
-
2026-04-21status Pending
-
2026-04-01$899,000 Active
-
2007-04-20soldstatus $690,000
-
2007-03-20soldstatus $690,000 178-char remark
Show marketing remark (178 chars)
Totally renovated 3 BR, 2 BTH CAPE on park-like, flat property w/ deeded lake rights to lakes Oscaleta & Rippowam. New kitchen, new baths, ac, new roof - A pleasure to see!
-
2007-01-24price $709,000 178-char remark
Show marketing remark (178 chars)
Totally renovated 3 BR, 2 BTH CAPE on park-like, flat property w/ deeded lake rights to lakes Oscaleta & Rippowam. New kitchen, new baths, ac, new roof - A pleasure to see!
-
2007-01-24historical 178-char remark
Show marketing remark (178 chars)
Totally renovated 3 BR, 2 BTH CAPE on park-like, flat property w/ deeded lake rights to lakes Oscaleta & Rippowam. New kitchen, new baths, ac, new roof - A pleasure to see!
-
2007-01-22historical
-
2007-01-12$690,000 178-char remark
Show marketing remark (178 chars)
Totally renovated 3 BR, 2 BTH CAPE on park-like, flat property w/ deeded lake rights to lakes Oscaleta & Rippowam. New kitchen, new baths, ac, new roof - A pleasure to see!
-
2006-06-14
-
2005-09-18historical
-
2005-05-18
-
2004-02-13soldstatus $427,900
-
2003-08-11soldstatus $429,000
-
2003-07-24historical
-
2003-06-25$429,000
ⓘ Source: listings_history table (triggers on properties + properties_extension) + one-shot
backfill from property_details.listing_events for pre-trigger history.
Tax reassessment forecast CT · Partial reset (capped growth)
- Current annual tax
- $15,612 · $1,301/mo
- Projected year-2 tax
- $17,425 · $1,452/mo
- Expected delta
- +$1,813/yr (+$151/mo · 11.6%)
ⓘ Screening estimate from a state-policy table — verify with the county assessor before closing.
Climate risk First Street
- Flood 1/10 Low FEMA zone X (unshaded) · 0% chance over 30 yrs
- Wildfire 2/10 Low
- Heat 4/10 Moderate 7 d/yr ≥98°F today · 15 d/yr by 30 yrs out
- Wind 6/10 Major 27% chance of damaging wind over 30 yrs
- Air quality 4/10 Moderate 3 unhealthy d/yr today · 6 by 30 yrs out
Nearby sold comps map
Loading sold comps map…
Walkable amenities ~0.75 mi
Loading nearby amenities…
Taxation est. · year 1
- Rental income
- $173,066
- − Mortgage interest
- −$50,358
- − Property taxes
- −$15,612
- − Insurance
- −$4,495
- − Repairs & maintenance
- −$13,845
- − Management
- −$13,845
- − Depreciation
- −$26,153
- Taxable income
- $48,758
- Est. tax owed @ 24.0%
- −$11,702
- After-tax cash flow
- $48,340/yr
For passive investors: Depreciation is non-cash, so a rental often shows a tax loss while cash-flowing — sheltering income. Rental losses are passive: they offset passive income freely, and up to $25,000/yr can offset ordinary (W-2) income if you actively participate and your MAGI is under $100k (phasing out to $0 by $150k); unused losses carry forward. On sale, claimed depreciation is recaptured at up to 25%, and gains may owe capital-gains tax (a 1031 exchange can defer both). Figures are a year-1 estimate at your 24.0% rate — not tax advice; consult a CPA.
Schools (NCES district)
- District
- Katonah-Lewisboro Union Free School District
- NCES district ID
- 3616080
- Math proficiency
- 75% ▼ -8.00%
- Reading proficiency
- 82% ▲ 2.00%
- Median HH income
- $140,994
- Composite
- 75.09/100
- National rank
- #142
- State rank
- #32 of 590 in NY
Livability — West Mountain
No livability data for this city. (Only ~50 U.S. cities are tracked.)
Census & demographics
- Population (ZIP)
- 7,314
Population outlook (Westchester County) Hauer SSP2
- Today (2025)
- 1,028,035 people
- By 2030
- 1,051,636 · +2.3%
- By 2040
- 1,098,520 · +6.9%
- By 2050
- 1,136,044 · +10.5%
- By 2075
- 1,196,925 · +16.4%
- By 2100
- 1,175,147 · +14.3%
Race, ethnicity, and origin ACS 2023
- Neighborhood character
- Predominantly White (84%)
- Race & ethnicity
- White 84% Two or more races 8% Hispanic / Latino 6% Asian 4% Black 1%
- Hispanic origin (detail)
- Puerto Rican 3%
- Common ancestry
- Italian 4% Romanian 3% Scotch-Irish 2%
- Foreign-born
- 13% · Canada, South Korea, Jamaica
- Languages at home
- 90% English-only · Spanish 4% Other Indo-European 2% Korean 1%
Political lean MEDSL · Westchester
- 2024 margin
- Strong D (+26.3) · D 63.1% · R 36.9%
- 2008→2024 swing
- -1.3pp toward R · 2008: 27.6pp · 2024: 26.3pp
- All cycles
- 2024: D+26.3 2020: D+36.3 2016: D+32.8 2012: D+22.2 2008: D+27.6
Not yet ingested
- Civics
- —
Market trends
- HPI YoY
- ▼ -66.87%
- Current HPI
- 150.088
- Rent YoY
- —
- Metro
- —
- State GDP YoY
- ▲ 1.06%
- F500 in state
- 38
Industry mix (Fortune 500 HQ in CT)
| Industry | F500 HQs | Revenue |
|---|---|---|
| Industrial Machinery | 4 | $38B |
|
||
| Insurance | 3 | $71B |
|
||
| Financial Services | 2 | $25B |
|
||
| Transportation / Logistics | 2 | $18B |
|
||
| Healthcare | 1 | $247B |
|
||
| Telecommunications | 1 | $55B |
|
||
Price history
+109.6% since first listed15 events — show timeline
- 2026-04-21 Pending — OneKey® MLS as Distributed by MLS Grid
- 2026-04-01 Listed $899,000 OneKey® MLS as Distributed by MLS Grid
- 2007-04-20 Sold (Public Records) $690,000 Public Records
- 2007-03-20 Sold (MLS) $690,000 HGMLS
- 2007-01-24 Delisted — HGMLS
- 2007-01-24 Price Changed $709,000 HGMLS
- 2007-01-22 Delisted — HGMLS
- 2007-01-12 Listed $690,000 HGMLS
- 2006-06-14 Listed — HGMLS
- 2005-09-18 Delisted — HGMLS
- 2005-05-18 Listed — HGMLS
- 2004-02-13 Sold (Public Records) $427,900 Public Records
- 2003-08-11 Sold (MLS) $429,000 HGMLS
- 2003-07-24 Delisted — HGMLS
- 2003-06-25 Listed $429,000 HGMLS
Property tax history
+5.4%/yrLatest (2025): $15,612 · +4.1% YoY. Source: county tax records.
Cash-flow waterfall
monthlySold comps — $/sqft
last 12 mo · ≤1 miLoading sold comps…