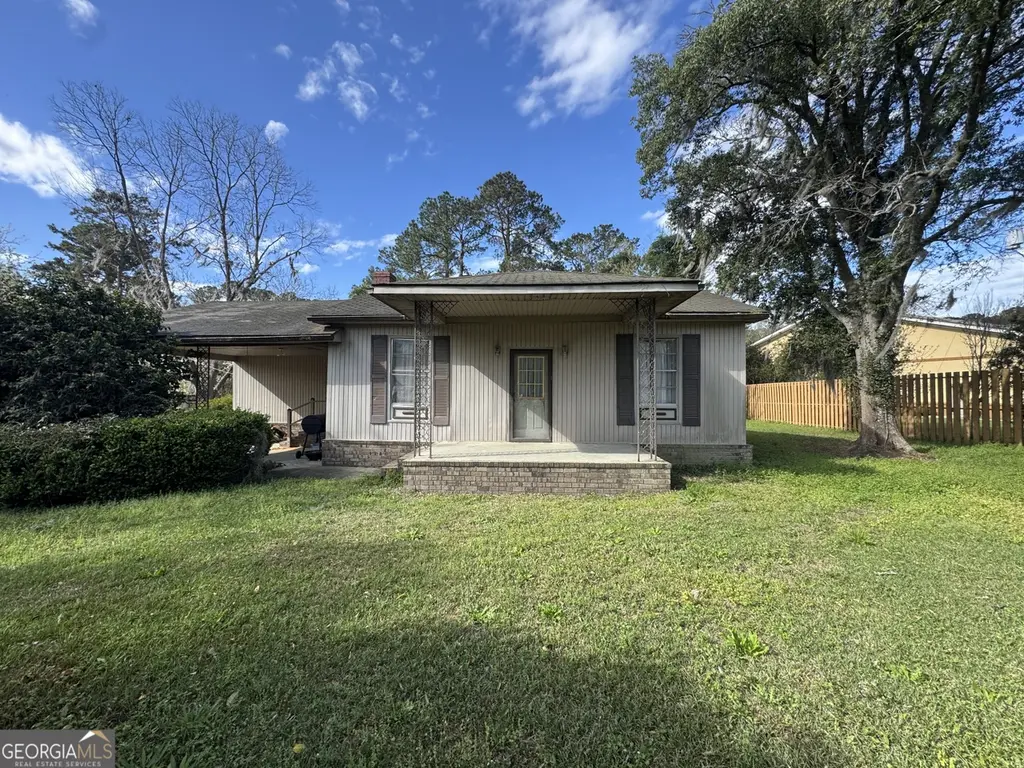
1761 Grove Point Rd · Georgetown, GA
Flood risk 1/10 · Minimal
- FEMA flood zone
- X (unshaded)
- Chance of flooding over 30 yrs
- 0.0%
- Est. flood insurance / yr
- $507 – $1,088
Fire risk 5/10 · Moderate
- Est. fire insurance / yr
- $963 – $1,789
Heat risk 9/10 · Severe
- Hot days now (above 108°F)
- 7 days/yr
- Hot days in 30 yrs
- 18 days/yr
Wind risk 8/10 · Major
- Chance of severe wind over 30 yrs
- 99.0%
Air-quality risk 2/10 · Minimal
- Unhealthy air days now
- 2 days/yr
- Unhealthy air days in 30 yrs
- 2 days/yr
Risk factors via First Street. Map © Google.
Why this score? — see what drove the C+ grade
The composite is a weighted blend of 9 inputs, each scored 0–100. Each bar is that input's sub-score; the figure is the points it added to the 100-point composite (weight × sub-score).
- Cash flow +23.4/30.0
- ARV discount +15.0/15.0
- 1% rule +7.7/10.0
- DSCR +7.5/10.0
- Livability +3.4/5.0
- Condition / age +2.5/5.0
- Rent growth +2.1/5.0
- Schools +2.0/10.0
- Appreciation +0.0/10.0
$155,000
🖨 Deal sheet 📄 Offer letter ✓ Due diligence
Listing remarks MLS
Attention investors and handy owner-occupants: Secure a high-potential property featuring a 3-bedroom, 1-bathroom home on a spacious 1.35-acre lot. This property is the perfect canvas to build sweat equity through a custom renovation or quick rental grade update. Situated along a high-growth corridor, it boasts massive flexibility-whether you want to build your dream homestead, execute a profitable fix-and-flip, or hold it as a high-yield investment.
Key facts
- Spacious lot
- Custom renovation
- 1.35 acre lot
Tags
Property features AI
Exterior
- Parking: Attached carport; Two carport spaces
- Utilities: Public water; Septic tank sewer; Other utilities
- Home design: One-level home; Resale property; Facing/direction: Not specified
- Construction: Wood siding; Shingle roof; Slab foundation
- Exterior features: Use GPS for directions; Other road frontage type
Interior
- Kitchen: Kitchen with other features; Appliances: Other
- Bedrooms: Three main-level bedrooms; Other bedroom features
- Flooring: Other flooring
- Bathrooms: One full bathroom on the main level; Master bath: Other features
- Heating & cooling: Central heating; Central air plus other cooling
- Interior features: No shared/common walls; Other interior features
- Laundry & utility: Laundry/utility features: Other
Neighborhood map
What this means for you Summary
Snapshot
- This is a 3-bed/1.0-bath single-family listed at $155k.
Deal economics
- At list price, monthly cash flow is $285 ($3k/yr) — positive.
- The deal already cash-flows at list — no discount required.
- Meets the 1% rule at list price ($2k rent vs $155k).
- Cap rate 8.5% vs local median 4.0% in Georgetown — top-decile yield for the area; either an underpriced asset or a hidden risk that comps aren't pricing in. Stress-test before assuming the spread holds.
Location & tenants
- Location reads 68/100 on livability (#138 in GA) — a middle-class / working-renter tenant base. Strengths: cost of living A+, housing A+, health & safety A-; Watch: employment C-, amenities F, commute F.
- Savannah-Chatham County (urban): math 20% / reading 26% proficiency, ranked #134 of 174 in GA (top 77%) — low school quality limits family demand, transient renter base, plan for 1-2y turnover.
- Zoned schools: Southwest Middle School (math 12% / reading 12%, grade F, #417 of 470 statewide, top 90%, 743 students, 83% FRL); Windsor Forest High School (math 2% / reading 17%, grade F, #365 of 424 statewide, top 88%, 1,012 students, 72% FRL) — zoned schools average 78% FRL vs 59% district-wide (19 pts higher); higher-poverty schools than district average — tighter screening recommended.
- Zoned-school proficiency averages 11% at this address vs 23% district-wide (-12 pts) — the specific schools serving this property underperform the Savannah-Chatham County average; the district grade overstates school quality for this exact location.
- Market conditions: Rents soft (-1.4%/yr); 405 active listings in the ZIP; 19 comparable units currently listed for rent nearby; rentals lingering (median 44d on market — plan ~5-8 weeks vacancy on turnover, expect pricing pressure); 53% of comp listings sitting > 30 days — soft ceiling on asking rent; 2,694 units permitted in Chatham County in 2024 (973 in 5+ unit buildings).
- This rent runs 34% of the median local income ($70k/yr) — at the standard rent-burdened threshold; future hikes will face affordability resistance.
Forward outlook
- Local home prices are declining (-3.0%/yr); year-one equity from $1k of loan paydown is wiped out by about $5k of value loss. Plan a longer hold.
- Chatham County population projected at +33% by 2050 — long-run rental-demand tailwind backs the buy-and-hold thesis.
Negotiation context
- Only 11 days on market — expect competitive offers; lowballing is unlikely to land.
- 2 sale attempts with the ask held roughly flat each time — persistent listings suggest the price (not the market) is what's stuck; bring a comps-based counter.
Risks & watch-outs
- Watch-outs: property tax is 3.1% of price; built in 1940 — expect roof / HVAC / electrical / plumbing capex.
- Climate carrying-cost: severe wind risk, 99% chance of damaging wind over 30y; moderate wildfire risk; extreme-heat days projected 7→18/yr by 2055 (HVAC capex compounding) — expect insurance premiums to compound above CPI over the hold.
Questions for the listing agent
- Built in 1940 — when were the roof, HVAC, electrical panel, plumbing, and water heater last replaced?
- Property tax is high relative to price — has the assessment been appealed recently, and will the sale trigger a re-assessment?
- Is there a deadline driving the sale (1031 exchange, divorce, estate, relocation)? That informs how much negotiation room exists.
- Schools are F-rated, which usually means shorter tenancies and higher turnover. Who's the typical renter profile here, and what's been the actual vacancy rate?
- What's the average days-on-market for RENTAL listings here right now (not sales)? A rising rental-DOM trend means longer vacancies and softer asking-rent achievability than the comps imply.
- What's the recent tenant-quality profile in this submarket — average credit score on applications, eviction rate, late-payment / NSF rate, and stable-employment percentage? A property-management company in the area should have these aggregated.
- How much new for-sale + rental construction is in the pipeline within 1–3 miles? Heavy new supply typically softens prices + rents 12–24 months out; constrained supply supports both.
Investment metrics
- 1% rule
- 1.27% ✓
- Cap rate
- 8.50%
- Cash-on-cash
- 7.89%
- DSCR
- 1.35
- GRM
- 6.5
CMA / ARV
- ARV (on-the-fly)
- $270,276
- Comps found
- 11
Show comp detail 11 sales within ~0.75 mi
| Address | Dist | Beds/Ba | Sqft | Sold | Price | $/sf | Match |
|---|---|---|---|---|---|---|---|
| 15 Barrington Cir | 0.42mi | 3/2.0 | 1,371 (+2%) | 1mo | $300,000 | $219 | 71 |
| 18 Barrington Cir | 0.39mi | 3/2.0 | 1,350 (+1%) | 12mo | $265,000 | $196 | 66 |
| 9 Brandy Ln | 0.48mi | 3/2.0 | 1,398 (+4%) | 2mo | $285,000 | $204 | 65 |
| 116 Calm Oaks Cir | 0.42mi | 3/2.0 | 1,400 (+5%) | 11mo | $290,000 | $207 | 60 |
| 25 Barksdale Dr | 0.34mi | 3/2.0 | 1,528 (+14%) | 2mo | $260,000 | $170 | 55 |
| 6 Chowning Dr | 0.44mi | 3/2.0 | 1,383 (+3%) | 19mo | $280,000 | $202 | 54 |
| 3 Mallorys Ct | 0.72mi | 3/2.0 | 1,388 (+4%) | 3mo | $225,000 | $162 | 53 |
| 19 Barksdale Dr | 0.38mi | 3/2.0 | 1,433 (+7%) | 17mo | $282,950 | $197 | 52 |
| 143 Dukes Way | 0.68mi | 3/2.0 | 1,400 (+5%) | 8mo | $320,000 | $229 | 50 |
| 101 Dukes Way | 0.70mi | 3/2.0 | 1,422 (+6%) | 7mo | $256,000 | $180 | 46 |
| 28 Red Fox Dr | 0.60mi | 3/2.0 | 1,478 (+10%) | 10mo | $300,000 | $203 | 43 |
Match score weights: distance 35% · size 25% · config 20% · recency 20%. Top-matched comps best support the ARV.
Projected returns pro-forma
-3.0% appreciation · 0.0% rent growth · sell at horizon
- IRR
- -8.2%
- Equity multiple
- 0.71×
- Total profit
- $-12,567
- Equity at exit
- $23,111
- IRR
- -3.8%
- Equity multiple
- 0.79×
- Total profit
- $-9,268
- Equity at exit
- $13,402
Cash invested: $43,400 (down + closing). Projections, not guarantees.
Landlord ↔ Tenant lean methodology
- Overall (STATE)
- 90 Strongly Landlord-Friendly
- State Georgia
- 90 Strongly Landlord-Friendly · R+3
- County
- — inherits STATE
- City
- — inherits STATE
ZIP-level market 31419
- Home prices YoY
- -25.9%
- Rents YoY
- -1.4%
- Active inventory
- 405
- Price-to-rent
- 6.5×
Monthly cashflow live
- Estimated rent
- $1,975 high interval (Pro) →
- Mortgage (P&I)
- −$813
- Tax from tax record
- −$397 /mo · $4,768/yr
- Insurance
- −$65
- HOA
- −$0
- Vacancy / Maint / Mgmt
- −$415
- Net cashflow
- $285
Break-even live
UW: 25.0% down · 7.5% · 30yr · 1.5% tax · 5.0% vac · 8.0% maint · 8.0% mgmt
Financing live
Cash to close
- Down payment
- $38,750
- Closing costs
- $4,650
- Reserves months
- —
- Total cash needed
- —
Loan-product check · same deal, 3 products live
Conventional
25% down · 7.5% · 30yr
- Down + closing
- —
- Monthly P&I
- —
- Monthly cashflow
- —
- DSCR
- —
- Eligible?
- —
Personal DTI + credit; lowest rate.
DSCR
20% down · 8.5% · 30yr
- Down + closing
- —
- Monthly P&I
- —
- Monthly cashflow
- —
- DSCR
- —
- Eligible?
- —
No personal income docs; deal must DSCR.
Hard money
10% down · 12.0% · 12mo
- Down + closing
- —
- Monthly P&I
- —
- Monthly cashflow
- —
- DSCR
- —
- Eligible?
- —
Short-term bridge; refi at stabilization.
Rent comps 19 comps
| Address | Beds | Baths | Sqft | Rent | $/sqft | DOM | Units | Dist |
|---|---|---|---|---|---|---|---|---|
| 1825 Grove Point Rd Savannah, GA | 1.0–3.0 | 1.0–2.0 | 1089 | $2,075 | $1.90 | 13d | 34 | 0.25mi |
| 1800 Grove Point Rd Savannah, GA | 1.0–3.0 | 1.0–2.0 | 1088 | $1,978 | $1.82 | 13d | 16 | 0.31mi |
| 120 Calm Oak Cir Savannah, GA | 3.0 | 2.5 | 1816 | $2,250 | $1.24 | 43d | 1 | 0.39mi |
| 15 Brasseler Blvd Savannah, GA | 1.0–3.0 | 1.0–2.0 | 1077 | $1,900 | $1.76 | 13d | 16 | 0.47mi |
| 1015 King George Blvd Savannah, GA | 1.0–2.0 | 1.0–2.0 | 1007 | $1,600 | $1.59 | 23d | 1 | 0.58mi |
| 33 Beaver Run Dr Savannah, GA | 4.0 | 2.0 | 1519 | $2,400 | $1.58 | 43d | 1 | 0.59mi |
| 777 King George Blvd Savannah, GA | 2.0 | 3.0 | 1564 | $1,750 | $1.12 | 43d | 1 | 0.91mi |
| 101 Saint George Blvd Savannah, GA | 1.0–2.0 | 1.0–2.0 | 769 | $1,599 | $2.08 | 43d | 7 | 0.95mi |
| 42 Sand Dollar Ln Savannah, GA | 2.0 | 2.0 | 1080 | $1,695 | $1.57 | 43d | 1 | 1.01mi |
| 1 Saint George Blvd Savannah, GA | 1.0–3.0 | 1.0–2.0 | 1157 | $1,755 | $1.52 | 13d | 32 | 1.03mi |
| 777 King George Blvd #9 Savannah, GA | 2.0 | 2.5 | 1564 | $1,750 | $1.12 | 43d | 1 | 1.03mi |
| 201 Whittington Dr Savannah, GA | 3.0 | 2.0 | 1178 | $2,100 | $1.78 | 43d | 1 | 1.10mi |
| 116 W White Hawthorne Dr Savannah, GA | 3.0 | 2.0 | 1100 | $1,800 | $1.64 | 43d | 1 | 1.15mi |
| 207 Whittington Dr Savannah, GA | 3.0 | 2.0 | 1508 | $1,950 | $1.29 | 23d | 1 | 1.17mi |
| 127 Stockbridge Dr Savannah, GA | 3.0 | 2.0 | 1191 | $1,950 | $1.64 | 23d | 1 | 1.22mi |
| 5 Snowy Egret Ct Savannah, GA | 3.0 | 2.0 | 1625 | $2,050 | $1.26 | 43d | 1 | 1.25mi |
| 152 Dovetail Xing Savannah, GA | 3.0 | 2.0 | 1398 | $2,100 | $1.50 | 13d | 1 | 1.28mi |
| 152 Dovetail Xing Savannah, GA | 3.0 | 2.0 | 1400 | $2,100 | $1.50 | 43d | 1 | 1.28mi |
| 13 Orchid Ln Savannah, GA | 3.0 | 2.0 | 1490 | $1,900 | $1.28 | 21d | 1 | 1.29mi |
Listing history 9 events
-
2026-06-16days on market $155,000 Active 11 DOM
-
2026-06-15days on market $155,000 Active 10 DOM
-
2026-06-14days on market $155,000 Active 8 DOM
-
2026-06-13days on market $155,000 Active 7 DOM
-
2026-06-10days on market $155,000 Active 5 DOM
-
2026-06-09days on market $155,000 Active 4 DOM
-
2026-06-08days on market $155,000 Active 3 DOM
-
2026-06-07remarks 454-char remark
-
2026-06-07$155,000 Active 2 DOM
ⓘ Source: listings_history table (triggers on properties + properties_extension) + one-shot
backfill from property_details.listing_events for pre-trigger history.
Tax reassessment forecast GA · Resets to sale price
- Current annual tax
- $4,768 · $397/mo
- Projected year-2 tax
- $4,768 · $397/mo
- Expected delta
- $0/yr ($0/mo · 0.0%)
ⓘ Screening estimate from a state-policy table — verify with the county assessor before closing.
Climate risk First Street
- Flood 1/10 Low FEMA zone X (unshaded) · 0% chance over 30 yrs
- Wildfire 5/10 Major
- Heat 9/10 Extreme 7 d/yr ≥108°F today · 18 d/yr by 30 yrs out
- Wind 8/10 Severe 99% chance of damaging wind over 30 yrs
- Air quality 2/10 Low 2 unhealthy d/yr today · 2 by 30 yrs out
Nearby sold comps map
Loading sold comps map…
Walkable amenities ~0.75 mi
Loading nearby amenities…
Taxation est. · year 1
- Rental income
- $23,700
- − Mortgage interest
- −$8,682
- − Property taxes
- −$4,768
- − Insurance
- −$775
- − Repairs & maintenance
- −$1,896
- − Management
- −$1,896
- − Depreciation
- −$4,509
- Taxable income
- $1,173
- Est. tax owed @ 24.0%
- −$282
- After-tax cash flow
- $3,144/yr
For passive investors: Depreciation is non-cash, so a rental often shows a tax loss while cash-flowing — sheltering income. Rental losses are passive: they offset passive income freely, and up to $25,000/yr can offset ordinary (W-2) income if you actively participate and your MAGI is under $100k (phasing out to $0 by $150k); unused losses carry forward. On sale, claimed depreciation is recaptured at up to 25%, and gains may owe capital-gains tax (a 1031 exchange can defer both). Figures are a year-1 estimate at your 24.0% rate — not tax advice; consult a CPA.
Schools (NCES district)
- District
- Savannah-Chatham County
- NCES district ID
- 1301020
- Math proficiency
- 20% ▼ -11.00%
- Reading proficiency
- 26% ▼ -5.00%
- Median HH income
- $47,443
- Composite
- 20.14/100
- National rank
- #8639
- State rank
- #134 of 174 in GA
Livability — Georgetown
- Score
- 68/100
- State rank
- #138
- US rank
- #9395
Category grades
Schools grade is shown separately in the Schools card above.
Census & demographics
- Census place
- Georgetown, GA
- County
- Chatham County · 271,602 people
- Metro
- Savannah, GA
- Population (ZIP)
- 57,077
- Household income
- $69,635
- Rent vs Own
- Severe rent burden
- 2575.0
Population outlook (Chatham County) Hauer SSP2
- Today (2025)
- 332,584 people
- By 2030
- 355,508 · +6.9%
- By 2040
- 400,030 · +20.3%
- By 2050
- 443,019 · +33.2%
- By 2075
- 534,579 · +60.7%
- By 2100
- 583,863 · +75.6%
Race, ethnicity, and origin ACS 2023
- Neighborhood character
- Diverse neighborhood (Simpson 0.68)
- Race & ethnicity
- White 40% Black 38% Hispanic / Latino 12% Two or more races 7% Asian 5%
- Hispanic origin (detail)
- Mexican 4% Puerto Rican 3%
- Common ancestry
- Slovak 2% Lithuanian 1% Serbian 1%
- Foreign-born
- 12% · Canada, Vietnam, South Korea
- Languages at home
- 83% English-only · Spanish 9% Other Indo-European 2% Vietnamese 1%
Political lean MEDSL · Chatham
- 2024 margin
- D (+18.0) · D 58.6% · R 40.6%
- 2008→2024 swing
- +3.6pp toward D · 2008: 14.4pp · 2024: 18.0pp
- All cycles
- 2024: D+18.0 2020: D+18.8 2016: D+14.5 2012: D+12.0 2008: D+14.4
Not yet ingested
- Civics
- —
Market trends
- HPI YoY
- ▼ -92.38%
- Current HPI
- 264.8625
- Rent YoY
- ▼ -1.44%
- Metro
- Savannah, GA
- State GDP YoY
- ▲ 2.66%
- F500 in state
- 28
Industry mix (Fortune 500 HQ in GA)
| Industry | F500 HQs | Revenue |
|---|---|---|
| Paper / Packaging | 2 | $29B |
|
||
| Retail | 1 | $160B |
|
||
| Transportation / Logistics | 1 | $91B |
|
||
| Airlines | 1 | $62B |
|
||
| Consumer Goods | 1 | $47B |
|
||
| Utilities | 1 | $25B |
|
||
Price history
+0.0% since first listed2 events — show timeline
- 2026-06-05 Listed $155,000 GAMLS
- 2026-06-05 Listed $155,000 FMLS
Property tax history
+11.1%/yrLatest (2025): $4,768 · +217.3% YoY. Source: county tax records.
Cash-flow waterfall
monthlySold comps — $/sqft
last 12 mo · ≤1 miLoading sold comps…