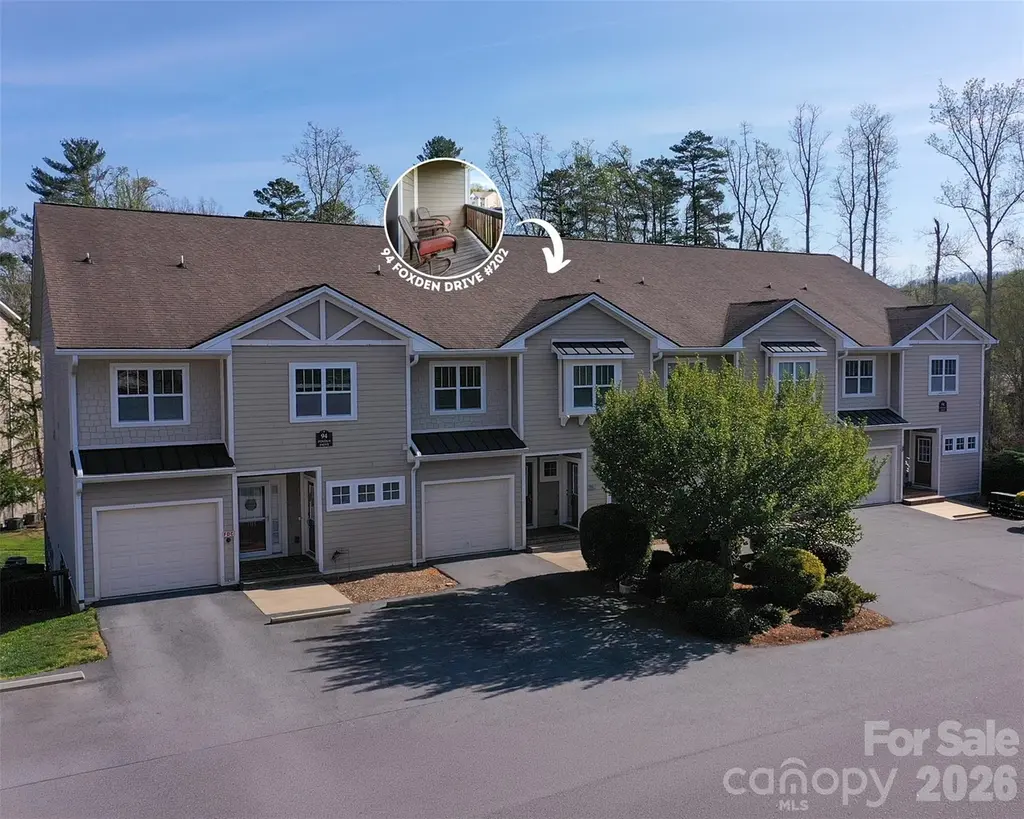
94 Foxden Dr #202 · Fletcher, NC
Flood risk 9/10 · Severe
- FEMA flood zone
- X (unshaded)
- Chance of flooding over 30 yrs
- 0.99%
- Est. flood insurance / yr
- $473 – $860
Fire risk 4/10 · Minor
- Est. fire insurance / yr
- $906 – $1,684
Heat risk 4/10 · Minor
- Hot days now (above 96°F)
- 8 days/yr
- Hot days in 30 yrs
- 22 days/yr
Wind risk 2/10 · Minimal
- Chance of severe wind over 30 yrs
- —
Air-quality risk 3/10 · Minor
- Unhealthy air days now
- 2 days/yr
- Unhealthy air days in 30 yrs
- 3 days/yr
Risk factors via First Street. Map © Google.
Why this score? — see what drove the D grade
The composite is a weighted blend of 9 inputs, each scored 0–100. Each bar is that input's sub-score; the figure is the points it added to the 100-point composite (weight × sub-score).
- Cash flow +12.3/30.0
- ARV discount +7.5/15.0
- 1% rule +4.4/10.0
- Schools +4.2/10.0
- DSCR +3.7/10.0
- Livability +3.5/5.0
- Rent growth +2.5/5.0
- Condition / age +2.5/5.0
- Appreciation +0.0/10.0
$252,900
🖨 Deal sheet 📄 Offer letter ✓ Due diligence
Listing remarks
This unit is MOVE IN ready with new carpet throughout and a well maintained interior. The community offers desirable amenities including a POOL, clubhouse, and playground, all just steps from your door. Located near Fletcher Elementary, FernLeaf Community Charter School, and Fletcher Community Park, this home is perfectly positioned for both convenience and recreation. Tucked away in a quiet, private setting at the back of the community, this well-maintained condo offers the perfect blend of comfort, convenience, and lifestyle. Enjoy peaceful surroundings with no road noise, while still being just minutes from both Asheville and Hendersonville. Bright and sunny with a split bedroom floorpla
Key facts
- $360 HOA
- Community pool
- Built 2007
Property features AI
Finance
- HOA & community: Mandatory HOA; Monthly association fee $250; Additional monthly association fee $110; Annual association expense listed; Community amenities include fitness center, outdoor pool, and playground
Exterior
- Parking: Assigned parking (1 assigned space); No main-level garage
- Utilities: City water; Public sewer
- Home design: Residential condominium; One-story (levels: One); Site built construction; Vinyl exterior
- Construction: Site built; Vinyl construction; Foundation: Other - see remarks; One story
- Exterior features: Balcony; Rear porch; Asphalt/paved road with private maintenance
Interior
- Kitchen: Dishwasher; Refrigerator
- Bedrooms: 3 bedrooms (all on the main level)
- Bathrooms: 2 full bathrooms (main level)
- Heating & cooling: Heat Pump; Ceiling Fan(s); Central Air
- Interior features: Entry level is 2; Heat Pump heating; Ceiling fans and central air conditioning
- Laundry & utility: Upper level laundry; Dryer
Neighborhood map
What this means for you Summary
Snapshot
- This is a 3-bed/2.0-bath condo listed at $253k.
Deal economics
- At list price, monthly cash flow is $-100 ($-1k/yr) — negative.
- To cash-flow at today's rent, offer at most $235k (7.0% below list).
- To meet the 1% rule (rent ≥ 1% of price), the offer needs to be $236k (6.5% below list).
- Recommended offer: $235k (7.0% below list) — sets the bar for cash-flow.
- Cap rate 6.1% vs local median 3.9% in Fletcher — top-decile yield for the area; either an underpriced asset or a hidden risk that comps aren't pricing in. Stress-test before assuming the spread holds.
Location & tenants
- Location reads 70/100 on livability (#129 in NC) — a middle-class / working-renter tenant base. Strengths: crime A+, housing A+, employment B+; Watch: amenities F, commute F, health & safety F.
- Henderson County Schools (suburban): math 48% / reading 52% proficiency, ranked #64 of 178 in NC (top 36%) — acceptable for families but not a draw, mixed tenant base, ~2y average lease.
- Zoned schools: Fletcher Elementary (math 48% / reading 47%, grade D, #490 of 1,410 statewide, top 35%, 482 students, 53% FRL); North Henderson High (math 72% / reading 58%, grade B, #161 of 535 statewide, top 30%, 1,146 students, 61% FRL).
- Market conditions: 208 active listings in the ZIP; 4 comparable units currently listed for rent nearby; rentals at typical pace (median 24d on market — plan ~3-4 weeks tenant-placement turnaround); solid renter incomes; 1,534 units permitted in Henderson County in 2024 (558 in 5+ unit buildings).
- This rent runs 35% of the median local income ($82k/yr) — at the standard rent-burdened threshold; future hikes will face affordability resistance.
Forward outlook
- Local home prices are declining (-3.0%/yr); year-one equity from $2k of loan paydown is wiped out by about $8k of value loss. Plan a longer hold.
- Henderson County population projected at +20% by 2050 — long-run rental-demand tailwind backs the buy-and-hold thesis.
Negotiation context
- It's been on market 71 days — a 6% lower offer ($238k) is reasonable based on typical stale-listing flexibility.
- Current owner paid $128k; list at $253k implies a 98% gain — meaningful room to come down on a strong offer.
Risks & watch-outs
- Watch-outs: flood insurance adds $56/mo.
- Climate carrying-cost: severe flood risk — expect insurance premiums to compound above CPI over the hold.
Questions for the listing agent
- What do current leases actually rent for vs. the listed asking? Can we see a recent rent roll and the last 12 months of T-12 income?
- It's been on market 71 days. Have you received any prior offers? Is the seller open to a 7% concession, seller financing, or rate buy-down credit?
- What's the actual annual flood-insurance premium (NFIP or private), and is the property in a SFHA with mandatory coverage?
- What does the HOA fee cover, when was the last increase, and are there any pending special assessments or reserve-fund shortfalls?
- Any open or pending special assessments — roof, HVAC, plumbing, elevator, façade? What's the per-unit balance and payoff schedule, and is the seller paying it off at close or rolling it to the buyer?
- Why hasn't it sold? Are there any deal-killer items the seller is aware of (foundation, flood, title, zoning, code violations)?
- Is there a deadline driving the sale (1031 exchange, divorce, estate, relocation)? That informs how much negotiation room exists.
- Schools are B-rated — typically a magnet for longer-tenancy family renters. What's the average tenant stay here, and is there a school-zone premium baked into asking?
- The area grade is low — what's the realistic commute time and amenity access for the typical tenant pool here? Any planned neighborhood developments (good or bad) we should know about?
- What's the average days-on-market for RENTAL listings here right now (not sales)? A rising rental-DOM trend means longer vacancies and softer asking-rent achievability than the comps imply.
- What's the recent tenant-quality profile in this submarket — average credit score on applications, eviction rate, late-payment / NSF rate, and stable-employment percentage? A property-management company in the area should have these aggregated.
- How much new apartment / multifamily construction is in the pipeline within 1–3 miles? Heavy new supply (>2% of stock underway) typically softens rents 12–24 months out; light construction supports rent growth.
Investment metrics
- 1% rule
- 0.94% ✗
- Cap rate
- 6.08%
- Cash-on-cash
- -0.75%
- DSCR
- 0.97
- GRM
- 8.9
CMA / ARV
No comps found within radius.
Projected returns pro-forma
-3.0% appreciation · 3.0% rent growth · sell at horizon
- IRR
- -19.0%
- Equity multiple
- 0.33×
- Total profit
- $-47,156
- Equity at exit
- $37,708
- IRR
- -11.4%
- Equity multiple
- 0.31×
- Total profit
- $-48,540
- Equity at exit
- $21,866
Cash invested: $70,812 (down + closing). Projections, not guarantees.
Landlord ↔ Tenant lean methodology
- Overall (STATE)
- 85 Strongly Landlord-Friendly
- State North Carolina
- 85 Strongly Landlord-Friendly · R+3
- County
- — inherits STATE
- City
- — inherits STATE
ZIP-level market 28732
- Home prices YoY
- -26.8%
- Active inventory
- 208
- Price-to-rent
- 8.9×
Monthly cashflow live
- Estimated rent
- $2,365 medium interval (Pro) →
- Mortgage (P&I)
- −$1,326
- Tax from tax record
- −$121 /mo · $1,448/yr
- Insurance
- −$105
- Flood insurance flood zone
- −$56 /mo · $666/yr
- HOA
- −$360
- Vacancy / Maint / Mgmt
- −$497
- Net cashflow
- $-100
Break-even live
UW: 25.0% down · 7.5% · 30yr · 1.5% tax · 5.0% vac · 8.0% maint · 8.0% mgmt
Financing live
Cash to close
- Down payment
- $63,225
- Closing costs
- $7,587
- Reserves months
- —
- Total cash needed
- —
Loan-product check · same deal, 3 products live
Conventional
25% down · 7.5% · 30yr
- Down + closing
- —
- Monthly P&I
- —
- Monthly cashflow
- —
- DSCR
- —
- Eligible?
- —
Personal DTI + credit; lowest rate.
DSCR
20% down · 8.5% · 30yr
- Down + closing
- —
- Monthly P&I
- —
- Monthly cashflow
- —
- DSCR
- —
- Eligible?
- —
No personal income docs; deal must DSCR.
Hard money
10% down · 12.0% · 12mo
- Down + closing
- —
- Monthly P&I
- —
- Monthly cashflow
- —
- DSCR
- —
- Eligible?
- —
Short-term bridge; refi at stabilization.
Rent comps 4 comps
| Address | Beds | Baths | Sqft | Rent | $/sqft | DOM | Units | Dist |
|---|---|---|---|---|---|---|---|---|
| 93 Foxden Dr Fletcher, NC | 3.0 | 2.0 | 1413 | $2,200 | $1.56 | 23d | 1 | 0.07mi |
| 123 Foxden Dr Fletcher, NC | 3.0 | 2.0 | 1186 | $2,100 | $1.77 | 23d | 1 | 0.07mi |
| 65 Cushion Pl Fletcher, NC | 2.0 | 1.0 | 1010 | $1,550 | $1.53 | 23d | 1 | 0.43mi |
| 1026 Thorncrest Dr Fletcher, NC | 3.0 | 2.0 | 1472 | $2,650 | $1.80 | 13d | 1 | 1.18mi |
HOA detail condo
- Monthly dues
- $360 · $4,320/yr
- Likely covers
- pool
- Assessments
- None detected in remarks — confirm with the listing agent.
Listing history 20 events
-
2026-06-18days on market $252,900 Active 71 DOM
-
2026-06-17days on market $252,900 Active 70 DOM
-
2026-06-16days on market $252,900 Active 69 DOM
-
2026-06-15days on market $252,900 Active 68 DOM
-
2026-06-14days on market $252,900 Active 66 DOM
-
2026-06-13days on market $252,900 Active 65 DOM
-
2026-06-10days on market $252,900 Active 63 DOM
-
2026-06-09days on market $252,900 Active 62 DOM
-
2026-06-08days on market $252,900 Active 61 DOM
-
2026-06-07days on market $252,900 Active 60 DOM
-
2026-06-05days on market $252,900 Active 57 DOM
-
2026-06-03days on market $252,900 Active 56 DOM
-
2026-06-02days on market $252,900 Active 55 DOM
-
2026-06-01days on market $252,900 Active 54 DOM
-
2026-05-31days on market $252,900 Active 53 DOM
-
2026-05-30days on market $252,900 Active 52 DOM
-
2026-05-12price $252,900
-
2026-04-09$255,000 Active
-
2026-04-07historical $255,000
-
2011-10-26soldstatus $128,000
ⓘ Source: listings_history table (triggers on properties + properties_extension) + one-shot
backfill from property_details.listing_events for pre-trigger history.
Tax reassessment forecast NC · Resets to sale price
- Current annual tax
- $1,448 · $121/mo
- Projected year-2 tax
- $2,074 · $173/mo
- Expected delta
- +$626/yr (+$52/mo · 43.2%)
ⓘ Screening estimate from a state-policy table — verify with the county assessor before closing.
Climate risk First Street
- Flood 9/10 Extreme FEMA zone X (unshaded) · 99% chance over 30 yrs
- Wildfire 4/10 Moderate
- Heat 4/10 Moderate 8 d/yr ≥96°F today · 22 d/yr by 30 yrs out
- Wind 2/10 Low
- Air quality 3/10 Moderate 2 unhealthy d/yr today · 3 by 30 yrs out
Nearby sold comps map
Loading sold comps map…
Walkable amenities ~0.75 mi
Loading nearby amenities…
Taxation est. · year 1
- Rental income
- $28,377
- − Mortgage interest
- −$14,166
- − Property taxes
- −$1,448
- − Insurance
- −$1,931
- − Repairs & maintenance
- −$2,270
- − Management
- −$2,270
- − HOA
- −$4,320
- − Depreciation
- −$7,357
- Taxable loss
- −$5,385
- Est. tax savings @ 24.0%
- +$1,293
- After-tax cash flow
- $97/yr
For passive investors: Depreciation is non-cash, so a rental often shows a tax loss while cash-flowing — sheltering income. Rental losses are passive: they offset passive income freely, and up to $25,000/yr can offset ordinary (W-2) income if you actively participate and your MAGI is under $100k (phasing out to $0 by $150k); unused losses carry forward. On sale, claimed depreciation is recaptured at up to 25%, and gains may owe capital-gains tax (a 1031 exchange can defer both). Figures are a year-1 estimate at your 24.0% rate — not tax advice; consult a CPA.
Schools (NCES district)
- District
- Henderson County Schools
- NCES district ID
- 3702100
- Math proficiency
- 48% ▼ -2.00%
- Reading proficiency
- 52% ▼ -2.00%
- Median HH income
- $47,101
- Composite
- 42.5/100
- National rank
- #3206
- State rank
- #64 of 178 in NC
Livability — Fletcher
- Score
- 70/100
- State rank
- #129
- US rank
- #7485
Category grades
Schools grade is shown separately in the Schools card above.
Census & demographics
- County
- Henderson County · 78,587 people
- City population
- 19,279
- Metro
- Asheville, NC
- Population (ZIP)
- 19,279
- Household income
- $81,852
- Rent vs Own
- Severe rent burden
- 154.0
Population outlook (Henderson County) Hauer SSP2
- Today (2025)
- 124,075 people
- By 2030
- 129,690 · +4.5%
- By 2040
- 139,898 · +12.8%
- By 2050
- 148,298 · +19.5%
- By 2075
- 163,980 · +32.2%
- By 2100
- 166,962 · +34.6%
Race, ethnicity, and origin ACS 2023
- Neighborhood character
- Predominantly White (82%)
- Race & ethnicity
- White 82% Hispanic / Latino 9% Two or more races 5% Black 3% Asian 2%
- Hispanic origin (detail)
- Mexican 4%
- Common ancestry
- Slovak 6% Serbian 4% Lithuanian 3%
- Foreign-born
- 7% · Canada, Vietnam
- Languages at home
- 91% English-only · Spanish 6% Other Indo-European 1% Russian/Polish/Slavic 1%
Political lean MEDSL · Henderson
- 2024 margin
- R (+14.6) · D 42.1% · R 56.7% · Other 1.1%
- 2008→2024 swing
- +6.5pp toward D · 2008: -21.0pp · 2024: -14.6pp
- All cycles
- 2024: R+14.6 2020: R+18.8 2016: R+27.9 2012: R+27.6 2008: R+21.0
Not yet ingested
- Civics
- —
Market trends
- HPI YoY
- ▼ -106.57%
- Current HPI
- 290.4589
- Rent YoY
- —
- Metro
- Asheville, NC
- State GDP YoY
- ▲ 3.28%
- F500 in state
- 26
Industry mix (Fortune 500 HQ in NC)
| Industry | F500 HQs | Revenue |
|---|---|---|
| Financial Services | 2 | $213B |
|
||
| Retail | 2 | $95B |
|
||
| Industrial Conglomerate | 1 | $38B |
|
||
| Metals / Steel | 1 | $35B |
|
||
| Utilities | 1 | $30B |
|
||
| Industrial Machinery | 1 | $19B |
|
||
Price history
+97.6% since first listed4 events — show timeline
- 2026-05-12 Price Changed $252,900 CANOPYMLS as Distributed by MLS Grid
- 2026-04-09 Listed $255,000 CANOPYMLS as Distributed by MLS Grid
- 2026-04-07 Coming Soon $255,000 CANOPYMLS as Distributed by MLS Grid
- 2011-10-26 Sold (Public Records) $128,000 Public Records
Property tax history
+5.8%/yrLatest (2025): $1,448 · +0.0% YoY. Source: county tax records.
Cash-flow waterfall
monthlySold comps — $/sqft
last 12 mo · ≤1 miLoading sold comps…