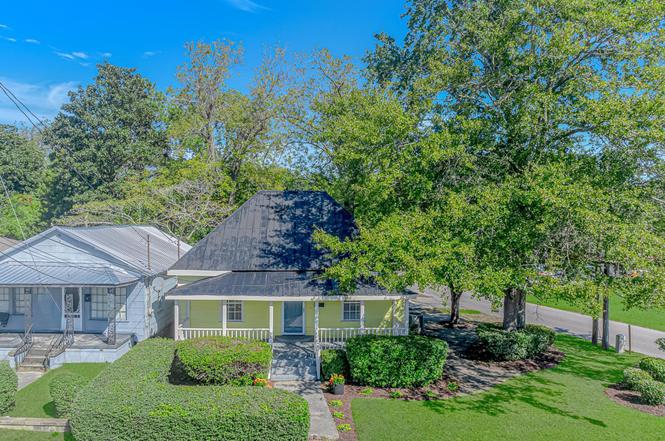
1508 Duke St · Georgetown, SC
Flood risk 4/10 · Minor
- FEMA flood zone
- X (unshaded)
- Chance of flooding over 30 yrs
- 0.22%
- Est. flood insurance / yr
- $507 – $1,088
Fire risk 3/10 · Minor
- Est. fire insurance / yr
- $783 – $1,453
Heat risk 9/10 · Severe
- Hot days now (above 108°F)
- 7 days/yr
- Hot days in 30 yrs
- 18 days/yr
Wind risk 8/10 · Major
- Chance of severe wind over 30 yrs
- 99.0%
Air-quality risk 2/10 · Minimal
- Unhealthy air days now
- 0 days/yr
- Unhealthy air days in 30 yrs
- 1 days/yr
Risk factors via First Street. Map © Google.
Why this score? — see what drove the F grade
The composite is a weighted blend of 9 inputs, each scored 0–100. Each bar is that input's sub-score; the figure is the points it added to the 100-point composite (weight × sub-score).
- ARV discount +7.5/15.0
- Cash flow +7.1/30.0
- Livability +3.2/5.0
- Schools +2.7/10.0
- Rent growth +2.5/5.0
- Condition / age +2.5/5.0
- DSCR +1.3/10.0
- 1% rule +1.1/10.0
- Appreciation +0.0/10.0
$265,000
🖨 Deal sheet 📄 Offer letter ✓ Due diligence
Listing remarks
Two Distinct Turnkey Homes on One Lot — Walk to Historic Downtown Georgetown! Experience the charm and flexibility of owning two beautifully maintained homes on one property, each with its own address and endless lifestyle or income possibilities. Property Highlights • Two homes on one tax lot – both with separate addresses • Main House: 3 bedrooms, 2 baths, approx. 1,104 sq. ft. , built in 1930 • Guest Cottage: 2 bedrooms, 1 bath, approx. 752 sq. ft. • Both homes freshly painted and professionally cleaned • Spacious carport and ample parking for residents and guests • Room for a small boat — perfect for coastal living • Private setting w
Key facts
- Separate addresses
- Ample parking
- Two homes on one lot
Tags
Property features AI
Finance
- Other: For sale
- HOA & community: Monthly association fee
Exterior
- Parking: Carport; 7 parking spaces total
- Security: Smoke detectors
- Utilities: Public water; Sewer available; Electricity available; Natural gas available; Cable available; Phone service available
- Home design: Single-story home; Wood-frame construction; Resale property; Crawlspace foundation; Zoned residential
- Construction: Wood frame construction; Crawlspace foundation
- Exterior features: Front porch; Fence; Storage
Interior
- Kitchen: Microwave; Range; Range hood; Refrigerator; Kitchen exhaust fan
- Bedrooms: At least one bedroom on the main level
- Flooring: Tile
- Bathrooms: 3 full bathrooms
- Heating & cooling: Central heating (gas); Central air conditioning
- Interior features: Ceiling fans; Main-level primary bedroom; Tub/shower
- Laundry & utility: Washer hookup
Neighborhood map
What this means for you Summary
Snapshot
- This is a 2-bed/1.0-bath single-family listed at $265k.
Deal economics
- At list price, monthly cash flow is $-382 ($-5k/yr) — negative.
- To cash-flow at today's rent, offer at most $198k (25.4% below list).
- To meet the 1% rule (rent ≥ 1% of price), the offer needs to be $163k (38.6% below list).
- Recommended offer: $163k (38.6% below list) — sets the bar for 1% rule.
Location & tenants
- Location reads 65/100 on livability (#141 in SC) — a middle-class / working-renter tenant base. Strengths: cost of living A+, housing A+, health & safety A+; Watch: amenities D, schools F, crime F.
- Georgetown 01 (town): math 26% / reading 38% proficiency, ranked #51 of 80 in SC (top 64%) — families likely to look elsewhere, expect single-tenant / working-renter base with shorter leases.
- Market conditions: 409 active listings in the ZIP; 5 comparable units currently listed for rent nearby; rentals at typical pace (median 14d on market — plan ~3-4 weeks tenant-placement turnaround); 323 units permitted in Georgetown County in 2024 (0 in 5+ unit buildings).
Forward outlook
- Local home prices are declining (-3.0%/yr); year-one equity from $2k of loan paydown is wiped out by about $8k of value loss. Plan a longer hold.
Negotiation context
- It's been on market 208 days — a 12% lower offer ($233k) is reasonable based on typical stale-listing flexibility.
- 2 sale attempts; this cycle's ask has dropped $15k (5%) from the opening price — seller is motivated, your offer sets the floor, not the list.
Risks & watch-outs
- Watch-outs: built in 1930 — expect roof / HVAC / electrical / plumbing capex.
- Climate carrying-cost: severe wind risk, 99% chance of damaging wind over 30y; extreme-heat days projected 7→18/yr by 2055 (HVAC capex compounding) — expect insurance premiums to compound above CPI over the hold.
Questions for the listing agent
- What do current leases actually rent for vs. the listed asking? Can we see a recent rent roll and the last 12 months of T-12 income?
- It's been on market 208 days. Have you received any prior offers? Is the seller open to a 39% concession, seller financing, or rate buy-down credit?
- Built in 1930 — when were the roof, HVAC, electrical panel, plumbing, and water heater last replaced?
- Why hasn't it sold? Are there any deal-killer items the seller is aware of (foundation, flood, title, zoning, code violations)?
- Is there a deadline driving the sale (1031 exchange, divorce, estate, relocation)? That informs how much negotiation room exists.
- Schools are F-rated, which usually means shorter tenancies and higher turnover. Who's the typical renter profile here, and what's been the actual vacancy rate?
- Crime grade is F in this area — have there been break-ins, vandalism, or insurance claims at this property in the last 3 years? What carrier currently insures it and at what premium?
- The area grade is low — what's the realistic commute time and amenity access for the typical tenant pool here? Any planned neighborhood developments (good or bad) we should know about?
- What's the average days-on-market for RENTAL listings here right now (not sales)? A rising rental-DOM trend means longer vacancies and softer asking-rent achievability than the comps imply.
- What's the recent tenant-quality profile in this submarket — average credit score on applications, eviction rate, late-payment / NSF rate, and stable-employment percentage? A property-management company in the area should have these aggregated.
- How much new for-sale + rental construction is in the pipeline within 1–3 miles? Heavy new supply typically softens prices + rents 12–24 months out; constrained supply supports both.
Investment metrics
- 1% rule
- 0.61% ✗
- Cap rate
- 4.56%
- Cash-on-cash
- -6.17%
- DSCR
- 0.73
- GRM
- 13.6
CMA / ARV
No comps found within radius.
Projected returns pro-forma
-3.0% appreciation · 3.0% rent growth · sell at horizon
- IRR
- -27.0%
- Equity multiple
- 0.09×
- Total profit
- $-67,331
- Equity at exit
- $39,512
- IRR
- -24.8%
- Equity multiple
- -0.22×
- Total profit
- $-90,248
- Equity at exit
- $22,912
Cash invested: $74,200 (down + closing). Projections, not guarantees.
Landlord ↔ Tenant lean methodology
- Overall (STATE)
- 90 Strongly Landlord-Friendly
- State South Carolina
- 90 Strongly Landlord-Friendly · R+6
- County
- — inherits STATE
- City
- — inherits STATE
ZIP-level market 29440
- Home prices YoY
- -34.9%
- Active inventory
- 409
- Price-to-rent
- 13.6×
Monthly cashflow live
- Estimated rent
- $1,628 high interval (Pro) →
- Mortgage (P&I)
- −$1,390
- Tax from tax record
- −$168 /mo · $2,011/yr
- Insurance
- −$110
- HOA
- −$0
- Vacancy / Maint / Mgmt
- −$342
- Net cashflow
- $-382
Break-even live
UW: 25.0% down · 7.5% · 30yr · 1.5% tax · 5.0% vac · 8.0% maint · 8.0% mgmt
Financing live
Cash to close
- Down payment
- $66,250
- Closing costs
- $7,950
- Reserves months
- —
- Total cash needed
- —
Loan-product check · same deal, 3 products live
Conventional
25% down · 7.5% · 30yr
- Down + closing
- —
- Monthly P&I
- —
- Monthly cashflow
- —
- DSCR
- —
- Eligible?
- —
Personal DTI + credit; lowest rate.
DSCR
20% down · 8.5% · 30yr
- Down + closing
- —
- Monthly P&I
- —
- Monthly cashflow
- —
- DSCR
- —
- Eligible?
- —
No personal income docs; deal must DSCR.
Hard money
10% down · 12.0% · 12mo
- Down + closing
- —
- Monthly P&I
- —
- Monthly cashflow
- —
- DSCR
- —
- Eligible?
- —
Short-term bridge; refi at stabilization.
Rent comps 5 comps
| Address | Beds | Baths | Sqft | Rent | $/sqft | DOM | Units | Dist |
|---|---|---|---|---|---|---|---|---|
| 1625 Front St Unit C Georgetown, SC | 2.0 | 1.0 | 900 | $1,600 | $1.78 | 14d | 1 | 0.37mi |
| 1028 Duke St Georgetown, SC | 2.0 | 2.0 | 990 | $1,750 | $1.77 | 23d | 1 | 0.41mi |
| 1021 Duke St Unit A Georgetown, SC | 2.0 | 1.0 | 950 | $1,600 | $1.68 | 23d | 1 | 0.42mi |
| 1004 Charlotte St Georgetown, SC | 1.0–3.0 | 1.0–2.0 | 926 | $1,728 | $1.86 | 12d | 4 | 0.93mi |
| 2801 Church St Georgetown, SC | 2.0–3.0 | 1.0–2.0 | 941 | $1,299 | $1.38 | 3d | 6 | 1.33mi |
Listing history 16 events
-
2026-06-07statusdays on market $265,000 Pending 208 DOM
-
2026-06-03days on market $265,000 Active Under Contract 206 DOM
-
2026-06-02days on market $265,000 Active Under Contract 205 DOM
-
2026-06-01days on market $265,000 Active Under Contract 204 DOM
-
2026-05-31days on market $265,000 Active Under Contract 203 DOM
-
2026-05-30days on market $265,000 Active Under Contract 202 DOM
-
2026-04-14historical Active Under Contract
-
2026-03-30status Active
-
2026-03-30price $265,000
-
2026-03-24historical
-
2026-02-27price $255,000
-
2026-02-17price $259,000
-
2026-01-30price $268,900
-
2025-12-30price $275,700
-
2025-12-02price $275,900
-
2025-11-03$279,900 Active
ⓘ Source: listings_history table (triggers on properties + properties_extension) + one-shot
backfill from property_details.listing_events for pre-trigger history.
Tax reassessment forecast SC · Resets to sale price
- Current annual tax
- $2,011 · $168/mo
- Projected year-2 tax
- $2,011 · $168/mo
- Expected delta
- $0/yr ($0/mo · 0.0%)
ⓘ Screening estimate from a state-policy table — verify with the county assessor before closing.
Climate risk First Street
- Flood 4/10 Moderate FEMA zone X (unshaded) · 22% chance over 30 yrs
- Wildfire 3/10 Moderate
- Heat 9/10 Extreme 7 d/yr ≥108°F today · 18 d/yr by 30 yrs out
- Wind 8/10 Severe 99% chance of damaging wind over 30 yrs
- Air quality 2/10 Low 0 unhealthy d/yr today · 1 by 30 yrs out
Nearby sold comps map
Loading sold comps map…
Walkable amenities ~0.75 mi
Loading nearby amenities…
Taxation est. · year 1
- Rental income
- $19,534
- − Mortgage interest
- −$14,844
- − Property taxes
- −$2,011
- − Insurance
- −$1,325
- − Repairs & maintenance
- −$1,563
- − Management
- −$1,563
- − Depreciation
- −$7,709
- Taxable loss
- −$9,481
- Est. tax savings @ 24.0%
- +$2,276
- After-tax cash flow
- $-2,306/yr
For passive investors: Depreciation is non-cash, so a rental often shows a tax loss while cash-flowing — sheltering income. Rental losses are passive: they offset passive income freely, and up to $25,000/yr can offset ordinary (W-2) income if you actively participate and your MAGI is under $100k (phasing out to $0 by $150k); unused losses carry forward. On sale, claimed depreciation is recaptured at up to 25%, and gains may owe capital-gains tax (a 1031 exchange can defer both). Figures are a year-1 estimate at your 24.0% rate — not tax advice; consult a CPA.
Schools (NCES district)
- District
- Georgetown 01
- NCES district ID
- 4502280
- Math proficiency
- 26% ▼ -11.00%
- Reading proficiency
- 38% ▼ -5.00%
- Median HH income
- $43,045
- Composite
- 27.15/100
- National rank
- #7030
- State rank
- #51 of 80 in SC
Livability — Georgetown
- Score
- 65/100
- State rank
- #141
- US rank
- #13446
Category grades
Schools grade is shown separately in the Schools card above.
Census & demographics
- Census place
- Georgetown, SC
- Population (ZIP)
- 26,419
Population outlook (Georgetown County) Hauer SSP2
- Today (2025)
- 63,275 people
- By 2030
- 63,630 · +0.6%
- By 2040
- 63,130 · -0.2%
- By 2050
- 61,904 · -2.2%
- By 2075
- 59,305 · -6.3%
- By 2100
- 53,852 · -14.9%
Race, ethnicity, and origin ACS 2023
- Neighborhood character
- Majority White (52%)
- Race & ethnicity
- White 52% Black 45% Hispanic / Latino 2%
- Common ancestry
- Italian 3% Lithuanian 2% Slovak 1%
- Foreign-born
- 3% · Canada
- Languages at home
- 97% English-only · Spanish 2%
Political lean MEDSL · Georgetown
- 2024 margin
- R (+19.5) · D 39.6% · R 59.1% · Other 1.2%
- 2008→2024 swing
- -14.2pp toward R · 2008: -5.2pp · 2024: -19.5pp
- All cycles
- 2024: R+19.5 2020: R+12.7 2016: R+13.0 2012: R+7.6 2008: R+5.2
Not yet ingested
- Civics
- —
Market trends
- HPI YoY
- ▼ -111.84%
- Current HPI
- 208.6792
- Rent YoY
- —
- Metro
- —
- State GDP YoY
- ▲ 4.51%
- F500 in state
- 2
Industry mix (Fortune 500 HQ in SC)
| Industry | F500 HQs | Revenue |
|---|---|---|
| Packaging | 1 | $7B |
|
||
Price history
-5.3% since first listed10 events — show timeline
- 2026-04-14 Contingent — CCAR
- 2026-03-30 Relisted — CCAR
- 2026-03-30 Price Changed $265,000 CCAR
- 2026-03-24 Listing Removed — CCAR
- 2026-02-27 Price Changed $255,000 CCAR
- 2026-02-17 Price Changed $259,000 CCAR
- 2026-01-30 Price Changed $268,900 CCAR
- 2025-12-30 Price Changed $275,700 CCAR
- 2025-12-02 Price Changed $275,900 CCAR
- 2025-11-03 Listed $279,900 CCAR
Property tax history
+4.2%/yrLatest (2025): $2,011 · +8.8% YoY. Source: county tax records.
Cash-flow waterfall
monthlySold comps — $/sqft
last 12 mo · ≤1 miLoading sold comps…