7646 Varo Gln · San Antonio, TX
Flood risk No data
- FEMA flood zone
- —
- Chance of flooding over 30 yrs
- —
- Est. flood insurance / yr
- —
Fire risk No data
- Est. fire insurance / yr
- —
Heat risk No data
- Hot days now (above threshold)
- —
- Hot days in 30 yrs
- —
Wind risk No data
- Chance of severe wind over 30 yrs
- —
Air-quality risk No data
- Unhealthy air days now
- —
- Unhealthy air days in 30 yrs
- —
Risk factors via First Street. Map © Google.
Why this score? — see what drove the F grade
The composite is a weighted blend of 9 inputs, each scored 0–100. Each bar is that input's sub-score; the figure is the points it added to the 100-point composite (weight × sub-score).
- Cash flow +8.2/30.0
- ARV discount +7.5/15.0
- Livability +4.0/5.0
- Condition / age +4.0/5.0
- 1% rule +3.3/10.0
- Rent growth +2.5/5.0
- DSCR +2.2/10.0
- Schools +1.9/10.0
- Appreciation +0.0/10.0
$175,999
🖨 Deal sheet (PDF) 📄 Offer letter ✓ Due diligence
Listing remarks MLS
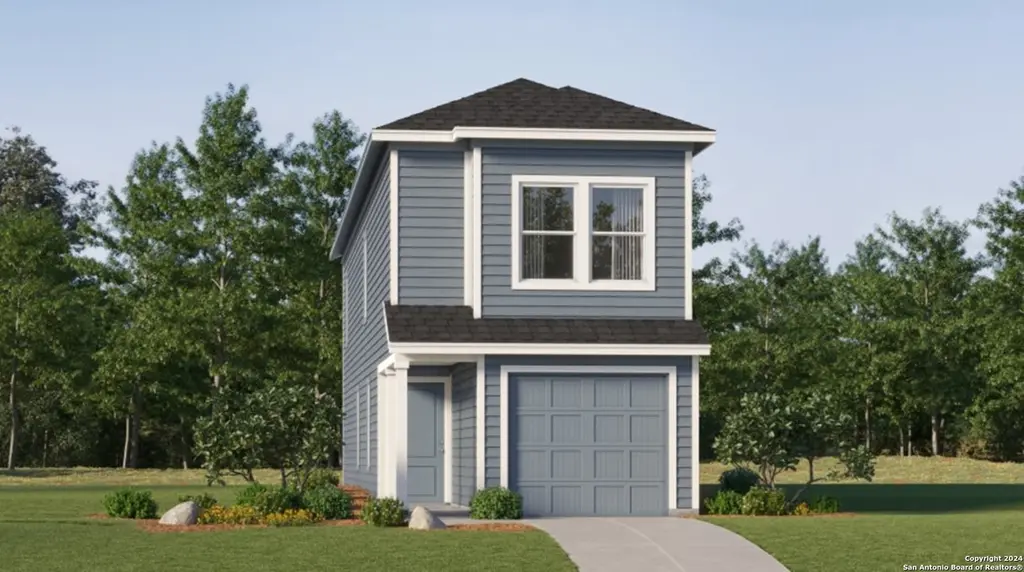
The Cibola - Upon entry of this new two-story home is a well-equipped kitchen, dining area and family room arranged in a desirable open floorplan that promotes seamless transitions between spaces. The second level showcases all four bedrooms to provide restful retreats, including the owner's suite with an adjoining bathroom and walk-in closet. Completing the home is a practical garage for storage space. Estimated Completion May 2026. The completion date, prices and features may vary and are subject to change. Please verify with Lennar directly. Photos are for illustrative purposes only.
Key facts
- 4,791 sq ft lot
- Garage
- Community pool
Neighborhood map
What this means for you Summary
Snapshot
- This is a 4-bed/2.5-bath townhouse listed at $176k. Condition is rated good.
Deal economics
- At list price, monthly cash flow is $-167 ($-2k/yr) — negative.
- To cash-flow at today's rent, offer at most $152k (13.7% below list).
- To meet the 1% rule (rent ≥ 1% of price), the offer needs to be $146k (16.9% below list).
- Recommended offer: $146k (16.9% below list) — sets the bar for 1% rule.
- Cap rate 5.2% vs local median 3.8% in San Antonio — top-decile yield for the area; either an underpriced asset or a hidden risk that comps aren't pricing in. Stress-test before assuming the spread holds.
Location & tenants
- Location reads 80/100 on livability (#31 in TX, #1,616 nationally) — a professional / high-income tenant draw. Strengths: amenities A+, commute A+, cost of living A+; Watch: crime F.
- East Central ISD (rural): math 16% / reading 25% proficiency, ranked #758 of 826 in TX (top 92%) — low school quality limits family demand, transient renter base, plan for 1-2y turnover; 61% free/reduced lunch — lower-income household profile, screen leases tightly.
- Zoned schools: Sinclair El (math 13% / reading 20%, grade F, #3,946 of 4,322 statewide, top 92%, 721 students, 71% FRL); East Central Heritage Middle (math 11% / reading 26%, grade F, #1,478 of 1,662 statewide, top 90%, 1,120 students, 44% FRL); East Central H S (math 21% / reading 28%, grade F, #1,264 of 1,632 statewide, top 82%, 3,252 students, 52% FRL).
- Market conditions: 289 active listings in the ZIP; 7 comparable units currently listed for rent nearby; rentals lingering (median 46d on market — plan ~5-8 weeks vacancy on turnover, expect pricing pressure); 57% of comp listings sitting > 30 days — soft ceiling on asking rent; 8,308 units permitted in Bexar County in 2024 (2,506 in 5+ unit buildings).
Forward outlook
- Local home prices are declining (-3.0%/yr); year-one equity from $1k of loan paydown is wiped out by about $5k of value loss. Plan a longer hold.
- Bexar County population projected at +50% by 2050 — long-run rental-demand tailwind backs the buy-and-hold thesis.
Negotiation context
- It's been on market 59 days — a 3% lower offer ($171k) is reasonable based on typical stale-listing flexibility.
Questions for the listing agent
- What do current leases actually rent for vs. the listed asking? Can we see a recent rent roll and the last 12 months of T-12 income?
- It's been on market 59 days. Have you received any prior offers? Is the seller open to a 17% concession, seller financing, or rate buy-down credit?
- What does the HOA fee cover, when was the last increase, and are there any pending special assessments or reserve-fund shortfalls?
- Is there a deadline driving the sale (1031 exchange, divorce, estate, relocation)? That informs how much negotiation room exists.
- Crime grade is F in this area — have there been break-ins, vandalism, or insurance claims at this property in the last 3 years? What carrier currently insures it and at what premium?
- The area grade is low — what's the realistic commute time and amenity access for the typical tenant pool here? Any planned neighborhood developments (good or bad) we should know about?
- What's the average days-on-market for RENTAL listings here right now (not sales)? A rising rental-DOM trend means longer vacancies and softer asking-rent achievability than the comps imply.
- What's the recent tenant-quality profile in this submarket — average credit score on applications, eviction rate, late-payment / NSF rate, and stable-employment percentage? A property-management company in the area should have these aggregated.
- How much new for-sale + rental construction is in the pipeline within 1–3 miles? Heavy new supply typically softens prices + rents 12–24 months out; constrained supply supports both.
Investment metrics
- 1% rule
- 0.83% ✗
- Cap rate
- 5.16%
- Cash-on-cash
- -4.06%
- DSCR
- 0.82
- GRM
- 10.0
CMA / ARV
No comps found within radius.
Projected returns pro-forma
-3.0% appreciation · 3.0% rent growth · sell at horizon
- IRR
- -23.1%
- Equity multiple
- 0.21×
- Total profit
- $-39,061
- Equity at exit
- $26,242
- IRR
- -17.5%
- Equity multiple
- 0.04×
- Total profit
- $-47,346
- Equity at exit
- $15,217
Cash invested: $49,280 (down + closing). Projections, not guarantees.
Landlord ↔ Tenant lean methodology
- Overall (STATE)
- 87 Strongly Landlord-Friendly
- State Texas
- 87 Strongly Landlord-Friendly · R+5
- County
- — inherits STATE
- City
- — inherits STATE
ZIP-level market 78263
- Home prices YoY
- -8.1%
- Active inventory
- 289
- Price-to-rent
- 10.0×
Monthly cashflow live
- Estimated rent
- $1,463 high interval (Pro) →
- Mortgage (P&I)
- −$923
- Tax est. 1.5%
- −$220 /mo · $2,640/yr
- Insurance
- −$73
- HOA
- −$106
- Vacancy / Maint / Mgmt
- −$307
- Net cashflow
- $-167
Break-even live
Sensitivity live
| Price | -10% $-45 | -5% $-106 | +0% $-167 | +5% $-228 | +10% $-289 |
|---|---|---|---|---|---|
| Rent | -10% $-282 | -5% $-225 | +0% $-167 | +5% $-109 | +10% $-51 |
| Rate | -1.0pp $-78 | -0.5pp $-122 | base $-167 | +0.5pp $-212 | +1.0pp $-259 |
UW: 25.0% down · 7.5% · 30yr · 1.5% tax · 5.0% vac · 8.0% maint · 8.0% mgmt
Financing live
Cash to close
- Down payment
- $44,000
- Closing costs
- $5,280
- Reserves months
- —
- Total cash needed
- —
Loan-product check · same deal, 3 products live
Conventional
25% down · 7.5% · 30yr
- Down + closing
- —
- Monthly P&I
- —
- Monthly cashflow
- —
- DSCR
- —
- Eligible?
- —
Personal DTI + credit; lowest rate.
DSCR
20% down · 8.5% · 30yr
- Down + closing
- —
- Monthly P&I
- —
- Monthly cashflow
- —
- DSCR
- —
- Eligible?
- —
No personal income docs; deal must DSCR.
Hard money
10% down · 12.0% · 12mo
- Down + closing
- —
- Monthly P&I
- —
- Monthly cashflow
- —
- DSCR
- —
- Eligible?
- —
Short-term bridge; refi at stabilization.
Rent comps 7 comps
| Address | Beds | Baths | Sqft | Rent | $/sqft | DOM | Units | Dist |
|---|---|---|---|---|---|---|---|---|
| 6530 Dali Bnd San Antonio, TX | 3.0 | 2.5 | 1360 | $1,550 | $1.14 | 45d | 1 | 0.03mi |
| 6538 Dali Bnd San Antonio, TX | 3.0 | 2.5 | 1189 | $1,295 | $1.09 | 16d | 1 | 0.05mi |
| 7649 Barcelo Way San Antonio, TX | 4.0 | 2.5 | 1535 | $1,547 | $1.01 | 45d | 1 | 0.05mi |
| 6609 Dali Bnd San Antonio, TX | 3.0 | 2.5 | 1189 | $1,375 | $1.16 | 45d | 1 | 0.06mi |
| 7316 Green Sapphire San Antonio, TX | 4.0 | 2.0 | 1600 | $1,750 | $1.09 | 23d | 1 | 1.00mi |
| 7358 Orange Sapphire San Antonio, TX | 4.0 | 2.0 | 1483 | $1,545 | $1.04 | 0d | 1 | 1.13mi |
| 8511 Opal Pl San Antonio, TX | 3.0 | 2.0 | 1375 | $1,475 | $1.07 | 45d | 1 | 1.20mi |
HOA detail
- Monthly dues
- $106 · $1,272/yr
Listing history 3 events
-
2026-05-07status Pending 593-char remark
Show marketing remark (593 chars)
The Cibola - Upon entry of this new two-story home is a well-equipped kitchen, dining area and family room arranged in a desirable open floorplan that promotes seamless transitions between spaces. The second level showcases all four bedrooms to provide restful retreats, including the owner's suite with an adjoining bathroom and walk-in closet. Completing the home is a practical garage for storage space. Estimated Completion May 2026. The completion date, prices and features may vary and are subject to change. Please verify with Lennar directly. Photos are for illustrative purposes only.
-
2026-03-12price $175,999 593-char remark
Show marketing remark (593 chars)
The Cibola - Upon entry of this new two-story home is a well-equipped kitchen, dining area and family room arranged in a desirable open floorplan that promotes seamless transitions between spaces. The second level showcases all four bedrooms to provide restful retreats, including the owner's suite with an adjoining bathroom and walk-in closet. Completing the home is a practical garage for storage space. Estimated Completion May 2026. The completion date, prices and features may vary and are subject to change. Please verify with Lennar directly. Photos are for illustrative purposes only.
-
2026-03-09$173,999 New 593-char remark
Show marketing remark (593 chars)
The Cibola - Upon entry of this new two-story home is a well-equipped kitchen, dining area and family room arranged in a desirable open floorplan that promotes seamless transitions between spaces. The second level showcases all four bedrooms to provide restful retreats, including the owner's suite with an adjoining bathroom and walk-in closet. Completing the home is a practical garage for storage space. Estimated Completion May 2026. The completion date, prices and features may vary and are subject to change. Please verify with Lennar directly. Photos are for illustrative purposes only.
ⓘ Source: listings_history table (triggers on properties + properties_extension) + one-shot
backfill from property_details.listing_events for pre-trigger history.
Nearby sold comps map
Loading sold comps map…
Walkable amenities ~0.75 mi
Loading nearby amenities…
Taxation est. · year 1
- Rental income
- $17,550
- − Mortgage interest
- −$9,859
- − Property taxes
- −$2,640
- − Insurance
- −$880
- − Repairs & maintenance
- −$1,404
- − Management
- −$1,404
- − HOA
- −$1,272
- − Depreciation
- −$5,120
- Taxable loss
- −$5,028
- Est. tax savings @ 24.0%
- +$1,207
- After-tax cash flow
- $-796/yr
For passive investors: Depreciation is non-cash, so a rental often shows a tax loss while cash-flowing — sheltering income. Rental losses are passive: they offset passive income freely, and up to $25,000/yr can offset ordinary (W-2) income if you actively participate and your MAGI is under $100k (phasing out to $0 by $150k); unused losses carry forward. On sale, claimed depreciation is recaptured at up to 25%, and gains may owe capital-gains tax (a 1031 exchange can defer both). Figures are a year-1 estimate at your 24.0% rate — not tax advice; consult a CPA.
Condition & rehab AI · 12 photos
This two-story townhouse is in excellent condition with a modern and well-maintained interior and exterior. It offers a spacious open floor plan and is move-in ready.
Value-add opportunities
- Both Painting the exterior and interior walls — Fresh paint can enhance curb appeal and interior aesthetics.
- Both Landscaping improvements — Enhanced landscaping can improve curb appeal and attract potential buyers/tenants.
- Both Adding smart home features — Smart home features can increase convenience and appeal to tech-savvy buyers/tenants.
- Both Upgrading the kitchen appliances — Modern appliances can make the kitchen more functional and attractive to potential buyers/tenants.
Renovation cost estimate screening
Value-add ROI direction
- Both Painting the exterior and interior walls — Fresh paint can enhance curb appeal and interior aesthetics. ↑
- Both Landscaping improvements — Enhanced landscaping can improve curb appeal and attract potential buyers/tenants. ↑
- Both Adding smart home features — Smart home features can increase convenience and appeal to tech-savvy buyers/tenants. ↑
- Both Upgrading the kitchen appliances — Modern appliances can make the kitchen more functional and attractive to potential buyers/tenants. ↑
ⓘ Cost ranges are severity-bucket heuristics (US national rule-of-thumb). Get contractor quotes + a written scope before underwriting a rehab budget.
Schools (NCES district)
- District
- East Central ISD
- NCES district ID
- 4817850
- Math proficiency
- 16% ▼ -12.00%
- Reading proficiency
- 25% ▼ -6.00%
- Median HH income
- $53,941
- Composite
- 18.67/100
- National rank
- #8887
- State rank
- #758 of 826 in TX
Livability — San Antonio
- Score
- 80/100
- State rank
- #31
- US rank
- #1616
Category grades
Schools grade is shown separately in the Schools card above.
Census & demographics
- City population
- 1,806,925
- Population (ZIP)
- 4,514
Population outlook (Bexar County) Hauer SSP2
- Today (2025)
- 2,336,851 people
- By 2030
- 2,560,728 · +9.6%
- By 2040
- 3,020,569 · +29.3%
- By 2050
- 3,493,522 · +49.5%
- By 2075
- 4,668,459 · +99.8%
- By 2100
- 5,533,242 · +136.8%
Race, ethnicity, and origin ACS 2023
- Neighborhood character
- Diverse neighborhood (Simpson 0.61)
- Race & ethnicity
- Hispanic / Latino 45% White 43% Two or more races 24% Black 10%
- Hispanic origin (detail)
- Mexican 35% Puerto Rican 2% Dominican 2%
- Common ancestry
- Romanian 9% Iranian 1% Scotch-Irish 1%
- Foreign-born
- 10% · Canada, Dominican Republic
- Languages at home
- 71% English-only · Spanish 29%
Political lean MEDSL · Bexar
- 2024 margin
- Lean D (+9.8) · D 54.3% · R 44.6% · Other 1.1%
- 2008→2024 swing
- +4.2pp toward D · 2008: 5.6pp · 2024: 9.8pp
- All cycles
- 2024: D+9.8 2020: D+18.2 2016: D+13.5 2012: D+4.6 2008: D+5.6
Not yet ingested
- Civics
- —
Market trends
- HPI YoY
- ▼ -28.29%
- Current HPI
- 322.4738
- Rent YoY
- —
- Metro
- —
- State GDP YoY
- ▲ 3.95%
- F500 in state
- 110
Industry mix (Fortune 500 HQ in TX)
| Industry | F500 HQs | Revenue |
|---|---|---|
| Energy | 16 | $1,198B |
|
||
| Technology | 5 | $198B |
|
||
| Engineering / Construction | 4 | $72B |
|
||
| Energy Services | 3 | $60B |
|
||
| Utilities | 3 | $41B |
|
||
| Healthcare | 2 | $330B |
|
||
Price history
+1.1% since first listed3 events — show timeline
- 2026-05-07 Pending — LERA
- 2026-03-12 Price Changed $175,999 LERA
- 2026-03-09 Listed $173,999 LERA
Cash-flow waterfall
monthlySold comps — $/sqft
last 12 mo · ≤1 miLoading sold comps…