 🏗️ New Construction
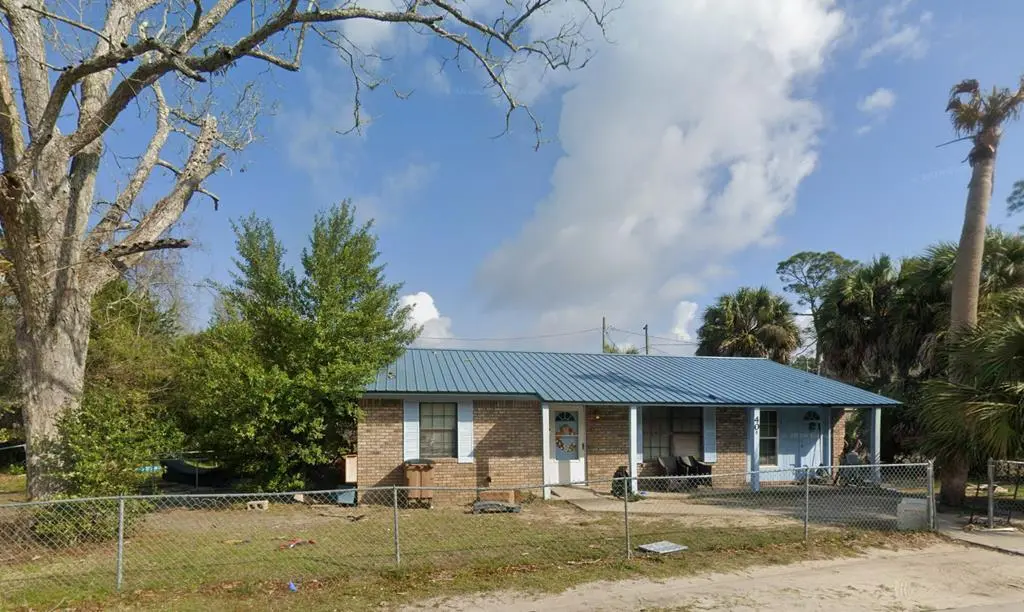
405 Ave A · Port St. Joe, FL
Flood risk 1/10 · Minimal
- FEMA flood zone
- X (unshaded)
- Chance of flooding over 30 yrs
- 0.0%
- Est. flood insurance / yr
- $507 – $1,088
Fire risk 5/10 · Moderate
- Est. fire insurance / yr
- $947 – $1,759
Heat risk 10/10 · Severe
- Hot days now (above 105°F)
- 7 days/yr
- Hot days in 30 yrs
- 22 days/yr
Wind risk 10/10 · Severe
- Chance of severe wind over 30 yrs
- 99.0%
Air-quality risk 1/10 · Minimal
- Unhealthy air days now
- 0 days/yr
- Unhealthy air days in 30 yrs
- 0 days/yr
Risk factors via First Street. Map © Google.
Why this score? — see what drove the F grade
The composite is a weighted blend of 9 inputs, each scored 0–100. Each bar is that input's sub-score; the figure is the points it added to the 100-point composite (weight × sub-score).
- ARV discount +7.5/15.0
- Cash flow +5.1/30.0
- Schools +3.9/10.0
- Rent growth +2.5/5.0
- Livability +2.5/5.0
- Condition / age +2.5/5.0
- 1% rule +0.0/10.0
- DSCR +0.0/10.0
- Appreciation +0.0/10.0
$159,900
🖨 Deal sheet 📄 Offer letter ✓ Due diligence
Listing remarks
Welcome to your slice of paradise in the heart of Port St. Joe! Located just minutes from the sugar-white sands of the Gulf, this well-positioned property at 405 Avenue A offers the perfect blend of coastal living, convenience, and immediate income potential. This home features a welcoming layout filled with natural light, creating a bright and airy coastal feel throughout. Whether you're looking for a full-time residence, vacation getaway, or a smart investment property, this opportunity stands out. Currently tenant-occupied with renters paying $1,000/month, providing instant cash flow for investors or the option to continue leasing while planning future use. Enjoy being just a golf cart r
Key facts
- Golf cart ride
- Tenant occupied
- Cash flow
Tags
Property features AI
Finance
- Other: Property type: Residential
Exterior
- Parking: Driveway with space for 4 vehicles
- Utilities: Public water; Public sewer; Water connected; Sewer connected; Cable available
- Home design: Single-family detached residence; New construction; One story
- Construction: Brick construction; Metal roof; Slab foundation; Built as new construction
- Exterior features: Corner lot; City street frontage; Direction to property: from Hwy 98 turn left on Avenue A; home is located on the left toward end of road; Located in the St Joe Heights subdivision
Interior
- Bathrooms: 1 full bathroom
- Interior features: Smoke detector(s)
Neighborhood map
What this means for you Summary
Snapshot
- This is a 2-bed/1.0-bath single-family listed at $160k.
Deal economics
- At list price, monthly cash flow is $-760 ($-9k/yr) — negative.
- The deal already cash-flows at list — no discount required.
- To meet the 1% rule (rent ≥ 1% of price), the offer needs to be $157k (1.6% below list).
- Recommended offer: $150k (6.0% below list) — sets the bar for market timing.
- Cap rate 3.5% vs local median 1.4% in Port St. Joe — top-decile yield for the area; either an underpriced asset or a hidden risk that comps aren't pricing in. Stress-test before assuming the spread holds.
Location & tenants
- Location reads: area grade F — affects rentability + tenant quality, not the cash-flow math above.
- Gulf (rural): math 47% / reading 45% proficiency, ranked #49 of 73 in FL (top 67%) — families likely to look elsewhere, expect single-tenant / working-renter base with shorter leases.
- Market conditions: 1028 active listings in the ZIP; 302 units permitted in Gulf County in 2024 (0 in 5+ unit buildings).
Forward outlook
- Local home prices are declining (-3.0%/yr); year-one equity from $2k of loan paydown is wiped out by about $10k of value loss. Plan a longer hold.
- Gulf County population projected to shrink 4% by 2050 — rents likely to lag national; underwrite the cash flow, not the appreciation.
Negotiation context
- It's been on market 75 days — a 6% lower offer ($150k) is reasonable based on typical stale-listing flexibility.
Risks & watch-outs
- Climate carrying-cost: severe wind risk, 99% chance of damaging wind over 30y; moderate wildfire risk; extreme-heat days projected 7→22/yr by 2055 (HVAC capex compounding) — expect insurance premiums to compound above CPI over the hold.
Questions for the listing agent
- What do current leases actually rent for vs. the listed asking? Can we see a recent rent roll and the last 12 months of T-12 income?
- It's been on market 75 days. Have you received any prior offers? Is the seller open to a 6% concession, seller financing, or rate buy-down credit?
- Why hasn't it sold? Are there any deal-killer items the seller is aware of (foundation, flood, title, zoning, code violations)?
- Is there a deadline driving the sale (1031 exchange, divorce, estate, relocation)? That informs how much negotiation room exists.
- The area grade is low — what's the realistic commute time and amenity access for the typical tenant pool here? Any planned neighborhood developments (good or bad) we should know about?
- What's the average days-on-market for RENTAL listings here right now (not sales)? A rising rental-DOM trend means longer vacancies and softer asking-rent achievability than the comps imply.
- What's the recent tenant-quality profile in this submarket — average credit score on applications, eviction rate, late-payment / NSF rate, and stable-employment percentage? A property-management company in the area should have these aggregated.
- How much new for-sale + rental construction is in the pipeline within 1–3 miles? Heavy new supply typically softens prices + rents 12–24 months out; constrained supply supports both.
Investment metrics
- 1% rule
- 0.48% ✗
- Cap rate
- 3.54%
- Cash-on-cash
- -9.85%
- DSCR
- 0.56
- GRM
- 17.5
CMA / ARV
- ARV (on-the-fly)
- $330,825
- Comps found
- 6
Show comp detail 6 sales within ~0.75 mi
| Address | Dist | Beds/Ba | Sqft | Sold | Price | $/sf | Match |
|---|---|---|---|---|---|---|---|
| 512 6th St | 0.48mi | 2/1.0 | 816 (-1%) | 13mo | $310,000 | $380 | 65 |
| 528 7th St | 0.51mi | 2/1.0 | 860 (+4%) | 11mo | $345,000 | $401 | 60 |
| 611 10th St | 0.71mi | 2/1.0 | 832 (+1%) | 14mo | $337,000 | $405 | 54 |
| 230 7th St | 0.58mi | 2/2.0 | 834 (+1%) | 23mo | $372,500 | $447 | 48 |
| 213 Ave B | 0.37mi | 3/2.0 (+1) | 904 (+10%) | 20mo | $120,000 | $133 | 42 |
| 611 Garrison Ave | 0.48mi | 3/1.0 (+1) | 936 (+14%) | 23mo | $295,000 | $315 | 31 |
Match score weights: distance 35% · size 25% · config 20% · recency 20%. Top-matched comps best support the ARV.
Projected returns pro-forma
-3.0% appreciation · 3.0% rent growth · sell at horizon
- IRR
- -34.1%
- Equity multiple
- -0.10×
- Total profit
- $-102,162
- Equity at exit
- $49,327
- IRR
- -43.4%
- Equity multiple
- -0.64×
- Total profit
- $-151,900
- Equity at exit
- $28,604
Cash invested: $92,631 (down + closing). Projections, not guarantees.
Landlord ↔ Tenant lean methodology
- Overall (STATE)
- 87 Strongly Landlord-Friendly
- State Florida
- 87 Strongly Landlord-Friendly · R+3
- County
- — inherits STATE
- City
- — inherits STATE
ZIP-level market 32456
- Home prices YoY
- -21.3%
- Active inventory
- 1028
- Price-to-rent
- 8.5×
Monthly cashflow live
- Estimated rent
- $1,573 medium interval (Pro) →
- Mortgage (P&I)
- −$1,735
- Tax from tax record
- −$130 /mo · $1,557/yr
- Insurance
- −$138
- HOA
- −$0
- Vacancy / Maint / Mgmt
- −$330
- Net cashflow
- $-760
Break-even live
UW: 25.0% down · 7.5% · 30yr · 1.5% tax · 5.0% vac · 8.0% maint · 8.0% mgmt
Financing live
Cash to close
- Down payment
- $82,706
- Closing costs
- $9,925
- Reserves months
- —
- Total cash needed
- —
Loan-product check · same deal, 3 products live
Conventional
25% down · 7.5% · 30yr
- Down + closing
- —
- Monthly P&I
- —
- Monthly cashflow
- —
- DSCR
- —
- Eligible?
- —
Personal DTI + credit; lowest rate.
DSCR
20% down · 8.5% · 30yr
- Down + closing
- —
- Monthly P&I
- —
- Monthly cashflow
- —
- DSCR
- —
- Eligible?
- —
No personal income docs; deal must DSCR.
Hard money
10% down · 12.0% · 12mo
- Down + closing
- —
- Monthly P&I
- —
- Monthly cashflow
- —
- DSCR
- —
- Eligible?
- —
Short-term bridge; refi at stabilization.
Listing history 17 events
-
2026-06-19days on market $159,900 Active 75 DOM
-
2026-06-18days on market $159,900 Active 74 DOM
-
2026-06-17days on market $159,900 Active 73 DOM
-
2026-06-16days on market $159,900 Active 72 DOM
-
2026-06-15days on market $159,900 Active 71 DOM
-
2026-06-14days on market $159,900 Active 69 DOM
-
2026-06-13days on market $159,900 Active 68 DOM
-
2026-06-10days on market $159,900 Active 66 DOM
-
2026-06-09days on market $159,900 Active 65 DOM
-
2026-06-08days on market $159,900 Active 64 DOM
-
2026-06-07days on market $159,900 Active 63 DOM
-
2026-06-05days on market $159,900 Active 60 DOM
-
2026-06-02days on market $159,900 Active 58 DOM
-
2026-06-01days on market $159,900 Active 57 DOM
-
2026-05-31days on market $159,900 Active 56 DOM
-
2026-05-30days on market $159,900 Active 55 DOM
-
2026-04-05$179,990 Active
ⓘ Source: listings_history table (triggers on properties + properties_extension) + one-shot
backfill from property_details.listing_events for pre-trigger history.
Tax reassessment forecast FL · Resets to sale price
- Current annual tax
- $1,557 · $130/mo
- Projected year-2 tax
- $1,557 · $130/mo
- Expected delta
- $0/yr ($0/mo · 0.0%)
ⓘ Screening estimate from a state-policy table — verify with the county assessor before closing.
Climate risk First Street
- Flood 1/10 Low FEMA zone X (unshaded) · 0% chance over 30 yrs
- Wildfire 5/10 Major
- Heat 10/10 Extreme 7 d/yr ≥105°F today · 22 d/yr by 30 yrs out
- Wind 10/10 Extreme 99% chance of damaging wind over 30 yrs
- Air quality 1/10 Low 0 unhealthy d/yr today · 0 by 30 yrs out
Nearby sold comps map
Loading sold comps map…
Walkable amenities ~0.75 mi
Loading nearby amenities…
Taxation est. · year 1
- Rental income
- $18,874
- − Mortgage interest
- −$18,531
- − Property taxes
- −$1,557
- − Insurance
- −$1,654
- − Repairs & maintenance
- −$1,510
- − Management
- −$1,510
- − Depreciation
- −$9,624
- Taxable loss
- −$15,513
- Est. tax savings @ 24.0%
- +$3,723
- After-tax cash flow
- $-5,397/yr
For passive investors: Depreciation is non-cash, so a rental often shows a tax loss while cash-flowing — sheltering income. Rental losses are passive: they offset passive income freely, and up to $25,000/yr can offset ordinary (W-2) income if you actively participate and your MAGI is under $100k (phasing out to $0 by $150k); unused losses carry forward. On sale, claimed depreciation is recaptured at up to 25%, and gains may owe capital-gains tax (a 1031 exchange can defer both). Figures are a year-1 estimate at your 24.0% rate — not tax advice; consult a CPA.
Schools (NCES district)
- District
- Gulf
- NCES district ID
- 1200690
- Math proficiency
- 47% ▼ -5.00%
- Reading proficiency
- 45% ▼ -5.00%
- Median HH income
- $41,047
- Composite
- 38.63/100
- National rank
- #4154
- State rank
- #49 of 73 in FL
Livability — Port St. Joe
No livability data for this city. (Only ~50 U.S. cities are tracked.)
Census & demographics
- Census place
- Port St. Joe, FL
- County
- Gulf County · 7,510 people
- City population
- 7,304
- Metro
- Panama City, FL
- Population (ZIP)
- 7,510
- Household income
- $64,681
- Rent vs Own
- Severe rent burden
- 194.0
Population outlook (Gulf County) Hauer SSP2
- Today (2025)
- 15,677 people
- By 2030
- 15,538 · -0.9%
- By 2040
- 15,386 · -1.9%
- By 2050
- 15,043 · -4.0%
- By 2075
- 13,793 · -12.0%
- By 2100
- 10,793 · -31.2%
Race, ethnicity, and origin ACS 2023
- Neighborhood character
- Predominantly White (87%)
- Race & ethnicity
- White 87% Black 5% Two or more races 5% Hispanic / Latino 3%
- Common ancestry
- Slovak 5% Lithuanian 2% Italian 1%
- Foreign-born
- 4% · Canada
- Languages at home
- 97% English-only · Spanish 2%
Political lean MEDSL · Gulf
- 2024 margin
- Solid R (+54.2) · D 22.6% · R 76.8%
- 2008→2024 swing
- -14.9pp toward R · 2008: -39.3pp · 2024: -54.2pp
- All cycles
- 2024: R+54.2 2020: R+50.6 2016: R+49.5 2012: R+42.0 2008: R+39.3
Not yet ingested
- Civics
- —
Market trends
- HPI YoY
- ▼ -107.36%
- Current HPI
- 396.0936
- Rent YoY
- —
- Metro
- Panama City, FL
- State GDP YoY
- ▲ 3.28%
- F500 in state
- 36
Industry mix (Fortune 500 HQ in FL)
| Industry | F500 HQs | Revenue |
|---|---|---|
| Industrial Technology | 2 | $29B |
|
||
| Insurance | 2 | $17B |
|
||
| Retail | 1 | $60B |
|
||
| Technology Distribution | 1 | $58B |
|
||
| Homebuilding | 1 | $35B |
|
||
| Technology Manufacturing | 1 | $35B |
|
||
Price history
1 event — show timeline
- 2026-04-05 Listed $179,990 RAFGC
Property tax history
+5.2%/yrLatest (2025): $1,557 · +24.8% YoY. Source: county tax records.
Cash-flow waterfall
monthlySold comps — $/sqft
last 12 mo · ≤1 miLoading sold comps…