2151 Oakland Rd #569 · San Jose, CA
Flood risk No data
- FEMA flood zone
- —
- Chance of flooding over 30 yrs
- —
- Est. flood insurance / yr
- —
Fire risk No data
- Est. fire insurance / yr
- —
Heat risk No data
- Hot days now (above threshold)
- —
- Hot days in 30 yrs
- —
Wind risk No data
- Chance of severe wind over 30 yrs
- —
Air-quality risk No data
- Unhealthy air days now
- —
- Unhealthy air days in 30 yrs
- —
Risk factors via First Street. Map © Google.
Why this score? — see what drove the B grade
The composite is a weighted blend of 9 inputs, each scored 0–100. Each bar is that input's sub-score; the figure is the points it added to the 100-point composite (weight × sub-score).
- Cash flow +30.0/30.0
- DSCR +10.0/10.0
- 1% rule +9.9/10.0
- ARV discount +6.1/15.0
- Schools +5.5/10.0
- Livability +3.9/5.0
- Rent growth +3.7/5.0
- Condition / age +2.5/5.0
- Appreciation +0.0/10.0
$295,000
🖨 Deal sheet 📄 Offer letter ✓ Due diligence
Listing remarks MLS
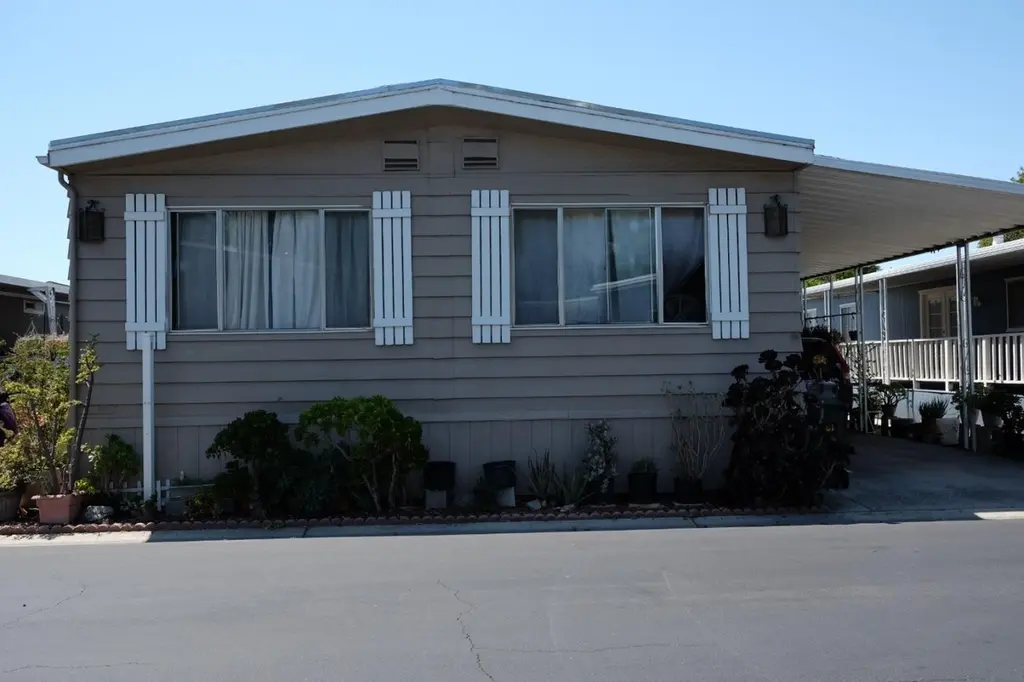
3 beds and 2 bath mobile home in live able condition. An additional 4 bed is no permit. Show and sale!
Key facts
- Built 1973
- Listed 44 days
Property features AI
Finance
- Other: Property on leased land within a family park; Not incorporated
- Financial info: Tax type: ILT (In Lieu of Tax)
- HOA & community: HOA fees cover common area electricity and common area insurance; HOA amenities: see remarks
Exterior
- Parking: 2-car carport (minimum); Unassigned parking spaces (space #569, space rent $1,337)
- Utilities: Public water; Public sewer
- Home design: Single-story; Leased land (park home site); No age restrictions (family park)
- Construction: Living area about 1,440
- Exterior features: Shingle roof; Public utilities
Interior
- Kitchen: Eat-in layout (appliances not specified)
- Bedrooms: 3 bedrooms
- Bathrooms: 2 full bathrooms
- Heating & cooling: Central forced-air heating; Central forced-air cooling
- Interior features: Eat-in kitchen
Neighborhood map
What this means for you Summary
Snapshot
- This is a 3-bed/2.0-bath manufactured listed at $295k.
Deal economics
- At list price, monthly cash flow is $1k ($17k/yr) — positive.
- The deal already cash-flows at list — no discount required.
- Meets the 1% rule at list price ($4k rent vs $295k).
- Recommended offer: $286k (3.0% below list) — sets the bar for market timing.
- Cap rate 12.1% vs local median 1.6% in San Jose — top-decile yield for the area; either an underpriced asset or a hidden risk that comps aren't pricing in. Stress-test before assuming the spread holds.
Location & tenants
- Location reads 78/100 on livability (#68 in CA, #2,559 nationally) — a middle-class / working-renter tenant base. Strengths: amenities A+, commute A+, employment A+; Watch: crime F, cost of living F.
- Orchard Elementary (urban): math 51% / reading 60% proficiency, ranked #225 of 1,400 in CA (top 16%) — acceptable for families but not a draw, mixed tenant base, ~2y average lease.
- Market conditions: Rents rising fast (+4.7%/yr); 49 active listings in the ZIP; 34 comparable units currently listed for rent nearby; rentals leasing fast (median 2d on market — plan ~1-2 weeks tenant-placement turnaround); high-income renter base; 3,838 units permitted in Santa Clara County in 2024 (1,886 in 5+ unit buildings).
- This rent runs 31% of the median local income ($170k/yr) — at the standard rent-burdened threshold; future hikes will face affordability resistance.
Forward outlook
- Local home prices are declining (-3.0%/yr); year-one equity from $2k of loan paydown is wiped out by about $9k of value loss. Plan a longer hold.
- Santa Clara County population projected at +24% by 2050 — long-run rental-demand tailwind backs the buy-and-hold thesis.
- At projected returns (-3.0% appreciation + 4.7% rent growth), your $83k cash investment doubles in ~6 years — after that, you're playing with house money.
Negotiation context
- It's been on market 44 days — a 3% lower offer ($286k) is reasonable based on typical stale-listing flexibility.
- 4 sale attempts since 26y ago with the ask held roughly flat each time — persistent listings suggest the price (not the market) is what's stuck; bring a comps-based counter.
- Current owner paid $100k; list at $295k implies a 195% gain — meaningful room to come down on a strong offer.
Questions for the listing agent
- It's been on market 44 days. Have you received any prior offers? Is the seller open to a 3% concession, seller financing, or rate buy-down credit?
- Built in 1973 — when were the roof, HVAC, electrical panel, plumbing, and water heater last replaced?
- Is there a deadline driving the sale (1031 exchange, divorce, estate, relocation)? That informs how much negotiation room exists.
- Crime grade is F in this area — have there been break-ins, vandalism, or insurance claims at this property in the last 3 years? What carrier currently insures it and at what premium?
- What's the average days-on-market for RENTAL listings here right now (not sales)? A rising rental-DOM trend means longer vacancies and softer asking-rent achievability than the comps imply.
- What's the recent tenant-quality profile in this submarket — average credit score on applications, eviction rate, late-payment / NSF rate, and stable-employment percentage? A property-management company in the area should have these aggregated.
- How much new for-sale + rental construction is in the pipeline within 1–3 miles? Heavy new supply typically softens prices + rents 12–24 months out; constrained supply supports both.
Investment metrics
- 1% rule
- 1.49% ✓
- Cap rate
- 12.15%
- Cash-on-cash
- 20.92%
- DSCR
- 1.93
- GRM
- 5.6
CMA / ARV
- ARV (median comp)
- $285,917
- List price
- $295,000
- Delta
- 3.18%
- Verdict
- FAIR
- Comps
- 20 within 1.0 mi
Show comp detail 12 sales within ~0.75 mi
| Address | Dist | Beds/Ba | Sqft | Sold | Price | $/sf | Match |
|---|---|---|---|---|---|---|---|
| 2151 Oakland Rd #189 | 0.01mi | 3/2.0 | 1,440 (0%) | 6mo | $320,000 | $222 | 94 |
| 2151 Oakland Rd #14 | 0.01mi | 3/2.0 | 1,440 (0%) | 7mo | $291,500 | $202 | 94 |
| 2151 Oakland Rd #135 | 0.00mi | 2/2.0 (-1) | 1,440 (0%) | 3mo | $310,000 | $215 | 92 |
| 2151 Oakland #229 | 0.14mi | 4/2.0 (+1) | 1,440 (0%) | 1mo | $344,000 | $239 | 87 |
| 2151 Oakland Rd #595 | 0.14mi | 3/2.0 | 1,410 (-2%) | 4mo | $220,000 | $156 | 87 |
| 2151 Oakland Rd #552 | 0.14mi | 3/2.0 | 1,485 (+3%) | 3mo | $310,000 | $209 | 85 |
| 2151 Oakland Rd #210 | 0.01mi | 3/2.0 | 1,516 (+5%) | 7mo | $235,000 | $155 | 85 |
| 2151 Oakland Rd #444 | 0.00mi | 2/2.0 (-1) | 1,488 (+3%) | 9mo | $200,000 | $134 | 82 |
| 2151 Oakland Rd Space #46 | 0.14mi | 3/2.0 | 1,536 (+7%) | 4mo | $315,000 | $205 | 78 |
| 2151 Oakland Rd #231 | 0.33mi | 3/2.0 | 1,440 (0%) | 8mo | $260,000 | $181 | 78 |
| 2151 Oakland Rd #443 | 0.14mi | 2/2.0 (-1) | 1,344 (-7%) | 3mo | $229,900 | $171 | 75 |
| 2151 Oakland Rd #375 | 0.00mi | 3/2.0 | 1,630 (+13%) | 10mo | $395,000 | $242 | 70 |
Match score weights: distance 35% · size 25% · config 20% · recency 20%. Top-matched comps best support the ARV.
Projected returns pro-forma
-3.0% appreciation · 4.67% rent growth · sell at horizon
- IRR
- 15.2%
- Equity multiple
- 1.62×
- Total profit
- $51,478
- Equity at exit
- $43,985
- IRR
- 25.1%
- Equity multiple
- 3.36×
- Total profit
- $195,099
- Equity at exit
- $25,506
Cash invested: $82,600 (down + closing). Projections, not guarantees.
Landlord ↔ Tenant lean methodology
- Overall (CITY)
- 0 Strongly Tenant-Friendly
- State California
- 18 Strongly Tenant-Friendly · D+13
- County
- — inherits STATE
- City San Jose
- 0 Strongly Tenant-Friendly · D+24
ZIP-level market 95131
- Rents YoY
- 4.7%
- Active inventory
- 49
- Price-to-rent
- 5.6×
Monthly cashflow live
- Estimated rent
- $4,403 high interval (Pro) →
- Mortgage (P&I)
- −$1,547
- Tax est. 1.5%
- −$369 /mo · $4,425/yr
- Insurance
- −$123
- HOA
- −$0
- Vacancy / Maint / Mgmt
- −$925
- Net cashflow
- $1,440
Break-even live
UW: 25.0% down · 7.5% · 30yr · 1.5% tax · 5.0% vac · 8.0% maint · 8.0% mgmt
Financing live
Cash to close
- Down payment
- $73,750
- Closing costs
- $8,850
- Reserves months
- —
- Total cash needed
- —
Loan-product check · same deal, 3 products live
Conventional
25% down · 7.5% · 30yr
- Down + closing
- —
- Monthly P&I
- —
- Monthly cashflow
- —
- DSCR
- —
- Eligible?
- —
Personal DTI + credit; lowest rate.
DSCR
20% down · 8.5% · 30yr
- Down + closing
- —
- Monthly P&I
- —
- Monthly cashflow
- —
- DSCR
- —
- Eligible?
- —
No personal income docs; deal must DSCR.
Hard money
10% down · 12.0% · 12mo
- Down + closing
- —
- Monthly P&I
- —
- Monthly cashflow
- —
- DSCR
- —
- Eligible?
- —
Short-term bridge; refi at stabilization.
Rent comps 34 comps
| Address | Beds | Baths | Sqft | Rent | $/sqft | DOM | Units | Dist |
|---|---|---|---|---|---|---|---|---|
| 1141 Rock Ave San Jose, CA | 3.0 | 2.5 | 1376 | $4,295 | $3.12 | 1d | 1 | 0.16mi |
| 1799 Snell Pl Milpitas, CA | 3.0 | 3.0 | 1450 | $4,450 | $3.07 | 17d | 1 | 0.62mi |
| 69 Ede Ln Milpitas, CA | 3.0 | 3.0 | 1253 | $4,128 | $3.29 | 7d | 1 | 0.69mi |
| 1067 McKay Dr San Jose, CA | 3.0 | 3.0 | 1657 | $4,800 | $2.90 | 1d | 1 | 0.71mi |
| 363 Odyssey Ln Milpitas, CA | 3.0 | 4.0 | 1651 | $4,750 | $2.88 | 1d | 1 | 0.71mi |
| 1694 Starlite Dr Milpitas, CA | 4.0 | 2.5 | 1726 | $4,600 | $2.67 | 1d | 1 | 0.74mi |
| 2031 Trento Loop Milpitas, CA | 3.0 | 3.0 | 1709 | $4,400 | $2.57 | 7d | 1 | 0.77mi |
| 1753 Capulet Dr Milpitas, CA | 2.0 | 2.0 | 1100 | $4,000 | $3.64 | 16d | 1 | 0.81mi |
| 1573 Capulet Dr Milpitas, CA | 2.0 | 2.0 | 1100 | $3,750 | $3.41 | 21d | 1 | 0.81mi |
| 23 Cedar Way Milpitas, CA | 4.0 | 2.0 | 1527 | $4,620 | $3.03 | 7d | 1 | 0.86mi |
| 379 Lundy Pl Milpitas, CA | 3.0 | 3.0 | 1618 | $4,445 | $2.75 | 7d | 1 | 0.87mi |
| 56 Lonetree Ct Milpitas, CA | 4.0 | 2.5 | 1824 | $5,000 | $2.74 | 19d | 1 | 0.88mi |
| 1677 Centre Pointe Dr Milpitas, CA | 3.0 | 3.0 | 1687 | $4,600 | $2.73 | 23d | 1 | 0.94mi |
| 1331 Lakeshore Cir San Jose, CA | 1.0–3.0 | 1.0–3.0 | 1017 | $4,767 | $4.69 | 1d | 28 | 0.96mi |
| 1600 Whitewood Dr San Jose, CA | 1.0–2.0 | 1.0–2.0 | 977 | $3,806 | $3.89 | 1d | 12 | 0.97mi |
| 460 Montague Expy #40 Milpitas, CA | 3.0 | 2.5 | 1833 | $4,750 | $2.59 | 2d | 1 | 0.98mi |
| 1625 Delano St Unit 31A Milpitas, CA | 3.0 | 2.5 | 1458 | $4,295 | $2.95 | 1d | 1 | 0.99mi |
| 312 Gates Dr Milpitas, CA | 1.0–2.0 | 1.0–2.0 | 891 | $4,530 | $5.08 | 1d | 14 | 0.99mi |
| 600 Epic Way San Jose, CA | 2.0 | 1.0–2.0 | 832 | $4,847 | $5.82 | 1d | 28 | 1.01mi |
| 650 E Capitol Ave Milpitas, CA | 1.0–2.0 | 1.0–2.0 | 1003 | $4,835 | $4.82 | 1d | 17 | 1.04mi |
| 273 Baja Rose St Milpitas, CA | 3.0 | 2.0 | 1569 | $4,700 | $3.00 | 23d | 1 | 1.04mi |
| 1821 S Milpitas Blvd Milpitas, CA | 1.0–2.0 | 1.0–2.0 | 860 | $4,238 | $4.93 | 1d | 5 | 1.06mi |
| 1087 Bigleaf Pl #1526 San Jose, CA | 3.0 | 3.0 | 1850 | $4,180 | $2.26 | 1d | 1 | 1.12mi |
| 2100 Beech Cir San Jose, CA | 3.0 | 3.5 | 1812 | $4,350 | $2.40 | 10d | 1 | 1.13mi |
| 425 Navaro Way #120 San Jose, CA | 2.0 | 2.0 | 1088 | $3,750 | $3.45 | 43d | 1 | 1.13mi |
| 2365 Fallingtree Dr San Jose, CA | 4.0 | 2.0 | 1234 | $4,315 | $3.50 | 11d | 1 | 1.17mi |
| 440 Navaro Pl San Jose, CA | 2.0 | 2.0 | 1254 | $3,924 | $3.13 | 23d | 1 | 1.18mi |
| 345 Village Center Dr San Jose, CA | 2.0 | 1.0–2.0 | 877 | $4,541 | $5.17 | 1d | 19 | 1.22mi |
| 415 Camille Cir San Jose, CA | 2.0 | 2.5 | 1561 | $4,009 | $2.57 | 12d | 1 | 1.24mi |
| 753 Montague Expy Milpitas, CA | 2.0 | 2.0 | 957 | $3,580 | $3.74 | 1d | 2 | 1.25mi |
| 1102 S Abel St Milpitas, CA | 1.0–3.0 | 1.0–2.0 | 1070 | $4,597 | $4.30 | 1d | 9 | 1.26mi |
| 1895 N Capitol Ave San Jose, CA | 2.0 | 1.0–2.0 | 658 | $3,505 | $5.33 | 1d | 1 | 1.28mi |
| 373 River Oaks Cir San Jose, CA | 1.0–2.0 | 1.0–2.0 | 937 | $4,147 | $4.42 | 1d | 3 | 1.30mi |
| 1323 Pebble Ct San Jose, CA | 2.0 | 2.0 | 1093 | $3,500 | $3.20 | 17d | 1 | 1.44mi |
Listing history 22 events
-
2026-06-18days on market $295,000 Active 44 DOM
-
2026-06-17days on market $295,000 Active 43 DOM
-
2026-06-16days on market $295,000 Active 42 DOM
-
2026-06-15days on market $295,000 Active 41 DOM
-
2026-06-13days on market $295,000 Active 39 DOM
-
2026-06-13days on market $295,000 Active 38 DOM
-
2026-06-09days on market $295,000 Active 35 DOM
-
2026-06-08days on market $295,000 Active 34 DOM
-
2026-06-07days on market $295,000 Active 33 DOM
-
2026-06-05days on market $295,000 Active 30 DOM
-
2026-06-03days on market $295,000 Active 29 DOM
-
2026-06-02days on market $295,000 Active 28 DOM
-
2026-06-01days on market $295,000 Active 27 DOM
-
2026-05-31days on market $295,000 Active 26 DOM
-
2026-05-06$295,000 Active 102-char remark
Show marketing remark (102 chars)
3 beds and 2 bath mobile home in live able condition. An additional 4 bed is no permit. Show and sale!
-
2026-05-05$295,000 Active 102-char remark
Show marketing remark (102 chars)
3 beds and 2 bath mobile home in live able condition. An additional 4 bed is no permit. Show and sale!
-
2001-06-11historical 258-char remark
Show marketing remark (258 chars)
* * * SELLER ARE MOTIVATED & PACKING * LOW SPACE RENT! NICE FLOORPLAN * GOOD CONTD CLEAN CARPET * PERFECT FOR 1ST TIME BUYER!!! CENTRAL HEATING/ A/C, WASHER, DRYER REFRIGERATOR, TENNIS CRT, CLUB HOUSE, EXERCICE ROOM * MOVE IN CONDITION * EZ TO
-
2001-02-21soldstatus $100,000 258-char remark
Show marketing remark (258 chars)
* * * SELLER ARE MOTIVATED & PACKING * LOW SPACE RENT! NICE FLOORPLAN * GOOD CONTD CLEAN CARPET * PERFECT FOR 1ST TIME BUYER!!! CENTRAL HEATING/ A/C, WASHER, DRYER REFRIGERATOR, TENNIS CRT, CLUB HOUSE, EXERCICE ROOM * MOVE IN CONDITION * EZ TO
-
2001-02-05$101,000 258-char remark
Show marketing remark (258 chars)
* * * SELLER ARE MOTIVATED & PACKING * LOW SPACE RENT! NICE FLOORPLAN * GOOD CONTD CLEAN CARPET * PERFECT FOR 1ST TIME BUYER!!! CENTRAL HEATING/ A/C, WASHER, DRYER REFRIGERATOR, TENNIS CRT, CLUB HOUSE, EXERCICE ROOM * MOVE IN CONDITION * EZ TO
-
2000-04-03historical
-
2000-02-26soldstatus $51,000
-
2000-02-22$55,000
ⓘ Source: listings_history table (triggers on properties + properties_extension) + one-shot
backfill from property_details.listing_events for pre-trigger history.
Nearby sold comps map
Loading sold comps map…
Walkable amenities ~0.75 mi
Loading nearby amenities…
Taxation est. · year 1
- Rental income
- $52,836
- − Mortgage interest
- −$16,525
- − Property taxes
- −$4,425
- − Insurance
- −$1,475
- − Repairs & maintenance
- −$4,227
- − Management
- −$4,227
- − Depreciation
- −$8,582
- Taxable income
- $13,376
- Est. tax owed @ 24.0%
- −$3,210
- After-tax cash flow
- $14,066/yr
For passive investors: Depreciation is non-cash, so a rental often shows a tax loss while cash-flowing — sheltering income. Rental losses are passive: they offset passive income freely, and up to $25,000/yr can offset ordinary (W-2) income if you actively participate and your MAGI is under $100k (phasing out to $0 by $150k); unused losses carry forward. On sale, claimed depreciation is recaptured at up to 25%, and gains may owe capital-gains tax (a 1031 exchange can defer both). Figures are a year-1 estimate at your 24.0% rate — not tax advice; consult a CPA.
Schools (NCES district)
- District
- Orchard Elementary
- NCES district ID
- 0628680
- Math proficiency
- 51% ▲ 1.00%
- Reading proficiency
- 60% ▲ 5.00%
- Median HH income
- $108,165
- Composite
- 54.67/100
- National rank
- #2853
- State rank
- #225 of 1400 in CA
Livability — San Jose
- Score
- 78/100
- State rank
- #68
- US rank
- #2559
Category grades
Schools grade is shown separately in the Schools card above.
Census & demographics
- Census place
- San Jose, CA
- County
- Santa Clara County · 1,806,974 people
- City population
- 954,479
- Metro
- San Jose-Sunnyvale-Santa Clara, CA
- Population (ZIP)
- 31,179
- Household income
- $170,255
- Rent vs Own
- Severe rent burden
- 691.0
Population outlook (Santa Clara County) Hauer SSP2
- Today (2025)
- 2,179,074 people
- By 2030
- 2,301,297 · +5.6%
- By 2040
- 2,528,195 · +16.0%
- By 2050
- 2,712,135 · +24.5%
- By 2075
- 2,998,701 · +37.6%
- By 2100
- 2,931,429 · +34.5%
Race, ethnicity, and origin ACS 2023
- Neighborhood character
- Predominantly Asian (70%)
- Race & ethnicity
- Asian 70% Hispanic / Latino 16% White 10% Two or more races 9% Black 1%
- Hispanic origin (detail)
- Mexican 14%
- Common ancestry
- Italian 1%
- Foreign-born
- 57% · China, Vietnam, Canada
- Languages at home
- 31% English-only · Chinese 28% Vietnamese 11% Spanish 10%
Political lean MEDSL · Santa Clara
- 2024 margin
- Solid D (+40.0) · D 68.1% · R 28.1% · Other 3.8%
- 2008→2024 swing
- -0.9pp no change · 2008: 40.9pp · 2024: 40.0pp
- All cycles
- 2024: D+40.0 2020: D+47.4 2016: D+52.5 2012: D+42.1 2008: D+40.9
Not yet ingested
- Civics
- —
Market trends
- HPI YoY
- ▼ -1287.10%
- Current HPI
- 314.6879
- Rent YoY
- ▲ 4.67%
- Metro
- San Jose-Sunnyvale-Santa Clara, CA
- State GDP YoY
- ▲ 3.21%
- F500 in state
- 116
Industry mix (Fortune 500 HQ in CA)
| Industry | F500 HQs | Revenue |
|---|---|---|
| Technology | 27 | $1,492B |
|
||
| Financial Services | 3 | $174B |
|
||
| Retail | 3 | $44B |
|
||
| Insurance | 3 | $26B |
|
||
| Media / Entertainment | 2 | $115B |
|
||
| Pharmaceuticals / Biotech | 2 | $62B |
|
||
Price history
+436.4% since first listed8 events — show timeline
- 2026-05-06 Listed $295,000 MLSListings
- 2026-05-05 Listed $295,000 bridgeMLS, Bay East AOR, or Contra Costa AOR
- 2001-06-11 Listing Removed — MLSListings
- 2001-02-21 Sold (MLS) $100,000 MLSListings
- 2001-02-05 Listed $101,000 MLSListings
- 2000-04-03 Listing Removed — MLSListings
- 2000-02-26 Sold (MLS) $51,000 MLSListings
- 2000-02-22 Listed $55,000 MLSListings
Cash-flow waterfall
monthlySold comps — $/sqft
last 12 mo · ≤1 miLoading sold comps…