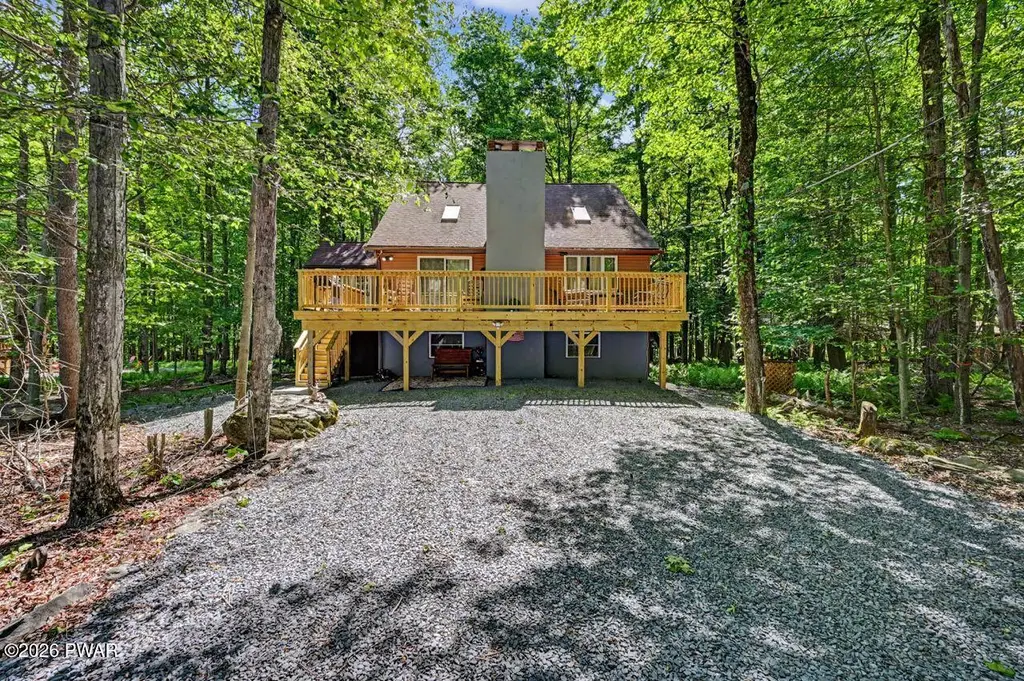
70 Underwood Ln · Salem, PA
Flood risk 1/10 · Minimal
- FEMA flood zone
- X (unshaded)
- Chance of flooding over 30 yrs
- 0.0%
- Est. flood insurance / yr
- $507 – $1,088
Fire risk 1/10 · Minimal
- Est. fire insurance / yr
- $511 – $949
Heat risk 2/10 · Minimal
- Hot days now (above 91°F)
- 7 days/yr
- Hot days in 30 yrs
- 16 days/yr
Wind risk 2/10 · Minimal
- Chance of severe wind over 30 yrs
- 4.0%
Air-quality risk 2/10 · Minimal
- Unhealthy air days now
- 1 days/yr
- Unhealthy air days in 30 yrs
- 2 days/yr
Risk factors via First Street. Map © Google.
Why this score? — see what drove the D- grade
The composite is a weighted blend of 9 inputs, each scored 0–100. Each bar is that input's sub-score; the figure is the points it added to the 100-point composite (weight × sub-score).
- Appreciation +10.0/10.0
- Cash flow +6.8/30.0
- Schools +4.4/10.0
- ARV discount +3.7/15.0
- Rent growth +2.5/5.0
- Livability +2.5/5.0
- Condition / age +2.5/5.0
- 1% rule +1.9/10.0
- DSCR +1.1/10.0
$339,900
🖨 Deal sheet 📄 Offer letter ✓ Due diligence
Listing remarks MLS
Beautiful contemporary home located in a four season amenity filled community in The Northern Poconos, just two hours from the NYC and Philadelphia Areas. This salt-box style home has three finished levels. The main level has an open floor plan, high ceilings, brick fireplace, laminate flooring, updated bathroom. There's a bedroom on each level too. The 2nd level has a loft overlooking the living room, a bedroom and full bath. The finished lower level has a family room, 3rd bedroom with half bath and laundry room. Flooring in lower level needs to be finished. Beautiful Screened in Porch! Storage shed below. , Beds Description: Primary1st, Beds Description: 2+BED 2nd, Beds Description: 1BedLL, Baths: 1 Bath Level 1, Baths: 1 Bath Level 2, Baths: 1/2 Bath Lev L, Eating Area: Dining Area, Beds Description: 1Bed1st
Key facts
- Four season sunroom
- Knotty pine ceilings
- Included hot tub
Tags
Property features AI
Finance
- HOA & community: Homeowners association with annual fee (association provides security and trash services); Community amenities include clubhouse, pool, tennis courts, fitness center, playground, park, golf, lake, fishing, trails, barbecue and various recreation facilities
Exterior
- Parking: Driveway (unpaved); On-site/off-street parking
- Security: Gated community with security gate and security service
- Utilities: Public water and public sewer; 200+ amp electric service; Propane available; Cable, phone and electricity connected
- Home design: Single-family house; Two levels; Located on Roamingwood Lake (lake access); Subdivision: The Hideout; Private road frontage with private road maintenance agreement; Paved road access
- Construction: Asphalt roof; Workshop on property
- Exterior features: Fire pit; Deck; Patio (screened); Porch; Community pool
Interior
- Kitchen: Dishwasher; Microwave; Refrigerator; Electric range/oven
- Bedrooms: Total of 7 rooms (bedroom count not specified)
- Flooring: Carpet; Tile; Hardwood
- Bathrooms: Two full bathrooms; One half bathroom
- Heating & cooling: Baseboard heating; Electric and propane heating; Fireplace(s); Ceiling fans; Wall/window air conditioning units
- Interior features: Ceiling fans; Walk-in closet(s); Finished full basement with walk-out access; Fireplace in living room and family room (masonry, propane)
- Laundry & utility: Washer and dryer included; Laundry room on lower level
Neighborhood map
What this means for you Summary
Snapshot
- This is a 3-bed/2.0-bath single-family listed at $340k.
Deal economics
- At list price, monthly cash flow is $-525 ($-6k/yr) — negative.
- To cash-flow at today's rent, offer at most $247k (27.3% below list).
- To meet the 1% rule (rent ≥ 1% of price), the offer needs to be $235k (30.9% below list).
- Recommended offer: $235k (30.9% below list) — sets the bar for 1% rule.
Location & tenants
- Location reads: area grade D — affects rentability + tenant quality, not the cash-flow math above.
- Western Wayne SD (rural): math 39% / reading 63% proficiency, ranked #165 of 539 in PA (top 31%) — acceptable for families but not a draw, mixed tenant base, ~2y average lease.
- Market conditions: 337 active listings in the ZIP; 177 units permitted in Wayne County in 2024 (0 in 5+ unit buildings).
Forward outlook
- In year one you build about $36k of equity ($2k loan paydown + $34k appreciation (10.0% local appreciation)).
- Wayne County population projected at -17% by 2050 — secular population decline; favor cash flow + early exit over multi-decade hold.
- By year 2, paydown + projected appreciation supports a ~$58k cash-out refi (75% LTV) — recoverable capital for the next deal without selling this one.
Negotiation context
- Only 13 days on market — expect competitive offers; lowballing is unlikely to land.
- 6 sale attempts since 5y ago with the ask held roughly flat each time — persistent listings suggest the price (not the market) is what's stuck; bring a comps-based counter.
- Current owner paid $270k; 26% above their basis — modest negotiation headroom, anchor on the comps not their cost.
Questions for the listing agent
- What do current leases actually rent for vs. the listed asking? Can we see a recent rent roll and the last 12 months of T-12 income?
- What does the HOA fee cover, when was the last increase, and are there any pending special assessments or reserve-fund shortfalls?
- Is there a deadline driving the sale (1031 exchange, divorce, estate, relocation)? That informs how much negotiation room exists.
- The area grade is low — what's the realistic commute time and amenity access for the typical tenant pool here? Any planned neighborhood developments (good or bad) we should know about?
- What's the average days-on-market for RENTAL listings here right now (not sales)? A rising rental-DOM trend means longer vacancies and softer asking-rent achievability than the comps imply.
- What's the recent tenant-quality profile in this submarket — average credit score on applications, eviction rate, late-payment / NSF rate, and stable-employment percentage? A property-management company in the area should have these aggregated.
- How much new for-sale + rental construction is in the pipeline within 1–3 miles? Heavy new supply typically softens prices + rents 12–24 months out; constrained supply supports both.
Investment metrics
- 1% rule
- 0.69% ✗
- Cap rate
- 4.44%
- Cash-on-cash
- -6.62%
- DSCR
- 0.71
- GRM
- 12.1
CMA / ARV
- ARV (on-the-fly)
- $313,200
- Comps found
- 12
Show comp detail 12 sales within ~0.75 mi
| Address | Dist | Beds/Ba | Sqft | Sold | Price | $/sf | Match |
|---|---|---|---|---|---|---|---|
| 378 Lakewood Dr | 0.15mi | 3/3.0 | 2,130 (-1%) | 2mo | $143,000 | $67 | 85 |
| 53 Cedarwood Ter | 0.24mi | 3/3.0 | 2,046 (-5%) | 0mo | $380,000 | $186 | 76 |
| 73 Cedarwood Ter | 0.31mi | 4/2.0 (+1) | 2,182 (+1%) | 9mo | $305,000 | $140 | 71 |
| 67 Cedarwood Ter | 0.29mi | 3/2.5 | 2,064 (-4%) | 10mo | $299,000 | $145 | 69 |
| 222 Parkwood Dr | 0.26mi | 4/2.0 (+1) | 2,238 (+4%) | 15mo | $380,000 | $170 | 64 |
| 24 Lakewood Dr | 0.18mi | 4/2.0 (+1) | 1,900 (-12%) | 5mo | $240,000 | $126 | 63 |
| 152 Lakeview Dr W | 0.34mi | 3/2.5 | 2,055 (-5%) | 14mo | $364,000 | $177 | 63 |
| 75 Cedarwood Ter | 0.32mi | 4/3.0 (+1) | 2,146 (-1%) | 15mo | $339,900 | $158 | 63 |
| 13 Lakewood Ct Lot 396 | 0.19mi | 3/2.0 | 1,928 (-11%) | 14mo | $292,500 | $152 | 62 |
| 72 Lakeview Dr | 0.18mi | 3/2.0 | 2,475 (+15%) | 8mo | $350,000 | $141 | 60 |
| 84 Ridgewood Cir | 0.53mi | 3/3.0 | 2,383 (+10%) | 5mo | $295,000 | $124 | 50 |
| 55 Oak Cir | 0.56mi | 4/3.0 (+1) | 2,236 (+4%) | 12mo | $285,000 | $127 | 49 |
Match score weights: distance 35% · size 25% · config 20% · recency 20%. Top-matched comps best support the ARV.
Projected returns pro-forma
10.0% appreciation · 3.0% rent growth · sell at horizon
- IRR
- 19.6%
- Equity multiple
- 2.59×
- Total profit
- $151,721
- Equity at exit
- $306,209
- IRR
- 18.0%
- Equity multiple
- 5.97×
- Total profit
- $473,210
- Equity at exit
- $660,351
Cash invested: $95,172 (down + closing). Projections, not guarantees.
Landlord ↔ Tenant lean methodology
- Overall (STATE)
- 62 Landlord-Friendly
- State Pennsylvania
- 62 Landlord-Friendly · EVEN
- County
- — inherits STATE
- City
- — inherits STATE
ZIP-level market 18436
- Home prices YoY
- 16.9%
- Active inventory
- 337
- Price-to-rent
- 12.1×
Monthly cashflow live
- Estimated rent
- $2,349 medium interval (Pro) →
- Mortgage (P&I)
- −$1,782
- Tax from tax record
- −$263 /mo · $3,151/yr
- Insurance
- −$142
- HOA
- −$194
- Vacancy / Maint / Mgmt
- −$493
- Net cashflow
- $-525
Break-even live
UW: 25.0% down · 7.5% · 30yr · 1.5% tax · 5.0% vac · 8.0% maint · 8.0% mgmt
Financing live
Cash to close
- Down payment
- $84,975
- Closing costs
- $10,197
- Reserves months
- —
- Total cash needed
- —
Loan-product check · same deal, 3 products live
Conventional
25% down · 7.5% · 30yr
- Down + closing
- —
- Monthly P&I
- —
- Monthly cashflow
- —
- DSCR
- —
- Eligible?
- —
Personal DTI + credit; lowest rate.
DSCR
20% down · 8.5% · 30yr
- Down + closing
- —
- Monthly P&I
- —
- Monthly cashflow
- —
- DSCR
- —
- Eligible?
- —
No personal income docs; deal must DSCR.
Hard money
10% down · 12.0% · 12mo
- Down + closing
- —
- Monthly P&I
- —
- Monthly cashflow
- —
- DSCR
- —
- Eligible?
- —
Short-term bridge; refi at stabilization.
HOA detail
- Monthly dues
- $194 · $2,328/yr
Listing history 11 events
-
2026-06-18days on market $339,900 Active 13 DOM
-
2026-06-17days on market $339,900 Active 12 DOM
-
2026-06-16days on market $339,900 Active 11 DOM
-
2026-06-15days on market $339,900 Active 10 DOM
-
2026-06-14days on market $339,900 Active 8 DOM
-
2026-06-13days on market $339,900 Active 7 DOM
-
2026-06-10days on market $339,900 Active 5 DOM
-
2026-06-09days on market $339,900 Active 4 DOM
-
2026-06-08days on market $339,900 Active 3 DOM
-
2026-06-07remarks 699-char remark
-
2026-06-07$339,900 Active 2 DOM
ⓘ Source: listings_history table (triggers on properties + properties_extension) + one-shot
backfill from property_details.listing_events for pre-trigger history.
Tax reassessment forecast PA · Partial reset (capped growth)
- Current annual tax
- $3,151 · $263/mo
- Projected year-2 tax
- $4,261 · $355/mo
- Expected delta
- +$1,110/yr (+$92/mo · 35.2%)
ⓘ Screening estimate from a state-policy table — verify with the county assessor before closing.
Climate risk First Street
- Flood 1/10 Low FEMA zone X (unshaded) · 0% chance over 30 yrs
- Wildfire 1/10 Low
- Heat 2/10 Low 7 d/yr ≥91°F today · 16 d/yr by 30 yrs out
- Wind 2/10 Low 4% chance of damaging wind over 30 yrs
- Air quality 2/10 Low 1 unhealthy d/yr today · 2 by 30 yrs out
Nearby sold comps map
Loading sold comps map…
Walkable amenities ~0.75 mi
Loading nearby amenities…
Taxation est. · year 1
- Rental income
- $28,184
- − Mortgage interest
- −$19,040
- − Property taxes
- −$3,151
- − Insurance
- −$1,700
- − Repairs & maintenance
- −$2,255
- − Management
- −$2,255
- − HOA
- −$2,328
- − Depreciation
- −$9,888
- Taxable loss
- −$12,432
- Est. tax savings @ 24.0%
- +$2,984
- After-tax cash flow
- $-3,319/yr
For passive investors: Depreciation is non-cash, so a rental often shows a tax loss while cash-flowing — sheltering income. Rental losses are passive: they offset passive income freely, and up to $25,000/yr can offset ordinary (W-2) income if you actively participate and your MAGI is under $100k (phasing out to $0 by $150k); unused losses carry forward. On sale, claimed depreciation is recaptured at up to 25%, and gains may owe capital-gains tax (a 1031 exchange can defer both). Figures are a year-1 estimate at your 24.0% rate — not tax advice; consult a CPA.
Schools (NCES district)
- District
- Western Wayne SD
- NCES district ID
- 4226070
- Math proficiency
- 39% ▼ -12.00%
- Reading proficiency
- 63% ▼ -6.00%
- Median HH income
- $51,358
- Composite
- 43.65/100
- National rank
- #2964
- State rank
- #165 of 539 in PA
Livability — Salem
No livability data for this city. (Only ~50 U.S. cities are tracked.)
Census & demographics
- Census place
- The Hideout, PA
- Population (ZIP)
- 13,225
Population outlook (Wayne County) Hauer SSP2
- Today (2025)
- 47,924 people
- By 2030
- 46,191 · -3.6%
- By 2040
- 42,815 · -10.7%
- By 2050
- 39,873 · -16.8%
- By 2075
- 34,556 · -27.9%
- By 2100
- 28,358 · -40.8%
Race, ethnicity, and origin ACS 2023
- Neighborhood character
- Predominantly White (95%)
- Race & ethnicity
- White 95% Two or more races 3% Hispanic / Latino 2%
- Common ancestry
- Romanian 9% Scotch-Irish 2% Iranian 2%
- Foreign-born
- 4%
- Languages at home
- 95% English-only · French/Haitian/Cajun 2% Russian/Polish/Slavic 1% Spanish 1%
Political lean MEDSL · Wayne
- 2024 margin
- Solid R (+37.1) · D 31.1% · R 68.2%
- 2008→2024 swing
- -24.8pp toward R · 2008: -12.3pp · 2024: -37.1pp
- All cycles
- 2024: R+37.1 2020: R+33.6 2016: R+39.7 2012: R+20.9 2008: R+12.3
Not yet ingested
- Civics
- —
Market trends
- HPI YoY
- ▲ 47.95%
- Current HPI
- 331.9645
- Rent YoY
- —
- Metro
- —
- State GDP YoY
- ▲ 1.68%
- F500 in state
- 34
Industry mix (Fortune 500 HQ in PA)
| Industry | F500 HQs | Revenue |
|---|---|---|
| Healthcare | 2 | $309B |
|
||
| Insurance | 2 | $27B |
|
||
| Telecommunications / Media | 1 | $124B |
|
||
| Industrial Distribution | 1 | $22B |
|
||
| Financial Services | 1 | $20B |
|
||
| Chemicals / Materials | 1 | $18B |
|
||
Price history
+190.5% since first listed16 events — show timeline
- 2026-06-05 Listed $339,900 PWMLS
- 2025-05-18 Relisted — PWMLS
- 2025-05-02 Pending — PWMLS
- 2025-04-25 Relisted — PWMLS
- 2025-02-10 Price Changed $349,000 PWMLS
- 2025-01-08 Price Changed $359,000 PWMLS
- 2024-07-23 Listed $365,000 PWMLS
- 2022-02-14 Sold (Public Records) $270,000 Public Records
- 2022-02-10 Sold (MLS) — PWMLS
- 2022-02-10 Sold (MLS) $270,000 PWMLS
- 2021-12-11 Listed $259,900 PWMLS
- 2021-12-11 Listed $259,900 PWMLS
- 2019-01-14 Sold (Public Records) $140,000 Public Records
- 2005-08-29 Sold (Public Records) $139,000 Public Records
- 2004-09-08 Sold (Public Records) $139,000 Public Records
- 1989-10-17 Sold (Public Records) $117,000 Public Records
Property tax history
+1.4%/yrLatest (2026): $3,151 · +3.1% YoY. Source: county tax records.
Cash-flow waterfall
monthlySold comps — $/sqft
last 12 mo · ≤1 miLoading sold comps…