 Duplex
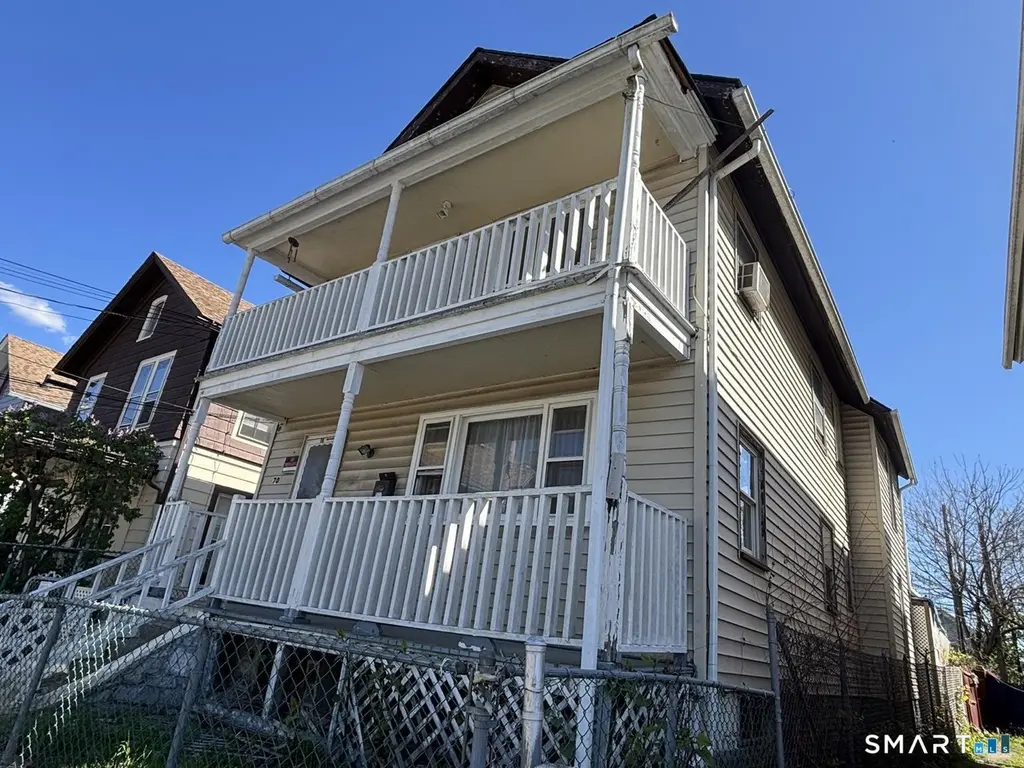
70 E Dover St · Waterbury, CT
Flood risk 1/10 · Minimal
- FEMA flood zone
- X (unshaded)
- Chance of flooding over 30 yrs
- 0.0%
- Est. flood insurance / yr
- $473 – $860
Fire risk 1/10 · Minimal
- Est. fire insurance / yr
- $829 – $1,539
Heat risk 6/10 · Moderate
- Hot days now (above 96°F)
- 7 days/yr
- Hot days in 30 yrs
- 16 days/yr
Wind risk 6/10 · Moderate
- Chance of severe wind over 30 yrs
- 27.0%
Air-quality risk 3/10 · Minor
- Unhealthy air days now
- 2 days/yr
- Unhealthy air days in 30 yrs
- 3 days/yr
Risk factors via First Street. Map © Google.
Why this score? — see what drove the B- grade
The composite is a weighted blend of 9 inputs, each scored 0–100. Each bar is that input's sub-score; the figure is the points it added to the 100-point composite (weight × sub-score).
- Cash flow +23.8/30.0
- ARV discount +12.5/15.0
- DSCR +7.7/10.0
- 1% rule +6.4/10.0
- Appreciation +5.7/10.0
- Livability +4.0/5.0
- Rent growth +2.5/5.0
- Condition / age +2.5/5.0
- Schools +1.5/10.0
$249,000
🖨 Deal sheet (PDF) 📄 Offer letter ✓ Due diligence
Multi-family units
County records classify this as Multi-Family (2-4 Unit). Listing-text estimate: 2 units. confirmed
Listing remarks
This two family home is ready for its next owner. The first-floor unit offers a comfortable one-bedroom layout with the possibility of converting to two bedrooms, ideal for added flexibility or rental income. The second-floor apartment includes two bedrooms and a generously sized living area, with plenty of natural light filling both levels of the home. The property features a roof only two years old, providing peace of mind for years to come. Heating is electric, but gas service is already available at the street for those who prefer to convert. A great opportunity for investors or owner-occupants alike-cash, conventional, or rehab loan buyers are welcome. This house is been SOLD AS IS!!
Key facts
- First floor unit
- Two family home
- 1,742 sq ft lot
Tags
Property features AI
Exterior
- Parking: 2 parking spaces
- Utilities: Public water connected; Public sewer connected
- Home design: Multi-family property (2-family)
- Construction: Concrete foundation; Concrete construction; Beige exterior color
- Exterior features: Vinyl siding; Shingle roof; Paved parking area
Interior
- Bedrooms: 3 bedrooms
- Bathrooms: 2 full bathrooms
- Heating & cooling: Radiator heat (electric fuel); 40-gallon electric hot water tank
- Interior features: Total of 9 rooms; Full, unfinished basement
Neighborhood map
What this means for you Summary
Snapshot
- This is a 2 × 3-bed/1.0-bath units multifamily listed at $249k.
Deal economics
- At list price, monthly cash flow is $478 ($6k/yr) — positive. Per door: $239/mo.
- The deal already cash-flows at list — no discount required.
- Meets the 1% rule at list price ($3k rent vs $249k).
- Cap rate 8.6% vs local median 3.6% in Waterbury — top-decile yield for the area; either an underpriced asset or a hidden risk that comps aren't pricing in. Stress-test before assuming the spread holds.
Location & tenants
- Location reads 79/100 on livability (#32 in CT, #2,205 nationally) — a middle-class / working-renter tenant base. Strengths: commute A+, cost of living A+, housing A+; Watch: schools D+, crime D, employment D.
- Waterbury School District (suburban): math 12% / reading 23% proficiency, ranked #148 of 153 in CT (top 97%) — low school quality limits family demand, transient renter base, plan for 1-2y turnover; 73% free/reduced lunch — lower-income household profile, screen leases tightly.
- Market conditions: 42 active listings in the ZIP; 40 comparable units currently listed for rent nearby; rentals lingering (median 45d on market — plan ~5-8 weeks vacancy on turnover, expect pricing pressure); 55% of comp listings sitting > 30 days — soft ceiling on asking rent; 502 units permitted in Naugatuck Valley Planning Region in 2024 (171 in 5+ unit buildings).
- At $2,831/mo this rent would consume 65% of the median local household income ($52k/yr) (locally 801% of renters already pay >50% of income on rent) — very limited rent-growth headroom before tenants either downsize or default.
Forward outlook
- In year one you build about $5k of equity ($2k loan paydown + $3k appreciation (1.4% local appreciation)).
- At projected returns (1.4% appreciation + 3.0% rent growth), your $70k cash investment doubles in ~6 years — after that, you're playing with house money.
- By year 7, paydown + projected appreciation supports a ~$34k cash-out refi (75% LTV) — recoverable capital for the next deal without selling this one.
Negotiation context
- Only 14 days on market — expect competitive offers; lowballing is unlikely to land.
- Current owner paid $143k; list at $249k implies a 74% gain — meaningful room to come down on a strong offer.
Risks & watch-outs
- Watch-outs: built in 1900 — expect roof / HVAC / electrical / plumbing capex.
- Climate carrying-cost: major wind risk, 27% chance of damaging wind over 30y; extreme-heat days projected 7→16/yr by 2055 (HVAC capex compounding) — expect insurance premiums to compound above CPI over the hold.
Questions for the listing agent
- Can we see the unit-by-unit rent roll, current vacancy, and any below-market leases? What's the average tenancy length?
- What capital expenditures (roof, boiler, parking lot, exteriors) have been made in the last 5 years, and what's planned in the next 2?
- Built in 1900 — when were the roof, HVAC, electrical panel, plumbing, and water heater last replaced?
- Is there a deadline driving the sale (1031 exchange, divorce, estate, relocation)? That informs how much negotiation room exists.
- Schools are D-rated, which usually means shorter tenancies and higher turnover. Who's the typical renter profile here, and what's been the actual vacancy rate?
- Crime grade is D in this area — have there been break-ins, vandalism, or insurance claims at this property in the last 3 years? What carrier currently insures it and at what premium?
- What's the average days-on-market for RENTAL listings here right now (not sales)? A rising rental-DOM trend means longer vacancies and softer asking-rent achievability than the comps imply.
- What's the recent tenant-quality profile in this submarket — average credit score on applications, eviction rate, late-payment / NSF rate, and stable-employment percentage? A property-management company in the area should have these aggregated.
- How much new apartment / multifamily construction is in the pipeline within 1–3 miles? Heavy new supply (>2% of stock underway) typically softens rents 12–24 months out; light construction supports rent growth.
Investment metrics
- 1% rule
- 1.14% ✓
- Cap rate
- 8.60%
- Cash-on-cash
- 8.23%
- DSCR
- 1.37
- GRM
- 7.3
CMA / ARV
- ARV (median comp)
- $280,050
- List price
- $249,000
- Delta
- -11.09%
- Verdict
- UNDERPRICED
- Comps
- 20 within 1.0 mi
Show comp detail 2 sales within ~0.75 mi
| Address | Dist | Beds/Ba | Sqft | Sold | Price | $/sf | Match |
|---|---|---|---|---|---|---|---|
| 30 Green St | 0.51mi | 4/2.0 (+1) | 1,414 (+7%) | 15mo | $275,000 | $194 | 44 |
| 30 Ashley St | 0.70mi | 3/2.0 | 1,407 (+6%) | 16mo | $285,000 | $203 | 40 |
Match score weights: distance 35% · size 25% · config 20% · recency 20%. Top-matched comps best support the ARV.
Projected returns pro-forma
1.39% appreciation · 3.0% rent growth · sell at horizon
- IRR
- 11.0%
- Equity multiple
- 1.57×
- Total profit
- $40,018
- Equity at exit
- $90,147
- IRR
- 14.4%
- Equity multiple
- 2.82×
- Total profit
- $127,149
- Equity at exit
- $123,878
Cash invested: $69,720 (down + closing). Projections, not guarantees.
Landlord ↔ Tenant lean methodology
- Overall (STATE)
- 27 Tenant-Leaning
- State Connecticut
- 27 Tenant-Leaning · D+7
- County
- — inherits STATE
- City
- — inherits STATE
ZIP-level market 06706
- Home prices YoY
- 0.5%
- Active inventory
- 42
- Price-to-rent
- 14.7×
Monthly cashflow live
- Estimated rent
- $2,831 medium interval (Pro) →
- Mortgage (P&I)
- −$1,306
- Tax from tax record
- −$349 /mo · $4,184/yr
- Insurance
- −$104
- HOA
- −$0
- Vacancy / Maint / Mgmt
- −$595
- Net cashflow
- $478
Break-even live
Sensitivity live
| Price | -10% $619 | -5% $549 | +0% $478 | +5% $408 | +10% $337 |
|---|---|---|---|---|---|
| Rent | -10% $255 | -5% $366 | +0% $478 | +5% $590 | +10% $702 |
| Rate | -1.0pp $604 | -0.5pp $542 | base $478 | +0.5pp $414 | +1.0pp $348 |
2-unit breakdown (identical units grouped — click to expand)
| Units | Beds | Baths | Est. rent |
|---|---|---|---|
| 2× units | 3 | 1 | $2,832 |
| #1 | 3 | 1 | $1,416 |
| #2 | 3 | 1 | $1,416 |
| Total (2 units) | $2,831 | ||
UW: 25.0% down · 7.5% · 30yr · 1.5% tax · 5.0% vac · 8.0% maint · 8.0% mgmt
Financing live
Cash to close
- Down payment
- $62,250
- Closing costs
- $7,470
- Reserves months
- —
- Total cash needed
- —
Loan-product check · same deal, 3 products live
Conventional
25% down · 7.5% · 30yr
- Down + closing
- —
- Monthly P&I
- —
- Monthly cashflow
- —
- DSCR
- —
- Eligible?
- —
Personal DTI + credit; lowest rate.
DSCR
20% down · 8.5% · 30yr
- Down + closing
- —
- Monthly P&I
- —
- Monthly cashflow
- —
- DSCR
- —
- Eligible?
- —
No personal income docs; deal must DSCR.
Hard money
10% down · 12.0% · 12mo
- Down + closing
- —
- Monthly P&I
- —
- Monthly cashflow
- —
- DSCR
- —
- Eligible?
- —
Short-term bridge; refi at stabilization.
Rent comps 40 comps
| Address | Beds | Baths | Sqft | Rent | $/sqft | DOM | Units | Dist |
|---|---|---|---|---|---|---|---|---|
| 691 S Main St Unit 3RD Waterbury, CT | 3.0 | 1.0 | 1000 | $1,600 | $1.60 | 44d | 1 | 0.11mi |
| 423 Baldwin St Unit 2 Waterbury, CT | 3.0 | 1.0 | 900 | $1,600 | $1.78 | 4d | 1 | 0.19mi |
| 429 Baldwin St Unit 2 Waterbury, CT | 3.0 | 1.0 | 900 | $1,600 | $1.78 | 4d | 1 | 0.19mi |
| 63 Bank St Unit 3A Waterbury, CT | 2.0 | 1.0 | 903 | $1,700 | $1.88 | 15d | 1 | 0.52mi |
| 59 Green St Waterbury, CT | 3.0 | 1.0 | 900 | $1,650 | $1.83 | 44d | 1 | 0.53mi |
| 113 Southview St Waterbury, CT | 2.0 | 1.0 | 1860 | $1,250 | $0.67 | 24d | 1 | 0.57mi |
| 29 Madison St Unit 2 Waterbury, CT | 4.0 | 1.0 | 1010 | $1,900 | $1.88 | 44d | 1 | 0.62mi |
| 779 E Main St Unit 2nd floor Waterbury, CT | 3.0 | 1.0 | 1149 | $1,400 | $1.22 | 24d | 1 | 0.63mi |
| 25 Laurel St #1 Waterbury, CT | 4.0 | 1.0 | 1100 | $2,000 | $1.82 | 44d | 1 | 0.66mi |
| 127 Congress Ave Unit 1 Waterbury, CT | 3.0 | 1.0 | 1200 | $2,300 | $1.92 | 44d | 1 | 0.66mi |
| 124 Charles St Unit 2 Waterbury, CT | 2.0 | 1.0 | 1012 | $1,800 | $1.78 | 44d | 1 | 0.67mi |
| 143 Congress Ave Unit 2 Waterbury, CT | 4.0 | 1.0 | 1050 | $1,800 | $1.71 | 44d | 1 | 0.68mi |
| 241 Congress Ave Unit 1st Floor Waterbury, CT | 2.0 | 1.0 | 909 | $1,300 | $1.43 | 44d | 1 | 0.71mi |
| 85 Draher St Unit 1 Waterbury, CT | 2.0 | 1.0 | 1200 | $1,600 | $1.33 | 44d | 1 | 0.72mi |
| 77 Wall St Waterbury, CT | 3.0 | 1.0 | 1000 | $1,900 | $1.90 | 12d | 1 | 0.74mi |
| 30 Walnut Ave Unit 2 Waterbury, CT | 3.0 | 1.0 | 1200 | $1,600 | $1.33 | 44d | 1 | 0.74mi |
| 1120 Baldwin St Waterbury, CT | 3.0 | 1.0 | 1100 | $1,750 | $1.59 | 44d | 1 | 0.75mi |
| 140 Orange St Waterbury, CT | 2.0 | 1.0 | 1678 | $1,500 | $0.89 | 44d | 1 | 0.76mi |
| 64 Dikeman St Unit 2nd Floor Waterbury, CT | 3.0 | 1.0 | 1000 | $2,200 | $2.20 | 22d | 1 | 0.80mi |
| 203 Alder St Unit 1st floor Waterbury, CT | 2.0 | 1.0 | 1060 | $1,600 | $1.51 | 44d | 1 | 0.81mi |
| 53 Cooke St Unit 3rd floor Waterbury, CT | 3.0 | 1.0 | 1200 | $1,450 | $1.21 | 44d | 1 | 0.81mi |
| 59 Baldwin Ave Waterbury, CT | 3.0 | 1.0 | 1200 | $2,350 | $1.96 | 44d | 1 | 0.84mi |
| 468 Congress Ave Unit third floor Waterbury, CT | 3.0 | 1.0 | 1250 | $1,500 | $1.20 | 24d | 1 | 0.85mi |
| 46 Webb St Unit 3 Waterbury, CT | 4.0 | 1.0 | 1200 | $2,000 | $1.67 | 44d | 1 | 0.85mi |
| 214 Oak St Unit 3 Waterbury, CT | 3.0 | 1.0 | 1220 | $1,700 | $1.39 | 12d | 1 | 0.85mi |
| 41 Lawlor St Waterbury, CT | 3.0 | 1.0 | 1750 | $2,000 | $1.14 | 15d | 1 | 0.87mi |
| 10 2nd Ave Unit 1st Floor Waterbury, CT | 3.0 | 1.0 | 900 | $1,450 | $1.61 | 24d | 1 | 0.88mi |
| 259 Grove St Unit 1 Waterbury, CT | 3.0 | 1.0 | 1200 | $1,600 | $1.33 | 44d | 1 | 0.88mi |
| 72 Chambers St Unit 2 Waterbury, CT | 3.0 | 1.0 | 1540 | $1,750 | $1.14 | 44d | 1 | 0.91mi |
| 49 Hillside Ave Unit 2 Waterbury, CT | 3.0 | 2.0 | 1600 | $1,500 | $0.94 | 12d | 1 | 0.95mi |
| 46 Ward St Waterbury, CT | 3.0 | 1.0 | 1000 | $1,900 | $1.90 | 24d | 1 | 0.97mi |
| 67 Avon Ave Unit 2 Waterbury, CT | 2.0 | 1.0 | 887 | $1,700 | $1.92 | 24d | 1 | 0.99mi |
| 89 Willow St Unit 1 Waterbury, CT | 2.0 | 1.0 | 1000 | $1,450 | $1.45 | 24d | 1 | 1.00mi |
| 125 Hillside Ave Unit B1 Waterbury, CT | 2.0 | 1.0 | 960 | $1,300 | $1.35 | 4d | 1 | 1.01mi |
| 18 Cliff St Unit 1 Waterbury, CT | 3.0 | 1.5 | 1150 | $1,650 | $1.43 | 44d | 1 | 1.01mi |
| 76 Oak St Waterbury, CT | 2.0 | 1.0 | 900 | $1,249 | $1.39 | 44d | 1 | 1.02mi |
| 49 Johnson St Waterbury, CT | 2.0 | 1.0 | 1000 | $1,375 | $1.38 | 44d | 1 | 1.03mi |
| 654 Highland Ave Unit 2 Waterbury, CT | 2.0 | 1.0 | 1000 | $1,400 | $1.40 | 45d | 1 | 1.03mi |
| 5 Hill St Unit B,D Waterbury, CT | 3.0 | 1.0 | 1100 | $1,450 | $1.32 | 15d | 1 | 1.03mi |
| 132 Locust St Unit 16 Waterbury, CT | 2.0 | 1.0 | 950 | $1,250 | $1.32 | 24d | 1 | 1.03mi |
Listing history 3 events
-
2026-05-11status Under Contract 697-char remark
-
2026-04-27$249,000 Active 697-char remark
-
2007-07-12soldstatus $143,000
ⓘ Source: listings_history table (triggers on properties + properties_extension) + one-shot
backfill from property_details.listing_events for pre-trigger history.
Tax reassessment forecast CT · Partial reset (capped growth)
- Current annual tax
- $4,184 · $349/mo
- Projected year-2 tax
- $4,756 · $396/mo
- Expected delta
- +$572/yr (+$48/mo · 13.7%)
ⓘ Screening estimate from a state-policy table — verify with the county assessor before closing.
Climate risk First Street
- Flood 1/10 Low FEMA zone X (unshaded) · 0% chance over 30 yrs
- Wildfire 1/10 Low
- Heat 6/10 Major 7 d/yr ≥96°F today · 16 d/yr by 30 yrs out
- Wind 6/10 Major 27% chance of damaging wind over 30 yrs
- Air quality 3/10 Moderate 2 unhealthy d/yr today · 3 by 30 yrs out
Nearby sold comps map
Loading sold comps map…
Walkable amenities ~0.75 mi
Loading nearby amenities…
Taxation est. · year 1
- Rental income
- $33,972
- − Mortgage interest
- −$13,948
- − Property taxes
- −$4,184
- − Insurance
- −$1,245
- − Repairs & maintenance
- −$2,718
- − Management
- −$2,718
- − Depreciation
- −$7,244
- Taxable income
- $1,916
- Est. tax owed @ 24.0%
- −$460
- After-tax cash flow
- $5,280/yr
For passive investors: Depreciation is non-cash, so a rental often shows a tax loss while cash-flowing — sheltering income. Rental losses are passive: they offset passive income freely, and up to $25,000/yr can offset ordinary (W-2) income if you actively participate and your MAGI is under $100k (phasing out to $0 by $150k); unused losses carry forward. On sale, claimed depreciation is recaptured at up to 25%, and gains may owe capital-gains tax (a 1031 exchange can defer both). Figures are a year-1 estimate at your 24.0% rate — not tax advice; consult a CPA.
Schools (NCES district)
- District
- Waterbury School District
- NCES district ID
- 0904830
- Math proficiency
- 12% ▼ -7.00%
- Reading proficiency
- 23% ▼ -8.00%
- Median HH income
- $40,040
- Composite
- 14.85/100
- National rank
- #9380
- State rank
- #148 of 153 in CT
Livability — Waterbury
- Score
- 79/100
- State rank
- #32
- US rank
- #2205
Category grades
Schools grade is shown separately in the Schools card above.
Census & demographics
- Census place
- Waterbury, CT
- County
- New Haven County · 688,236 people
- City population
- 115,012
- Metro
- New Haven-Milford, CT
- Population (ZIP)
- 15,551
- Household income
- $52,242
- Rent vs Own
- Severe rent burden
- 801.0
Population outlook (Naugatuck Valley County) Hauer SSP2
- By 2040
- 496,846
Race, ethnicity, and origin ACS 2023
- Neighborhood character
- Highly diverse neighborhood (Simpson 0.72)
- Race & ethnicity
- Hispanic / Latino 35% White 31% Black 25% Two or more races 12% Asian 3%
- Hispanic origin (detail)
- Puerto Rican 25% Dominican 4%
- Common ancestry
- Lithuanian 3% Estonian 2% Romanian 1%
- Foreign-born
- 20% · Canada, Jamaica
- Languages at home
- 60% English-only · Spanish 27% Other Indo-European 11% Other Asian/Pacific 1%
Political lean MEDSL · Naugatuck Valley
- 2024 margin
- Lean R (+7.4) · D 45.6% · R 53.0% · Other 1.4%
- All cycles
- 2024: R+7.4
Not yet ingested
- Civics
- —
Market trends
- HPI YoY
- ▲ 1.39%
- Current HPI
- 309.8467
- Rent YoY
- —
- Metro
- New Haven-Milford, CT
- State GDP YoY
- ▲ 1.06%
- F500 in state
- 38
Industry mix (Fortune 500 HQ in CT)
| Industry | F500 HQs | Revenue |
|---|---|---|
| Industrial Machinery | 4 | $38B |
|
||
| Insurance | 3 | $71B |
|
||
| Financial Services | 2 | $25B |
|
||
| Transportation / Logistics | 2 | $18B |
|
||
| Healthcare | 1 | $247B |
|
||
| Telecommunications | 1 | $55B |
|
||
Price history
+74.1% since first listed3 events — show timeline
- 2026-05-11 Pending — Smart MLS
- 2026-04-27 Listed $249,000 Smart MLS
- 2007-07-12 Sold (Public Records) $143,000 Public Records
Property tax history
+5.3%/yrLatest (2023): $4,184 · +88.2% YoY. Source: county tax records.
Cash-flow waterfall
monthlySold comps — $/sqft
last 12 mo · ≤1 miLoading sold comps…