5288 Alton Rd #3 · Miami Beach, FL
Flood risk 9/10 · Severe
- FEMA flood zone
- AE
- Chance of flooding over 30 yrs
- 0.99%
- Est. flood insurance / yr
- $1,737 – $8,500
Fire risk 1/10 · Minimal
- Est. fire insurance / yr
- $947 – $1,759
Heat risk 10/10 · Severe
- Hot days now (above 101°F)
- 7 days/yr
- Hot days in 30 yrs
- 28 days/yr
Wind risk 10/10 · Severe
- Chance of severe wind over 30 yrs
- 99.0%
Air-quality risk 2/10 · Minimal
- Unhealthy air days now
- 1 days/yr
- Unhealthy air days in 30 yrs
- 1 days/yr
Risk factors via First Street. Map © Google.
Why this score? — see what drove the D+ grade
The composite is a weighted blend of 9 inputs, each scored 0–100. Each bar is that input's sub-score; the figure is the points it added to the 100-point composite (weight × sub-score).
- Cash flow +10.0/30.0
- ARV discount +7.5/15.0
- Appreciation +5.5/10.0
- Condition / age +4.8/5.0
- Schools +4.2/10.0
- Livability +4.0/5.0
- Rent growth +3.4/5.0
- 1% rule +3.0/10.0
- DSCR +2.9/10.0
$750,000
🖨 Deal sheet (PDF) 📄 Offer letter ✓ Due diligence
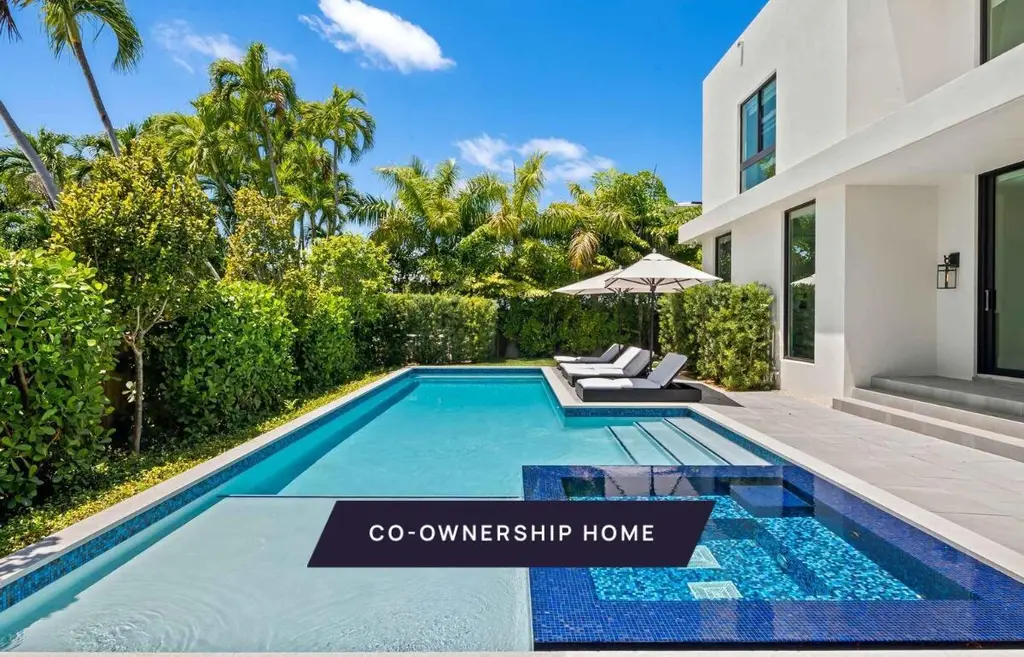
Listing remarks
New co-ownership opportunity by Pacaso: Own one-eighth of Casa Estrada, a professionally managed, turnkey home. Cool and contemporary, this home sits on a beautifully landscaped corner lot offers elegance and privacy. The backyard features an inviting pool and spa, plus a covered outdoor kitchen and lounge. The open plan main floor includes a wall of built-in cabinetry, a sleek dining space and a gourmet kitchen with a six-burner Viking cooktop, Sub-Zero double refrigerator and double freezer, a wine fridge and a glass-enclosed 80-bottle wine rack. Upstairs is the spacious primary bedroom with a window wall, a giant closet and access to an upper patio overlooking the pool. The en suite bath
Key facts
- Turnkey home
- Built-in cabinetry
- Inviting pool
Tags
Property features AI
Finance
- Financial info: Pets allowed (size limit)
Exterior
- Parking: Attached 2-car garage; Covered parking for 2 vehicles
- Utilities: Public water; Public sewer; Three-phase electric; Natural gas available
- Home design: Co-Ownership property; Resale condition; 2 stories; Faces north
- Construction: Built with CBS (concrete block/stucco) construction; Rolled/hot mop roof
- Exterior features: Private in-ground pool; Heated spa (in-ground); Entry level living area
Interior
- Kitchen: Disposal; Dishwasher; Gas range; Microwave; Refrigerator
- Bedrooms: One bedroom on the main level
- Flooring: Laminate
- Bathrooms: 4 full bathrooms; 1 bathroom on the main level
- Heating & cooling: Central heating; Central air conditioning
- Interior features: Walk-in closets; Furnished
- Laundry & utility: Laundry inside
Neighborhood map
What this means for you Summary
Snapshot
- This is a 4-bed/4.0-bath single-family listed at $750k. Condition is rated excellent.
Deal economics
- At list price, monthly cash flow is $-879 ($-11k/yr) — negative.
- To cash-flow at today's rent, offer at most $623k (16.9% below list).
- To meet the 1% rule (rent ≥ 1% of price), the offer needs to be $599k (20.2% below list).
- Recommended offer: $599k (20.2% below list) — sets the bar for 1% rule.
- Cap rate 5.6% vs local median 1.5% in Miami Beach — top-decile yield for the area; either an underpriced asset or a hidden risk that comps aren't pricing in. Stress-test before assuming the spread holds.
Location & tenants
- Location reads 80/100 on livability (#108 in FL, #1,672 nationally) — a professional / high-income tenant draw. Strengths: crime A+, commute A+, health & safety A+; Watch: housing C-, amenities D-, cost of living F.
- Miami-Dade (suburban): math 45% / reading 54% proficiency, ranked #40 of 73 in FL (top 55%) — families likely to look elsewhere, expect single-tenant / working-renter base with shorter leases; 64% free/reduced lunch — lower-income household profile, screen leases tightly.
- Zoned schools: North Beach Elementary School (math 75% / reading 79%, grade A, #170 of 2,144 statewide, top 9%, 937 students, 24% FRL); Miami Beach Nautilus Middle School (math 46% / reading 58%, grade C+, #217 of 571 statewide, top 40%, 918 students, 44% FRL); North Miami Beach Senior High (math 13% / reading 24%, grade F, #568 of 667 statewide, top 85%, 1,149 students, 66% FRL) — zoned schools average 45% FRL vs 64% district-wide (19 pts lower); this property's tenant base skews higher-income than the district average.
- Market conditions: Rents rising (+3.5%/yr); 672 active listings in the ZIP; 20 comparable units currently listed for rent nearby; rentals at typical pace (median 26d on market — plan ~3-4 weeks tenant-placement turnaround); solid renter incomes; 10,051 units permitted in Miami-Dade County in 2024 (7,758 in 5+ unit buildings).
- At $5,989/mo this rent would consume 67% of the median local household income ($107k/yr) (locally 870% of renters already pay >50% of income on rent) — very limited rent-growth headroom before tenants either downsize or default.
Forward outlook
- In year one you build about $12k of equity ($5k loan paydown + $7k appreciation (1.0% local appreciation)).
- Miami-Dade County population projected at +28% by 2050 — long-run rental-demand tailwind backs the buy-and-hold thesis.
- By year 4, paydown + projected appreciation supports a ~$45k cash-out refi (75% LTV) — recoverable capital for the next deal without selling this one.
Negotiation context
- It's been on market 41 days — a 3% lower offer ($728k) is reasonable based on typical stale-listing flexibility.
Risks & watch-outs
- Watch-outs: flood insurance adds $427/mo.
- Climate carrying-cost: in FEMA flood zone AE (mandatory federal flood insurance); severe wind risk, 99% chance of damaging wind over 30y; extreme-heat days projected 7→28/yr by 2055 (HVAC capex compounding) — expect insurance premiums to compound above CPI over the hold.
Questions for the listing agent
- What do current leases actually rent for vs. the listed asking? Can we see a recent rent roll and the last 12 months of T-12 income?
- It's been on market 41 days. Have you received any prior offers? Is the seller open to a 20% concession, seller financing, or rate buy-down credit?
- What's the actual annual flood-insurance premium (NFIP or private), and is the property in a SFHA with mandatory coverage?
- Is there a deadline driving the sale (1031 exchange, divorce, estate, relocation)? That informs how much negotiation room exists.
- Schools are A-rated — typically a magnet for longer-tenancy family renters. What's the average tenant stay here, and is there a school-zone premium baked into asking?
- The area grade is low — what's the realistic commute time and amenity access for the typical tenant pool here? Any planned neighborhood developments (good or bad) we should know about?
- What's the average days-on-market for RENTAL listings here right now (not sales)? A rising rental-DOM trend means longer vacancies and softer asking-rent achievability than the comps imply.
- What's the recent tenant-quality profile in this submarket — average credit score on applications, eviction rate, late-payment / NSF rate, and stable-employment percentage? A property-management company in the area should have these aggregated.
- How much new for-sale + rental construction is in the pipeline within 1–3 miles? Heavy new supply typically softens prices + rents 12–24 months out; constrained supply supports both.
Investment metrics
- 1% rule
- 0.80% ✗
- Cap rate
- 5.57%
- Cash-on-cash
- -2.58%
- DSCR
- 0.89
- GRM
- 10.4
CMA / ARV
- ARV (on-the-fly)
- $3,140,610
- Comps found
- 2
Show comp detail 2 sales within ~0.75 mi
| Address | Dist | Beds/Ba | Sqft | Sold | Price | $/sf | Match |
|---|---|---|---|---|---|---|---|
| 5100 Alton Rd | 0.24mi | 4/4.5 | 3,910 (+15%) | 14mo | $3,600,000 | $921 | 51 |
| 5757 Alton Rd | 0.48mi | 5/5.0 (+1) | 3,762 (+10%) | 12mo | $1,750,000 | $465 | 42 |
Match score weights: distance 35% · size 25% · config 20% · recency 20%. Top-matched comps best support the ARV.
Projected returns pro-forma
0.96% appreciation · 3.52% rent growth · sell at horizon
- IRR
- -3.7%
- Equity multiple
- 0.81×
- Total profit
- $-39,712
- Equity at exit
- $254,670
- IRR
- 1.8%
- Equity multiple
- 1.22×
- Total profit
- $47,123
- Equity at exit
- $337,378
Cash invested: $210,000 (down + closing). Projections, not guarantees.
Landlord ↔ Tenant lean methodology
- Overall (STATE)
- 87 Strongly Landlord-Friendly
- State Florida
- 87 Strongly Landlord-Friendly · R+3
- County
- — inherits STATE
- City
- — inherits STATE
ZIP-level market 33140
- Home prices YoY
- 0.3%
- Rents YoY
- 3.5%
- Active inventory
- 672
- Price-to-rent
- 10.4×
Monthly cashflow live
- Estimated rent
- $5,989 medium interval (Pro) →
- Mortgage (P&I)
- −$3,933
- Tax est. 1.5%
- −$938 /mo · $11,250/yr
- Insurance
- −$312
- Flood insurance flood zone
- −$427 /mo · $5,118/yr
- HOA
- −$0
- Vacancy / Maint / Mgmt
- −$1,258
- Net cashflow
- $-879
Break-even live
Sensitivity live
| Price | -10% $-360 | -5% $-619 | +0% $-879 | +5% $-1,138 | +10% $-1,397 |
|---|---|---|---|---|---|
| Rent | -10% $-1,352 | -5% $-1,115 | +0% $-879 | +5% $-642 | +10% $-405 |
| Rate | -1.0pp $-501 | -0.5pp $-688 | base $-879 | +0.5pp $-1,073 | +1.0pp $-1,271 |
UW: 25.0% down · 7.5% · 30yr · 1.5% tax · 5.0% vac · 8.0% maint · 8.0% mgmt
Financing live
Cash to close
- Down payment
- $187,500
- Closing costs
- $22,500
- Reserves months
- —
- Total cash needed
- —
Loan-product check · same deal, 3 products live
Conventional
25% down · 7.5% · 30yr
- Down + closing
- —
- Monthly P&I
- —
- Monthly cashflow
- —
- DSCR
- —
- Eligible?
- —
Personal DTI + credit; lowest rate.
DSCR
20% down · 8.5% · 30yr
- Down + closing
- —
- Monthly P&I
- —
- Monthly cashflow
- —
- DSCR
- —
- Eligible?
- —
No personal income docs; deal must DSCR.
Hard money
10% down · 12.0% · 12mo
- Down + closing
- —
- Monthly P&I
- —
- Monthly cashflow
- —
- DSCR
- —
- Eligible?
- —
Short-term bridge; refi at stabilization.
Rent comps 20 comps
| Address | Beds | Baths | Sqft | Rent | $/sqft | DOM | Units | Dist |
|---|---|---|---|---|---|---|---|---|
| 5237 Lagorce Dr Unit 5237 Miami Beach, FL | 4.0 | 4.0 | 2846 | $28,500 | $10.01 | 26d | 1 | 0.25mi |
| 5236 Pine Tree Dr Miami Beach, FL | 4.0 | 3.5 | 3140 | $26,000 | $8.28 | 24d | 1 | 0.28mi |
| 5621 Alton Rd Miami Beach, FL | 4.0 | 3.5 | 2986 | $19,500 | $6.53 | 24d | 1 | 0.33mi |
| 5621 Alton Rd Miami Beach, FL | 4.0 | 3.5 | 2986 | $19,500 | $6.53 | 14d | 1 | 0.33mi |
| 5736 Lagorce Dr Miami Beach, FL | 4.0 | 4.5 | 4400 | $35,000 | $7.95 | 26d | 1 | 0.49mi |
| 1081 W 48th St Miami Beach, FL | 4.0 | 4.5 | 4761 | $54,500 | $11.45 | 26d | 1 | 0.50mi |
| 1051 W 48th St Miami Beach, FL | 4.0 | 4.5 | 4257 | $59,500 | $13.98 | 26d | 1 | 0.51mi |
| 1051 W 48th St #4 Miami Beach, FL | 4.0 | 4.0 | 4257 | $59,500 | $13.98 | 26d | 1 | 0.52mi |
| 5800 Lagorce Dr Unit SFH Miami Beach, FL | 5.0 | 4.5 | 3741 | $36,000 | $9.62 | 26d | 1 | 0.55mi |
| 939 W 47th Ct Unit SFH Miami Beach, FL | 5.0 | 4.0 | 3630 | $29,000 | $7.99 | 26d | 1 | 0.58mi |
| 5911 Alton Rd Unit Sfh Miami, FL | 4.0 | 4.0 | 2561 | $18,500 | $7.22 | 26d | 1 | 0.65mi |
| 1201 W 47th St Miami Beach, FL | 5.0 | 5.0 | 3546 | $29,000 | $8.18 | 26d | 1 | 0.68mi |
| 1201 W 47th St Unit SFH Miami Beach, FL | 5.0 | 5.0 | 3000 | $29,500 | $9.83 | 26d | 1 | 0.68mi |
| 345 W 46th St #345 Miami Beach, FL | 4.0 | 4.5 | 3743 | $35,000 | $9.35 | 26d | 1 | 0.70mi |
| 5801 Collins Ave Miami Beach, FL | 4.0–5.0 | 5.0 | 4788 | $32,000 | $6.68 | 26d | 2 | 0.80mi |
| 5959 Collins Ave Miami Beach, FL | 2.0–3.0 | 3.5 | 2509 | $26,000 | $10.36 | 6d | 2 | 0.94mi |
| 5959 Collins Ave #807 Miami Beach, FL | 3.0 | 3.5 | 2959 | $26,000 | $8.79 | 16d | 1 | 0.95mi |
| 6000 Indian Creek Dr Unit 25C-3 Miami, FL | 3.0 | 3.5 | 2600 | $20,000 | $7.69 | 26d | 1 | 0.96mi |
| 6000 Indian Creek Dr Unit 25C-3 Miami, FL | 3.0 | 3.5 | 2600 | $20,000 | $7.69 | 9d | 1 | 0.96mi |
| 3784 Sheridan Ave Miami Beach, FL | 4.0 | 5.0 | 3192 | $20,000 | $6.27 | 26d | 1 | 1.27mi |
Listing history 15 events
-
2026-06-21days on market $750,000 Active 41 DOM
-
2026-06-18days on market $750,000 Active 38 DOM
-
2026-06-17days on market $750,000 Active 37 DOM
-
2026-06-16days on market $750,000 Active 36 DOM
-
2026-06-15days on market $750,000 Active 35 DOM
-
2026-06-13days on market $750,000 Active 33 DOM
-
2026-06-09days on market $750,000 Active 29 DOM
-
2026-06-08days on market $750,000 Active 28 DOM
-
2026-06-07days on market $750,000 Active 27 DOM
-
2026-06-04days on market $750,000 Active 24 DOM
-
2026-06-03days on market $750,000 Active 23 DOM
-
2026-06-02days on market $750,000 Active 22 DOM
-
2026-06-01days on market $750,000 Active 21 DOM
-
2026-05-31days on market $750,000 Active 20 DOM
-
2026-05-11$750,000 Active
ⓘ Source: listings_history table (triggers on properties + properties_extension) + one-shot
backfill from property_details.listing_events for pre-trigger history.
Climate risk First Street
- Flood 9/10 Extreme FEMA zone AE · 99% chance over 30 yrs
- Wildfire 1/10 Low
- Heat 10/10 Extreme 7 d/yr ≥101°F today · 28 d/yr by 30 yrs out
- Wind 10/10 Extreme 99% chance of damaging wind over 30 yrs
- Air quality 2/10 Low 1 unhealthy d/yr today · 1 by 30 yrs out
Nearby sold comps map
Loading sold comps map…
Walkable amenities ~0.75 mi
Loading nearby amenities…
Taxation est. · year 1
- Rental income
- $71,865
- − Mortgage interest
- −$42,012
- − Property taxes
- −$11,250
- − Insurance
- −$8,868
- − Repairs & maintenance
- −$5,749
- − Management
- −$5,749
- − Depreciation
- −$21,818
- Taxable loss
- −$23,582
- Est. tax savings @ 24.0%
- +$5,660
- After-tax cash flow
- $-4,883/yr
For passive investors: Depreciation is non-cash, so a rental often shows a tax loss while cash-flowing — sheltering income. Rental losses are passive: they offset passive income freely, and up to $25,000/yr can offset ordinary (W-2) income if you actively participate and your MAGI is under $100k (phasing out to $0 by $150k); unused losses carry forward. On sale, claimed depreciation is recaptured at up to 25%, and gains may owe capital-gains tax (a 1031 exchange can defer both). Figures are a year-1 estimate at your 24.0% rate — not tax advice; consult a CPA.
Condition & rehab AI · 12 photos
This co-ownership home in Miami Beach is in excellent condition with modern amenities and a beautiful outdoor space. It is move-in ready and offers a high ROI for both resale and rental.
Value-add opportunities
- Both Landscaping improvements — Enhances curb appeal and adds value.
- Both Painting exterior walls — Fresh paint can make the home look more appealing and increase its value.
- Both Upgrade to smart home technology — Modernizes the home and adds convenience for potential buyers/renters.
- Both Add a smart thermostat — Improves energy efficiency and adds a modern touch to the home.
Renovation cost estimate screening
Value-add ROI direction
- Both Landscaping improvements — Enhances curb appeal and adds value. ↑
- Both Painting exterior walls — Fresh paint can make the home look more appealing and increase its value. ↑
- Both Upgrade to smart home technology — Modernizes the home and adds convenience for potential buyers/renters. ↑
- Both Add a smart thermostat — Improves energy efficiency and adds a modern touch to the home. ↑
ⓘ Cost ranges are severity-bucket heuristics (US national rule-of-thumb). Get contractor quotes + a written scope before underwriting a rehab budget.
Schools (NCES district)
- District
- Miami-Dade
- NCES district ID
- 1200390
- Math proficiency
- 45% ▼ -16.00%
- Reading proficiency
- 54% ▼ -5.00%
- Median HH income
- $43,928
- Composite
- 41.76/100
- National rank
- #3397
- State rank
- #40 of 73 in FL
Livability — Miami Beach
- Score
- 80/100
- State rank
- #108
- US rank
- #1672
Category grades
Schools grade is shown separately in the Schools card above.
Census & demographics
- Census place
- Miami Beach, FL
- County
- Miami-Dade County · 2,697,751 people
- City population
- 90,533
- Metro
- Miami-Fort Lauderdale-Pompano Beach, FL
- Population (ZIP)
- 20,342
- Household income
- $107,063
- Rent vs Own
- Severe rent burden
- 870.0
Population outlook (Miami-Dade County) Hauer SSP2
- Today (2025)
- 3,126,439 people
- By 2030
- 3,325,765 · +6.4%
- By 2040
- 3,697,561 · +18.3%
- By 2050
- 4,012,134 · +28.3%
- By 2075
- 4,605,612 · +47.3%
- By 2100
- 4,866,598 · +55.7%
Race, ethnicity, and origin ACS 2023
- Neighborhood character
- Diverse neighborhood (Simpson 0.59)
- Race & ethnicity
- White 46% Hispanic / Latino 44% Two or more races 23% Black 3% Asian 2%
- Hispanic origin (detail)
- Mexican 2% Puerto Rican 2% Cuban 19% Salvadoran 6%
- Common ancestry
- Scotch-Irish 5% Romanian 3% Italian 3%
- Foreign-born
- 44% · Canada, Dominican Republic, Jamaica
- Languages at home
- 43% English-only · Spanish 45% Other Indo-European 6% French/Haitian/Cajun 2%
Political lean MEDSL · Miami-Dade
- 2024 margin
- R (+11.4) · D 43.9% · R 55.4%
- 2008→2024 swing
- -27.6pp toward R · 2008: 16.1pp · 2024: -11.4pp
- All cycles
- 2024: R+11.4 2020: D+7.3 2016: D+29.6 2012: D+23.7 2008: D+16.1
Not yet ingested
- Civics
- —
Market trends
- HPI YoY
- ▲ 0.96%
- Current HPI
- 302.8514
- Rent YoY
- ▲ 3.52%
- Metro
- Miami-Fort Lauderdale-Pompano Beach, FL
- State GDP YoY
- ▲ 3.28%
- F500 in state
- 36
Industry mix (Fortune 500 HQ in FL)
| Industry | F500 HQs | Revenue |
|---|---|---|
| Industrial Technology | 2 | $29B |
|
||
| Insurance | 2 | $17B |
|
||
| Retail | 1 | $60B |
|
||
| Technology Distribution | 1 | $58B |
|
||
| Homebuilding | 1 | $35B |
|
||
| Technology Manufacturing | 1 | $35B |
|
||
Price history
1 event — show timeline
- 2026-05-11 Listed $750,000 Beaches MLS
Cash-flow waterfall
monthlySold comps — $/sqft
last 12 mo · ≤1 miLoading sold comps…