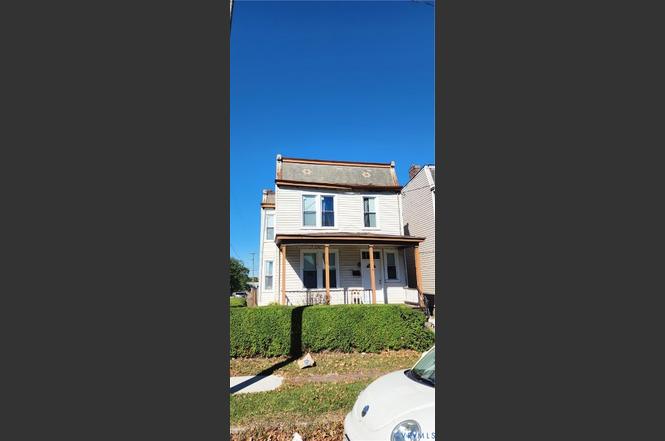
1100 N 20th St · Richmond, VA
Flood risk 1/10 · Minimal
- FEMA flood zone
- X (unshaded)
- Chance of flooding over 30 yrs
- 0.0%
- Est. flood insurance / yr
- $507 – $1,088
Fire risk 1/10 · Minimal
- Est. fire insurance / yr
- $666 – $1,236
Heat risk 7/10 · Major
- Hot days now (above 105°F)
- 7 days/yr
- Hot days in 30 yrs
- 16 days/yr
Wind risk 6/10 · Moderate
- Chance of severe wind over 30 yrs
- 27.0%
Air-quality risk 2/10 · Minimal
- Unhealthy air days now
- 1 days/yr
- Unhealthy air days in 30 yrs
- 2 days/yr
Risk factors via First Street. Map © Google.
Why this score? — see what drove the C+ grade
The composite is a weighted blend of 9 inputs, each scored 0–100. Each bar is that input's sub-score; the figure is the points it added to the 100-point composite (weight × sub-score).
- Cash flow +25.9/30.0
- DSCR +8.7/10.0
- ARV discount +7.5/15.0
- 1% rule +6.1/10.0
- Livability +4.2/5.0
- Rent growth +4.1/5.0
- Schools +3.3/10.0
- Condition / age +2.5/5.0
- Appreciation +0.0/10.0
$215,000
🖨 Deal sheet 📄 Offer letter ✓ Due diligence
Listing remarks
Investment Opportunity, in Beautiful Downtown / Church Hill Area. This exceptional investment property is on a corner lot, and it is in a great Location!! In the passed 5-7 years, the owner invested in 22 new windows, a new mailbox, front door, and back door. It is surrounded by highly desirable areas such as hospitals, colleges, shopping, entertainment, bus lines, schools, interstate, and so much more. This home needs TLC and is being SOLD AS IS, WHERE IS. NO REPAIRS WILL BE MADE. The Home Inspection is for informational purposes only. Investors, don't miss out on an excellent appreciated investment opportunity.
Key facts
- Corner lot
- New windows
- 3,959 sq ft lot
Tags
Neighborhood map
What this means for you Summary
Snapshot
- This is a 4-bed/1.0-bath single-family listed at $215k.
Deal economics
- At list price, monthly cash flow is $526 ($6k/yr) — positive.
- The deal already cash-flows at list — no discount required.
- Meets the 1% rule at list price ($2k rent vs $215k).
- Cap rate 9.2% vs local median 3.3% in Richmond — top-decile yield for the area; either an underpriced asset or a hidden risk that comps aren't pricing in. Stress-test before assuming the spread holds.
Location & tenants
- Location reads 84/100 on livability (#33 in VA, #793 nationally) — a professional / high-income tenant draw. Strengths: amenities A+, commute A+, health & safety A+; Watch: crime D-.
- Richmond City Public School District (urban): math 32% / reading 47% proficiency, ranked #123 of 131 in VA (top 94%) — families likely to look elsewhere, expect single-tenant / working-renter base with shorter leases; 74% free/reduced lunch — lower-income household profile, screen leases tightly.
- Market conditions: Rents rising fast (+6.4%/yr); 337 active listings in the ZIP; 26 comparable units currently listed for rent nearby; rentals at typical pace (median 17d on market — plan ~3-4 weeks tenant-placement turnaround); 2,540 units permitted in Richmond city in 2024 (2,077 in 5+ unit buildings).
- At $2,390/mo this rent would consume 51% of the median local household income ($56k/yr) (locally 3530% of renters already pay >50% of income on rent) — very limited rent-growth headroom before tenants either downsize or default.
Forward outlook
- Local home prices are declining (-3.0%/yr); year-one equity from $1k of loan paydown is wiped out by about $6k of value loss. Plan a longer hold.
- Richmond County population projected at +40% by 2050 — long-run rental-demand tailwind backs the buy-and-hold thesis.
- At projected returns (-3.0% appreciation + 6.4% rent growth), your $60k cash investment doubles in ~8 years — after that, you're playing with house money.
Negotiation context
- Only 13 days on market — expect competitive offers; lowballing is unlikely to land.
- 2 sale attempts with the ask held roughly flat each time — persistent listings suggest the price (not the market) is what's stuck; bring a comps-based counter.
- Current owner paid $40k; list at $215k implies a 438% gain — meaningful room to come down on a strong offer.
Risks & watch-outs
- Watch-outs: built in 1910 — expect roof / HVAC / electrical / plumbing capex.
- Climate carrying-cost: major wind risk, 27% chance of damaging wind over 30y; extreme-heat days projected 7→16/yr by 2055 (HVAC capex compounding) — expect insurance premiums to compound above CPI over the hold.
Questions for the listing agent
- Built in 1910 — when were the roof, HVAC, electrical panel, plumbing, and water heater last replaced?
- Is there a deadline driving the sale (1031 exchange, divorce, estate, relocation)? That informs how much negotiation room exists.
- Schools are A-rated — typically a magnet for longer-tenancy family renters. What's the average tenant stay here, and is there a school-zone premium baked into asking?
- Crime grade is D in this area — have there been break-ins, vandalism, or insurance claims at this property in the last 3 years? What carrier currently insures it and at what premium?
- What's the average days-on-market for RENTAL listings here right now (not sales)? A rising rental-DOM trend means longer vacancies and softer asking-rent achievability than the comps imply.
- What's the recent tenant-quality profile in this submarket — average credit score on applications, eviction rate, late-payment / NSF rate, and stable-employment percentage? A property-management company in the area should have these aggregated.
- How much new for-sale + rental construction is in the pipeline within 1–3 miles? Heavy new supply typically softens prices + rents 12–24 months out; constrained supply supports both.
Investment metrics
- 1% rule
- 1.11% ✓
- Cap rate
- 9.23%
- Cash-on-cash
- 10.48%
- DSCR
- 1.47
- GRM
- 7.5
CMA / ARV
- ARV (on-the-fly)
- $474,264
- Comps found
- 12
Show comp detail 12 sales within ~0.75 mi
| Address | Dist | Beds/Ba | Sqft | Sold | Price | $/sf | Match |
|---|---|---|---|---|---|---|---|
| 2402 Carrington St | 0.24mi | 3/2.5 (-1) | 1,800 (-4%) | 1mo | $445,000 | $247 | 70 |
| 2206 Jefferson Ave | 0.47mi | 3/2.5 (-1) | 1,892 (+0%) | 0mo | $565,000 | $299 | 66 |
| 2220 Jefferson Ave | 0.46mi | 3/2.5 (-1) | 1,900 (+1%) | 1mo | $540,000 | $284 | 65 |
| 1516 N 22nd St | 0.36mi | 3/2.5 (-1) | 1,792 (-5%) | 1mo | $399,900 | $223 | 63 |
| 1110 N 23rd St | 0.19mi | 3/2.5 (-1) | 1,670 (-11%) | 0mo | $382,500 | $229 | 61 |
| 509 Mosby St | 0.42mi | 3/1.5 (-1) | 1,744 (-7%) | 1mo | $360,000 | $206 | 61 |
| 517 N 24th St | 0.49mi | 3/2.5 (-1) | 2,024 (+8%) | 0mo | $625,000 | $309 | 53 |
| 815 N 27th St | 0.50mi | 3/2.5 (-1) | 2,020 (+7%) | 1mo | $510,000 | $252 | 52 |
| 902 1/3 N 28th St | 0.52mi | 4/3.0 | 2,110 (+12%) | 0mo | $549,950 | $261 | 47 |
| 1319 N 28th St | 0.55mi | 3/2.5 (-1) | 1,682 (-11%) | 1mo | $420,000 | $250 | 45 |
| 1307 N 28th St | 0.55mi | 4/3.5 | 2,112 (+12%) | 0mo | $570,000 | $270 | 44 |
| 1313 N 31st St | 0.74mi | 3/2.5 (-1) | 1,624 (-14%) | 0mo | $390,000 | $240 | 31 |
Match score weights: distance 35% · size 25% · config 20% · recency 20%. Top-matched comps best support the ARV.
Projected returns pro-forma
-3.0% appreciation · 6.38% rent growth · sell at horizon
- IRR
- 2.9%
- Equity multiple
- 1.12×
- Total profit
- $7,009
- Equity at exit
- $32,057
- IRR
- 15.3%
- Equity multiple
- 2.43×
- Total profit
- $86,021
- Equity at exit
- $18,589
Cash invested: $60,200 (down + closing). Projections, not guarantees.
Landlord ↔ Tenant lean methodology
- Overall (STATE)
- 55 Moderately Landlord-Leaning
- State Virginia
- 55 Moderately Landlord-Leaning · D+2
- County
- — inherits STATE
- City
- — inherits STATE
ZIP-level market 23223
- Rents YoY
- 6.4%
- Active inventory
- 337
- Price-to-rent
- 7.5×
Monthly cashflow live
- Estimated rent
- $2,390 high interval (Pro) →
- Mortgage (P&I)
- −$1,127
- Tax from tax record
- −$145 /mo · $1,740/yr
- Insurance
- −$90
- HOA
- −$0
- Vacancy / Maint / Mgmt
- −$502
- Net cashflow
- $526
Break-even live
UW: 25.0% down · 7.5% · 30yr · 1.5% tax · 5.0% vac · 8.0% maint · 8.0% mgmt
Financing live
Cash to close
- Down payment
- $53,750
- Closing costs
- $6,450
- Reserves months
- —
- Total cash needed
- —
Loan-product check · same deal, 3 products live
Conventional
25% down · 7.5% · 30yr
- Down + closing
- —
- Monthly P&I
- —
- Monthly cashflow
- —
- DSCR
- —
- Eligible?
- —
Personal DTI + credit; lowest rate.
DSCR
20% down · 8.5% · 30yr
- Down + closing
- —
- Monthly P&I
- —
- Monthly cashflow
- —
- DSCR
- —
- Eligible?
- —
No personal income docs; deal must DSCR.
Hard money
10% down · 12.0% · 12mo
- Down + closing
- —
- Monthly P&I
- —
- Monthly cashflow
- —
- DSCR
- —
- Eligible?
- —
Short-term bridge; refi at stabilization.
Rent comps 26 comps
| Address | Beds | Baths | Sqft | Rent | $/sqft | DOM | Units | Dist |
|---|---|---|---|---|---|---|---|---|
| 1004 1/2 N 21st St Unit A Richmond, VA | 3.0 | 2.0 | 1248 | $2,195 | $1.76 | 17d | 1 | 0.11mi |
| 1313 N 20th St Richmond, VA | 3.0 | 2.0 | 2000 | $2,045 | $1.02 | 11d | 1 | 0.18mi |
| 2209 Fairmount Ave Richmond, VA | 3.0 | 2.0 | 1652 | $2,500 | $1.51 | 43d | 1 | 0.23mi |
| 1308 N 23rd St Richmond, VA | 3.0 | 2.5 | 2052 | $2,900 | $1.41 | 17d | 1 | 0.27mi |
| 1427 N 22nd St Richmond, VA | 3.0 | 2.5 | 1764 | $2,700 | $1.53 | 43d | 1 | 0.32mi |
| 2003 Cedar St Richmond, VA | 3.0 | 2.0 | 1420 | $2,200 | $1.55 | 43d | 1 | 0.38mi |
| 1221 N 26th St Richmond, VA | 3.0 | 2.5 | 1900 | $2,700 | $1.42 | 23d | 1 | 0.44mi |
| 1920 Princess Anne Ave Richmond, VA | 3.0 | 2.0 | 2000 | $2,595 | $1.30 | 4d | 1 | 0.47mi |
| 1107 N 27th St Richmond, VA | 3.0 | 3.5 | 1792 | $2,600 | $1.45 | 4d | 1 | 0.50mi |
| 901 N 27th St Apt 1 Richmond, VA | 4.0 | 1.0 | 1240 | $2,000 | $1.61 | 17d | 1 | 0.52mi |
| 2820 Q St Richmond, VA | 3.0 | 2.0 | 1523 | $2,195 | $1.44 | 4d | 1 | 0.59mi |
| 1614 N 19th St Richmond, VA | 4.0 | 2.0 | 1584 | $2,395 | $1.51 | 4d | 1 | 0.60mi |
| 1404 N 30th St Richmond, VA | 3.0 | 2.5 | 1700 | $2,195 | $1.29 | 4d | 1 | 0.68mi |
| 3018 S St Richmond, VA | 3.0 | 2.5 | 1786 | $2,645 | $1.48 | 43d | 1 | 0.73mi |
| 1901 E Franklin St Apt 5 Richmond, VA | 3.0 | 3.0 | 1530 | $1,850 | $1.21 | 23d | 1 | 0.80mi |
| 2201 E Franklin St Richmond, VA | 1.0–3.0 | 1.0–3.0 | 905 | $2,349 | $2.59 | 3d | 7 | 0.81mi |
| 307 N 29th St Richmond, VA | 3.0 | 3.0 | 1992 | $2,900 | $1.46 | 4d | 1 | 0.86mi |
| 811 N 33rd St Unit A Richmond, VA | 3.0 | 2.0 | 1315 | $1,900 | $1.44 | 17d | 1 | 0.89mi |
| 811 N 33rd St Unit A Richmond, VA | 3.0 | 2.0 | 1315 | $1,900 | $1.44 | 4d | 1 | 0.89mi |
| 2 S 25th St Richmond, VA | 1.0–3.0 | 1.0–2.0 | 1050 | $2,360 | $2.25 | 2d | 69 | 0.95mi |
| 216 N 32nd St Unit A Richmond, VA | 4.0 | 2.5 | 2312 | $2,650 | $1.15 | 23d | 1 | 1.03mi |
| 823 E Main St Richmond, VA | 3.0 | 1.0–2.5 | 1178 | $2,687 | $2.28 | 1d | 14 | 1.13mi |
| 326 E Broad St Richmond, VA | 1.0–3.0 | 1.0–2.0 | 925 | $2,199 | $2.38 | 2d | 4 | 1.17mi |
| 724 N 1st St Richmond, VA | 3.0 | 2.5 | 1704 | $3,000 | $1.76 | 43d | 1 | 1.22mi |
| 105 E Broad St Unit 2B Richmond, VA | 3.0 | 3.0 | 2322 | $2,795 | $1.20 | 4d | 1 | 1.34mi |
| 207 Welford St Richmond, VA | 3.0 | 1.5 | 1348 | $1,850 | $1.37 | 23d | 1 | 1.37mi |
Listing history 6 events
-
2025-11-07status Pending
-
2025-10-26status Active
-
2025-10-24historical
-
2025-10-22$215,000 Active
-
1988-04-18soldstatus $40,000
-
1987-10-23soldstatus $21,100
ⓘ Source: listings_history table (triggers on properties + properties_extension) + one-shot
backfill from property_details.listing_events for pre-trigger history.
Tax reassessment forecast VA · Resets to sale price
- Current annual tax
- $1,740 · $145/mo
- Projected year-2 tax
- $1,763 · $147/mo
- Expected delta
- +$23/yr (+$2/mo · 1.3%)
ⓘ Screening estimate from a state-policy table — verify with the county assessor before closing.
Climate risk First Street
- Flood 1/10 Low FEMA zone X (unshaded) · 0% chance over 30 yrs
- Wildfire 1/10 Low
- Heat 7/10 Severe 7 d/yr ≥105°F today · 16 d/yr by 30 yrs out
- Wind 6/10 Major 27% chance of damaging wind over 30 yrs
- Air quality 2/10 Low 1 unhealthy d/yr today · 2 by 30 yrs out
Nearby sold comps map
Loading sold comps map…
Walkable amenities ~0.75 mi
Loading nearby amenities…
Taxation est. · year 1
- Rental income
- $28,676
- − Mortgage interest
- −$12,043
- − Property taxes
- −$1,740
- − Insurance
- −$1,075
- − Repairs & maintenance
- −$2,294
- − Management
- −$2,294
- − Depreciation
- −$6,255
- Taxable income
- $2,975
- Est. tax owed @ 24.0%
- −$714
- After-tax cash flow
- $5,595/yr
For passive investors: Depreciation is non-cash, so a rental often shows a tax loss while cash-flowing — sheltering income. Rental losses are passive: they offset passive income freely, and up to $25,000/yr can offset ordinary (W-2) income if you actively participate and your MAGI is under $100k (phasing out to $0 by $150k); unused losses carry forward. On sale, claimed depreciation is recaptured at up to 25%, and gains may owe capital-gains tax (a 1031 exchange can defer both). Figures are a year-1 estimate at your 24.0% rate — not tax advice; consult a CPA.
Schools (NCES district)
- District
- Richmond City Public School District
- NCES district ID
- 5103240
- Math proficiency
- 32% ▼ -24.00%
- Reading proficiency
- 47% ▼ -9.00%
- Median HH income
- $40,276
- Composite
- 33.09/100
- National rank
- #5564
- State rank
- #123 of 131 in VA
Livability — Richmond
- Score
- 84/100
- State rank
- #33
- US rank
- #793
Category grades
Schools grade is shown separately in the Schools card above.
Census & demographics
- Census place
- Richmond, VA
- County
- Henrico County · 334,490 people
- City population
- 287,109
- Metro
- Richmond, VA
- Population (ZIP)
- 54,659
- Household income
- $55,731
- Rent vs Own
- Severe rent burden
- 3530.0
Population outlook (Richmond County) Hauer SSP2
- Today (2025)
- 262,263 people
- By 2030
- 284,503 · +8.5%
- By 2040
- 327,353 · +24.8%
- By 2050
- 367,946 · +40.3%
- By 2075
- 449,560 · +71.4%
- By 2100
- 500,301 · +90.8%
Race, ethnicity, and origin ACS 2023
- Neighborhood character
- Predominantly Black (71%)
- Race & ethnicity
- Black 71% White 19% Two or more races 5% Hispanic / Latino 5%
- Common ancestry
- Romanian 1% Lithuanian 1% Slovak 1%
- Foreign-born
- 4% · Canada
- Languages at home
- 93% English-only · Spanish 4% French/Haitian/Cajun 1% Other Indo-European 1%
Political lean MEDSL · Richmond
- 2024 margin
- Solid D (+66.3) · D 82.0% · R 15.8% · Other 2.2%
- 2008→2024 swing
- +7.2pp toward D · 2008: 59.1pp · 2024: 66.3pp
- All cycles
- 2024: D+66.3 2020: D+68.0 2016: D+63.8 2012: D+55.7 2008: D+59.1
Not yet ingested
- Civics
- —
Market trends
- HPI YoY
- ▼ -257.81%
- Current HPI
- 324.0589
- Rent YoY
- ▲ 6.38%
- Metro
- Richmond, VA
- State GDP YoY
- ▲ 2.40%
- F500 in state
- 50
Industry mix (Fortune 500 HQ in VA)
| Industry | F500 HQs | Revenue |
|---|---|---|
| Aerospace / Defense | 4 | $236B |
|
||
| Technology / Defense | 3 | $32B |
|
||
| Financial Services | 2 | $176B |
|
||
| Utilities | 2 | $27B |
|
||
| Insurance | 2 | $25B |
|
||
| Technology | 2 | $15B |
|
||
Price history
+919.0% since first listed6 events — show timeline
- 2025-11-07 Pending — CVRMLS
- 2025-10-26 Relisted — CVRMLS
- 2025-10-24 Listing Removed — CVRMLS
- 2025-10-22 Listed $215,000 CVRMLS
- 1988-04-18 Sold (Public Records) $40,000 Public Records
- 1987-10-23 Sold (Public Records) $21,100 Public Records
Property tax history
+7.9%/yrLatest (2022): $1,740 · +70.6% YoY. Source: county tax records.
Cash-flow waterfall
monthlySold comps — $/sqft
last 12 mo · ≤1 miLoading sold comps…