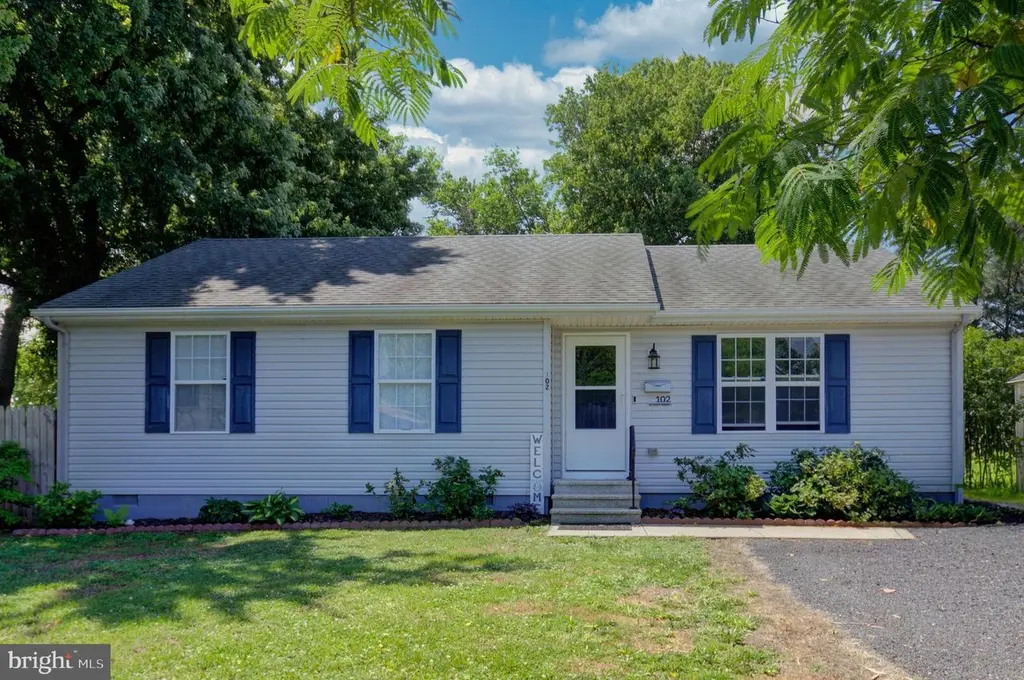
102 W East St · Delmar, MD
Flood risk 1/10 · Minimal
- FEMA flood zone
- X (unshaded)
- Chance of flooding over 30 yrs
- 0.0%
- Est. flood insurance / yr
- $507 – $1,088
Fire risk 2/10 · Minimal
- Est. fire insurance / yr
- $755 – $1,403
Heat risk 8/10 · Major
- Hot days now (above 106°F)
- 7 days/yr
- Hot days in 30 yrs
- 16 days/yr
Wind risk 7/10 · Major
- Chance of severe wind over 30 yrs
- 78.0%
Air-quality risk 2/10 · Minimal
- Unhealthy air days now
- 2 days/yr
- Unhealthy air days in 30 yrs
- 2 days/yr
Risk factors via First Street. Map © Google.
Why this score? — see what drove the D- grade
The composite is a weighted blend of 9 inputs, each scored 0–100. Each bar is that input's sub-score; the figure is the points it added to the 100-point composite (weight × sub-score).
- Cash flow +14.2/30.0
- ARV discount +7.4/15.0
- DSCR +4.3/10.0
- Livability +3.4/5.0
- 1% rule +3.0/10.0
- Rent growth +2.5/5.0
- Condition / age +2.5/5.0
- Schools +1.9/10.0
- Appreciation +0.0/10.0
$237,000
🖨 Deal sheet 📄 Offer letter ✓ Due diligence
Listing remarks MLS
Take a look at this charming 3 Bedroom 2 Bathroom home in Delmar. This home has a Master Bedroom & Bathroom as well as large living room. Home has a Shed and rear deck as well. This is a HUD Owned property and all HUD properties are Sold AS IS. For more information visit www. hudhomestore.com or www. olympusams-re.com This property s case number is 241 809557.
Key facts
- 0.26 acre lot
- 2 parking spots
- Built 2005
Property features AI
Exterior
- Parking: Driveway parking (2 spaces); Total of 2 garage/parking spaces
- Utilities: Public water; Public sewer; Electric service for heating, cooling and hot water
- Home design: Detached property; Effective remodel year 2026; Ownership is fee simple
- Construction: Aluminum siding; Vinyl siding; Block foundation
- Exterior features: Privacy fenced yard; Property is in city limits (Delmar); Above-grade and below-grade structures noted
Interior
- Kitchen: Kitchen listed
- Bedrooms: 3 bedrooms on the main level (Living Room, Master Bedroom, Bedroom 2, Bedroom 3 listed among rooms)
- Bathrooms: 2 full bathrooms on the main level
- Heating & cooling: Heat pump(s) heating; Central air conditioning; Electric heating and cooling systems; Electric hot water
- Interior features: Estimated living area; No basement
Neighborhood map
What this means for you Summary
Snapshot
- This is a 3-bed/2.0-bath single-family listed at $237k.
Deal economics
- At list price, monthly cash flow is $39 ($472/yr) — positive.
- The deal already cash-flows at list — no discount required.
- To meet the 1% rule (rent ≥ 1% of price), the offer needs to be $189k (20.1% below list).
- Recommended offer: $189k (20.1% below list) — sets the bar for 1% rule.
- Cap rate 6.5% vs local median 5.1% in Delmar — meaningfully above typical; check what's discounted (condition, days-on-market, listing class) to confirm the premium yield is real.
Location & tenants
- Location reads 67/100 on livability (#222 in MD) — a middle-class / working-renter tenant base. Strengths: housing A+, cost of living A; Watch: schools D+, amenities F, commute F.
- Wicomico County Public Schools (urban): math 16% / reading 26% proficiency, ranked #19 of 24 in MD (top 79%) — low school quality limits family demand, transient renter base, plan for 1-2y turnover.
- Market conditions: 46 active listings in the ZIP; 278 units permitted in Wicomico County in 2024 (44 in 5+ unit buildings).
Forward outlook
- Local home prices are declining (-3.0%/yr); year-one equity from $2k of loan paydown is wiped out by about $7k of value loss. Plan a longer hold.
- Wicomico County population projected at +14% by 2050 — modest demand growth; plan on rents tracking national, not racing it.
Negotiation context
- Only 5 days on market — expect competitive offers; lowballing is unlikely to land.
- 3 sale attempts since 8y ago; this cycle's ask is 106% above the opening price — seller raised mid-cycle; expect resistance to lowballs.
- Current owner paid $113k; list at $237k implies a 110% gain — meaningful room to come down on a strong offer.
Risks & watch-outs
- Climate carrying-cost: major wind risk, 78% chance of damaging wind over 30y; extreme-heat days projected 7→16/yr by 2055 (HVAC capex compounding) — expect insurance premiums to compound above CPI over the hold.
Questions for the listing agent
- Is there a deadline driving the sale (1031 exchange, divorce, estate, relocation)? That informs how much negotiation room exists.
- Schools are D-rated, which usually means shorter tenancies and higher turnover. Who's the typical renter profile here, and what's been the actual vacancy rate?
- The area grade is low — what's the realistic commute time and amenity access for the typical tenant pool here? Any planned neighborhood developments (good or bad) we should know about?
- What's the average days-on-market for RENTAL listings here right now (not sales)? A rising rental-DOM trend means longer vacancies and softer asking-rent achievability than the comps imply.
- What's the recent tenant-quality profile in this submarket — average credit score on applications, eviction rate, late-payment / NSF rate, and stable-employment percentage? A property-management company in the area should have these aggregated.
- How much new for-sale + rental construction is in the pipeline within 1–3 miles? Heavy new supply typically softens prices + rents 12–24 months out; constrained supply supports both.
Investment metrics
- 1% rule
- 0.80% ✗
- Cap rate
- 6.49%
- Cash-on-cash
- 0.71%
- DSCR
- 1.03
- GRM
- 10.4
CMA / ARV
- ARV (on-the-fly)
- $236,256
- Comps found
- 4
Show comp detail 4 sales within ~0.75 mi
| Address | Dist | Beds/Ba | Sqft | Sold | Price | $/sf | Match |
|---|---|---|---|---|---|---|---|
| 16 W East St | 0.03mi | 3/2.0 | 1,104 (0%) | 18mo | $235,900 | $214 | 84 |
| 3 W Pine St | 0.18mi | 3/2.0 | 1,162 (+5%) | 18mo | $225,000 | $194 | 68 |
| 8 W Grove St | 0.16mi | 2/1.0 (-1) | 1,080 (-2%) | 18mo | $122,920 | $114 | 65 |
| 403 N 2nd St | 0.45mi | 3/2.0 | 1,226 (+11%) | 18mo | $309,500 | $252 | 46 |
Match score weights: distance 35% · size 25% · config 20% · recency 20%. Top-matched comps best support the ARV.
Projected returns pro-forma
-3.0% appreciation · 3.0% rent growth · sell at horizon
- IRR
- -15.2%
- Equity multiple
- 0.46×
- Total profit
- $-35,980
- Equity at exit
- $35,337
- IRR
- -6.7%
- Equity multiple
- 0.57×
- Total profit
- $-28,438
- Equity at exit
- $20,491
Cash invested: $66,360 (down + closing). Projections, not guarantees.
Landlord ↔ Tenant lean methodology
- Overall (STATE)
- 27 Tenant-Leaning
- State Maryland
- 27 Tenant-Leaning · D+14
- County
- — inherits STATE
- City
- — inherits STATE
ZIP-level market 21875
- Home prices YoY
- -12.7%
- Active inventory
- 46
- Price-to-rent
- 10.4×
Monthly cashflow live
- Estimated rent
- $1,894 medium interval (Pro) →
- Mortgage (P&I)
- −$1,243
- Tax from tax record
- −$116 /mo · $1,387/yr
- Insurance
- −$99
- HOA
- −$0
- Vacancy / Maint / Mgmt
- −$398
- Net cashflow
- $39
Break-even live
UW: 25.0% down · 7.5% · 30yr · 1.5% tax · 5.0% vac · 8.0% maint · 8.0% mgmt
Financing live
Cash to close
- Down payment
- $59,250
- Closing costs
- $7,110
- Reserves months
- —
- Total cash needed
- —
Loan-product check · same deal, 3 products live
Conventional
25% down · 7.5% · 30yr
- Down + closing
- —
- Monthly P&I
- —
- Monthly cashflow
- —
- DSCR
- —
- Eligible?
- —
Personal DTI + credit; lowest rate.
DSCR
20% down · 8.5% · 30yr
- Down + closing
- —
- Monthly P&I
- —
- Monthly cashflow
- —
- DSCR
- —
- Eligible?
- —
No personal income docs; deal must DSCR.
Hard money
10% down · 12.0% · 12mo
- Down + closing
- —
- Monthly P&I
- —
- Monthly cashflow
- —
- DSCR
- —
- Eligible?
- —
Short-term bridge; refi at stabilization.
Listing history 10 events
-
2026-06-17status $237,000 Pending 5 DOM
-
2026-06-17days on market $237,000 Active 5 DOM
-
2026-06-16days on market $237,000 Active 4 DOM
-
2026-06-15days on market $237,000 Active 3 DOM
-
2026-06-13statusdays on market $237,000 Active 1 DOM
-
2026-06-10days on market $237,000 Coming Soon 5 DOM
-
2026-06-09days on market $237,000 Coming Soon 4 DOM
-
2026-06-08days on market $237,000 Coming Soon 3 DOM
-
2026-06-07remarks 699-char remark
-
2026-06-07$237,000 Coming Soon 2 DOM
ⓘ Source: listings_history table (triggers on properties + properties_extension) + one-shot
backfill from property_details.listing_events for pre-trigger history.
Tax reassessment forecast MD · Partial reset (capped growth)
- Current annual tax
- $1,387 · $116/mo
- Projected year-2 tax
- $1,985 · $165/mo
- Expected delta
- +$598/yr (+$50/mo · 43.1%)
ⓘ Screening estimate from a state-policy table — verify with the county assessor before closing.
Climate risk First Street
- Flood 1/10 Low FEMA zone X (unshaded) · 0% chance over 30 yrs
- Wildfire 2/10 Low
- Heat 8/10 Severe 7 d/yr ≥106°F today · 16 d/yr by 30 yrs out
- Wind 7/10 Severe 78% chance of damaging wind over 30 yrs
- Air quality 2/10 Low 2 unhealthy d/yr today · 2 by 30 yrs out
Nearby sold comps map
Loading sold comps map…
Walkable amenities ~0.75 mi
Loading nearby amenities…
Taxation est. · year 1
- Rental income
- $22,733
- − Mortgage interest
- −$13,276
- − Property taxes
- −$1,387
- − Insurance
- −$1,185
- − Repairs & maintenance
- −$1,819
- − Management
- −$1,819
- − Depreciation
- −$6,895
- Taxable loss
- −$3,647
- Est. tax savings @ 24.0%
- +$875
- After-tax cash flow
- $1,348/yr
For passive investors: Depreciation is non-cash, so a rental often shows a tax loss while cash-flowing — sheltering income. Rental losses are passive: they offset passive income freely, and up to $25,000/yr can offset ordinary (W-2) income if you actively participate and your MAGI is under $100k (phasing out to $0 by $150k); unused losses carry forward. On sale, claimed depreciation is recaptured at up to 25%, and gains may owe capital-gains tax (a 1031 exchange can defer both). Figures are a year-1 estimate at your 24.0% rate — not tax advice; consult a CPA.
Schools (NCES district)
- District
- Wicomico County Public Schools
- NCES district ID
- 2400690
- Math proficiency
- 16% ▼ -18.00%
- Reading proficiency
- 26% ▼ -13.00%
- Median HH income
- $51,745
- Composite
- 18.87/100
- National rank
- #8860
- State rank
- #19 of 24 in MD
Livability — Delmar
- Score
- 67/100
- State rank
- #222
- US rank
- #11130
Category grades
Schools grade is shown separately in the Schools card above.
Census & demographics
- Census place
- Delmar, MD
- Population (ZIP)
- 7,455
Population outlook (Wicomico County) Hauer SSP2
- Today (2025)
- 108,548 people
- By 2030
- 111,783 · +3.0%
- By 2040
- 118,139 · +8.8%
- By 2050
- 123,641 · +13.9%
- By 2075
- 139,784 · +28.8%
- By 2100
- 145,334 · +33.9%
Race, ethnicity, and origin ACS 2023
- Neighborhood character
- Majority White (64%)
- Race & ethnicity
- White 64% Black 19% Hispanic / Latino 9% Asian 6% Two or more races 4%
- Hispanic origin (detail)
- Mexican 5%
- Common ancestry
- Italian 2% Lithuanian 2% Serbian 1%
- Foreign-born
- 9% · Canada, South Korea
- Languages at home
- 84% English-only · Spanish 9% Korean 3% Other Indo-European 2%
Political lean MEDSL · Wicomico
- 2024 margin
- Lean R (+5.5) · D 46.1% · R 51.5% · Other 2.4%
- 2008→2024 swing
- +0.3pp no change · 2008: -5.8pp · 2024: -5.5pp
- All cycles
- 2024: R+5.5 2020: R+1.9 2016: R+11.6 2012: R+6.9 2008: R+5.8
Not yet ingested
- Civics
- —
Market trends
- HPI YoY
- ▼ -36.12%
- Current HPI
- 247.5758
- Rent YoY
- —
- Metro
- —
- State GDP YoY
- ▲ 2.97%
- F500 in state
- 12
Industry mix (Fortune 500 HQ in MD)
| Industry | F500 HQs | Revenue |
|---|---|---|
| Aerospace / Defense | 1 | $71B |
|
||
| Utilities | 1 | $25B |
|
||
| Hotels | 1 | $24B |
|
||
| Consumer Goods | 1 | $7B |
|
||
| Real Estate | 1 | $6B |
|
||
| Chemicals | 1 | $2B |
|
||
Price history
+2708.1% since first listed12 events — show timeline
- 2026-06-05 Coming Soon $237,000 BRIGHT MLS
- 2019-07-09 Sold (Public Records) $113,000 Public Records
- 2019-07-03 Sold (MLS) $113,000 BRIGHT MLS
- 2019-06-05 Pending — BRIGHT MLS
- 2019-05-28 Relisted — BRIGHT MLS
- 2019-05-09 Pending — BRIGHT MLS
- 2019-04-17 Listed $115,000 BRIGHT MLS
- 2019-02-05 Listing Removed — BRIGHT MLS
- 2018-12-17 Listed $117,040 BRIGHT MLS
- 2005-07-12 Sold (Public Records) $143,900 Public Records
- 2003-04-11 Sold (Public Records) $58,000 Public Records
- 1997-04-10 Sold (Public Records) $8,440 Public Records
Property tax history
-1.8%/yrLatest (2025): $1,387 · +8.2% YoY. Source: county tax records.
Cash-flow waterfall
monthlySold comps — $/sqft
last 12 mo · ≤1 miLoading sold comps…