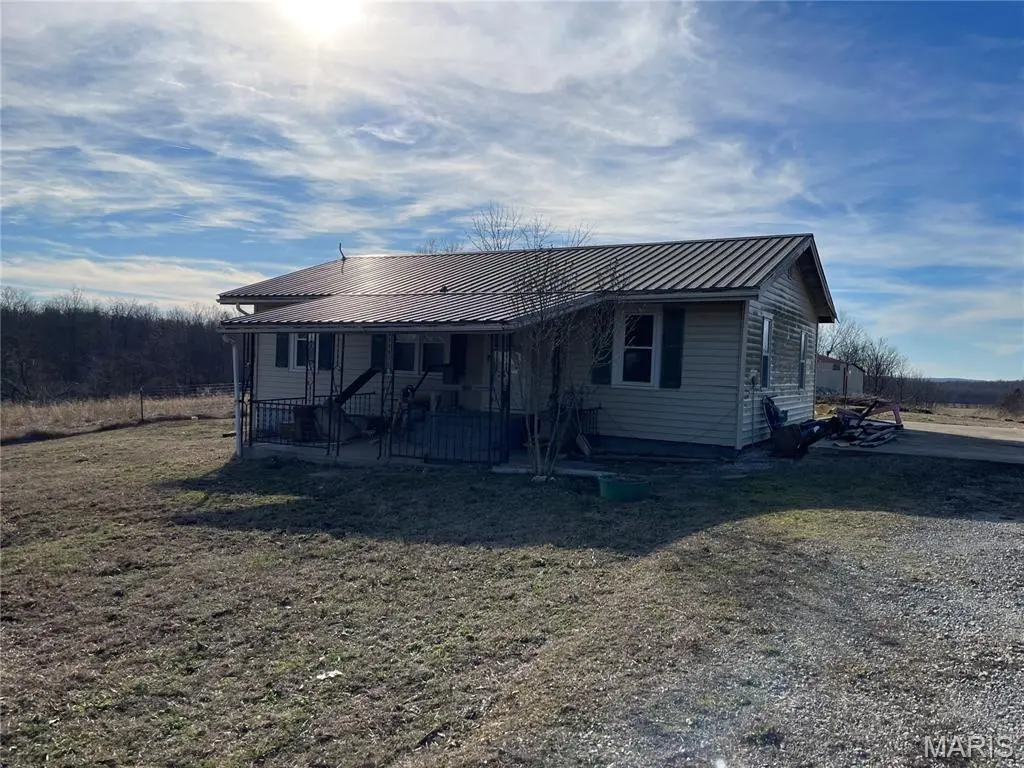
1369 Ripley 142e-16 · Doniphan, MO
Flood risk 1/10 · Minimal
- FEMA flood zone
- X (unshaded)
- Chance of flooding over 30 yrs
- 0.0%
- Est. flood insurance / yr
- $473 – $860
Fire risk 5/10 · Moderate
- Est. fire insurance / yr
- $1,054 – $1,958
Heat risk 5/10 · Moderate
- Hot days now (above 108°F)
- 7 days/yr
- Hot days in 30 yrs
- 21 days/yr
Wind risk 3/10 · Minor
- Chance of severe wind over 30 yrs
- 5.0%
Air-quality risk 1/10 · Minimal
- Unhealthy air days now
- 0 days/yr
- Unhealthy air days in 30 yrs
- 0 days/yr
Risk factors via First Street. Map © Google.
Why this score? — see what drove the C+ grade
The composite is a weighted blend of 9 inputs, each scored 0–100. Each bar is that input's sub-score; the figure is the points it added to the 100-point composite (weight × sub-score).
- Cash flow +23.8/30.0
- DSCR +7.7/10.0
- Appreciation +7.6/10.0
- ARV discount +7.5/15.0
- 1% rule +5.0/10.0
- Livability +3.0/5.0
- Schools +2.7/10.0
- Rent growth +2.5/5.0
- Condition / age +2.5/5.0
$89,900
🖨 Deal sheet 📄 Offer letter ✓ Due diligence
Listing remarks MLS
Nice location and house with lots of potential. Vinyl sided home with covered front porch, some yard fencing, large concrete pad, perfect for your new garage or shop building and storage shed. House is in the process of being remodeled. Includes open living room, kitchen and dining area, 3-bedrooms and combo laundry room and full bath. Great starter home, rental or project house.
Key facts
- 0.49 acre lot
- Built 1969
- Listed 48 days
Neighborhood map
What this means for you Summary
Snapshot
- This is a 3-bed/1.0-bath other listed at $90k.
Deal economics
- At list price, monthly cash flow is $173 ($2k/yr) — positive.
- The deal already cash-flows at list — no discount required.
- To meet the 1% rule (rent ≥ 1% of price), the offer needs to be $90k (0.2% below list).
- Recommended offer: $87k (3.0% below list) — sets the bar for market timing.
- Cap rate 8.6% vs local median 2.6% in Doniphan — top-decile yield for the area; either an underpriced asset or a hidden risk that comps aren't pricing in. Stress-test before assuming the spread holds.
Location & tenants
- Location reads 59/100 on livability (#568 in MO) — a working-class tenant base; expect higher turnover. Strengths: cost of living A+, housing A-; Watch: health & safety C-, schools D+, amenities F.
- Doniphan R-I (rural): math 27% / reading 39% proficiency, ranked #254 of 324 in MO (top 78%) — families likely to look elsewhere, expect single-tenant / working-renter base with shorter leases; 63% free/reduced lunch — lower-income household profile, screen leases tightly.
- Market conditions: 127 active listings in the ZIP.
Forward outlook
- In year one you build about $5k of equity ($622 loan paydown + $5k appreciation (5.1% local appreciation)).
- Ripley County population projected at -20% by 2050 — secular population decline; favor cash flow + early exit over multi-decade hold.
- At projected returns (5.1% appreciation + 3.0% rent growth), your $25k cash investment doubles in ~4 years — after that, you're playing with house money.
- By year 7, paydown + projected appreciation supports a ~$34k cash-out refi (75% LTV) — recoverable capital for the next deal without selling this one.
Negotiation context
- It's been on market 48 days — a 3% lower offer ($87k) is reasonable based on typical stale-listing flexibility.
Risks & watch-outs
- Climate carrying-cost: moderate wildfire risk; extreme-heat days projected 7→21/yr by 2055 (HVAC capex compounding) — expect insurance premiums to compound above CPI over the hold.
Questions for the listing agent
- It's been on market 48 days. Have you received any prior offers? Is the seller open to a 3% concession, seller financing, or rate buy-down credit?
- Built in 1969 — when were the roof, HVAC, electrical panel, plumbing, and water heater last replaced?
- Is there a deadline driving the sale (1031 exchange, divorce, estate, relocation)? That informs how much negotiation room exists.
- Schools are D-rated, which usually means shorter tenancies and higher turnover. Who's the typical renter profile here, and what's been the actual vacancy rate?
- What's the average days-on-market for RENTAL listings here right now (not sales)? A rising rental-DOM trend means longer vacancies and softer asking-rent achievability than the comps imply.
- What's the recent tenant-quality profile in this submarket — average credit score on applications, eviction rate, late-payment / NSF rate, and stable-employment percentage? A property-management company in the area should have these aggregated.
- How much new for-sale + rental construction is in the pipeline within 1–3 miles? Heavy new supply typically softens prices + rents 12–24 months out; constrained supply supports both.
Investment metrics
- 1% rule
- 1.00% ✗
- Cap rate
- 8.60%
- Cash-on-cash
- 8.24%
- DSCR
- 1.37
- GRM
- 8.4
CMA / ARV
No comps found within radius.
Projected returns pro-forma
5.14% appreciation · 3.0% rent growth · sell at horizon
- IRR
- 20.2%
- Equity multiple
- 2.29×
- Total profit
- $32,411
- Equity at exit
- $51,709
- IRR
- 19.9%
- Equity multiple
- 4.50×
- Total profit
- $88,071
- Equity at exit
- $89,882
Cash invested: $25,172 (down + closing). Projections, not guarantees.
Landlord ↔ Tenant lean methodology
- Overall (STATE)
- 81 Strongly Landlord-Friendly
- State Missouri
- 81 Strongly Landlord-Friendly · R+10
- County
- — inherits STATE
- City
- — inherits STATE
ZIP-level market 63935
- Home prices YoY
- 4.4%
- Active inventory
- 127
- Price-to-rent
- 8.4×
Monthly cashflow live
- Estimated rent
- $897 medium interval (Pro) →
- Mortgage (P&I)
- −$471
- Tax from tax record
- −$27 /mo · $322/yr
- Insurance
- −$37
- HOA
- −$0
- Vacancy / Maint / Mgmt
- −$188
- Net cashflow
- $173
Break-even live
UW: 25.0% down · 7.5% · 30yr · 1.5% tax · 5.0% vac · 8.0% maint · 8.0% mgmt
Financing live
Cash to close
- Down payment
- $22,475
- Closing costs
- $2,697
- Reserves months
- —
- Total cash needed
- —
Loan-product check · same deal, 3 products live
Conventional
25% down · 7.5% · 30yr
- Down + closing
- —
- Monthly P&I
- —
- Monthly cashflow
- —
- DSCR
- —
- Eligible?
- —
Personal DTI + credit; lowest rate.
DSCR
20% down · 8.5% · 30yr
- Down + closing
- —
- Monthly P&I
- —
- Monthly cashflow
- —
- DSCR
- —
- Eligible?
- —
No personal income docs; deal must DSCR.
Hard money
10% down · 12.0% · 12mo
- Down + closing
- —
- Monthly P&I
- —
- Monthly cashflow
- —
- DSCR
- —
- Eligible?
- —
Short-term bridge; refi at stabilization.
Listing history 3 events
-
2026-04-02$89,900 Active 382-char remark
Show marketing remark (382 chars)
Nice location and house with lots of potential. Vinyl sided home with covered front porch, some yard fencing, large concrete pad, perfect for your new garage or shop building and storage shed. House is in the process of being remodeled. Includes open living room, kitchen and dining area, 3-bedrooms and combo laundry room and full bath. Great starter home, rental or project house.
-
2014-05-22soldstatus
-
2013-11-01soldstatus
ⓘ Source: listings_history table (triggers on properties + properties_extension) + one-shot
backfill from property_details.listing_events for pre-trigger history.
Tax reassessment forecast MO · Resets to sale price
- Current annual tax
- $322 · $27/mo
- Projected year-2 tax
- $872 · $73/mo
- Expected delta
- +$550/yr (+$46/mo · 171.0%)
ⓘ Screening estimate from a state-policy table — verify with the county assessor before closing.
Climate risk First Street
- Flood 1/10 Low FEMA zone X (unshaded) · 0% chance over 30 yrs
- Wildfire 5/10 Major
- Heat 5/10 Major 7 d/yr ≥108°F today · 21 d/yr by 30 yrs out
- Wind 3/10 Moderate 5% chance of damaging wind over 30 yrs
- Air quality 1/10 Low 0 unhealthy d/yr today · 0 by 30 yrs out
Nearby sold comps map
Loading sold comps map…
Walkable amenities ~0.75 mi
Loading nearby amenities…
Taxation est. · year 1
- Rental income
- $10,764
- − Mortgage interest
- −$5,036
- − Property taxes
- −$322
- − Insurance
- −$450
- − Repairs & maintenance
- −$861
- − Management
- −$861
- − Depreciation
- −$2,615
- Taxable income
- $619
- Est. tax owed @ 24.0%
- −$149
- After-tax cash flow
- $1,926/yr
For passive investors: Depreciation is non-cash, so a rental often shows a tax loss while cash-flowing — sheltering income. Rental losses are passive: they offset passive income freely, and up to $25,000/yr can offset ordinary (W-2) income if you actively participate and your MAGI is under $100k (phasing out to $0 by $150k); unused losses carry forward. On sale, claimed depreciation is recaptured at up to 25%, and gains may owe capital-gains tax (a 1031 exchange can defer both). Figures are a year-1 estimate at your 24.0% rate — not tax advice; consult a CPA.
Schools (NCES district)
- District
- Doniphan R-I
- NCES district ID
- 2910920
- Math proficiency
- 27% ▼ -3.00%
- Reading proficiency
- 39% ▼ -1.00%
- Median HH income
- $31,818
- Composite
- 26.91/100
- National rank
- #7085
- State rank
- #254 of 324 in MO
Livability — Doniphan
- Score
- 59/100
- State rank
- #568
- US rank
- #20561
Category grades
Schools grade is shown separately in the Schools card above.
Census & demographics
- Population (ZIP)
- 8,017
Population outlook (Ripley County) Hauer SSP2
- Today (2025)
- 13,011 people
- By 2030
- 12,515 · -3.8%
- By 2040
- 11,512 · -11.5%
- By 2050
- 10,427 · -19.9%
- By 2075
- 7,833 · -39.8%
- By 2100
- 5,692 · -56.3%
Race, ethnicity, and origin ACS 2023
- Neighborhood character
- Predominantly White (93%)
- Race & ethnicity
- White 93% Two or more races 5% Hispanic / Latino 1%
- Common ancestry
- Romanian 3% Slovak 3% Serbian 2%
- Foreign-born
- 1% · Canada
Political lean MEDSL · Ripley
- 2024 margin
- Solid R (+73.0) · D 13.2% · R 86.2%
- 2008→2024 swing
- -43.0pp toward R · 2008: -30.1pp · 2024: -73.0pp
- All cycles
- 2024: R+73.0 2020: R+70.1 2016: R+66.9 2012: R+44.6 2008: R+30.1
Not yet ingested
- Civics
- —
Market trends
- HPI YoY
- ▲ 5.14%
- Current HPI
- 122.3339
- Rent YoY
- —
- Metro
- —
- State GDP YoY
- ▲ 1.84%
- F500 in state
- 20
Industry mix (Fortune 500 HQ in MO)
| Industry | F500 HQs | Revenue |
|---|---|---|
| Healthcare | 1 | $163B |
|
||
| Insurance | 1 | $21B |
|
||
| Industrial Technology | 1 | $17B |
|
||
| Retail | 1 | $16B |
|
||
| Industrial Distribution | 1 | $10B |
|
||
| Utilities | 1 | $9B |
|
||
Price history
3 events — show timeline
- 2026-04-02 Listed $89,900 MARIS as Distributed by MLS Grid
- 2014-05-22 Sold (Public Records) — Public Records
- 2013-11-01 Sold (Public Records) — Public Records
Property tax history
+2.2%/yrLatest (2025): $322 · +3.1% YoY. Source: county tax records.
Cash-flow waterfall
monthlySold comps — $/sqft
last 12 mo · ≤1 miLoading sold comps…