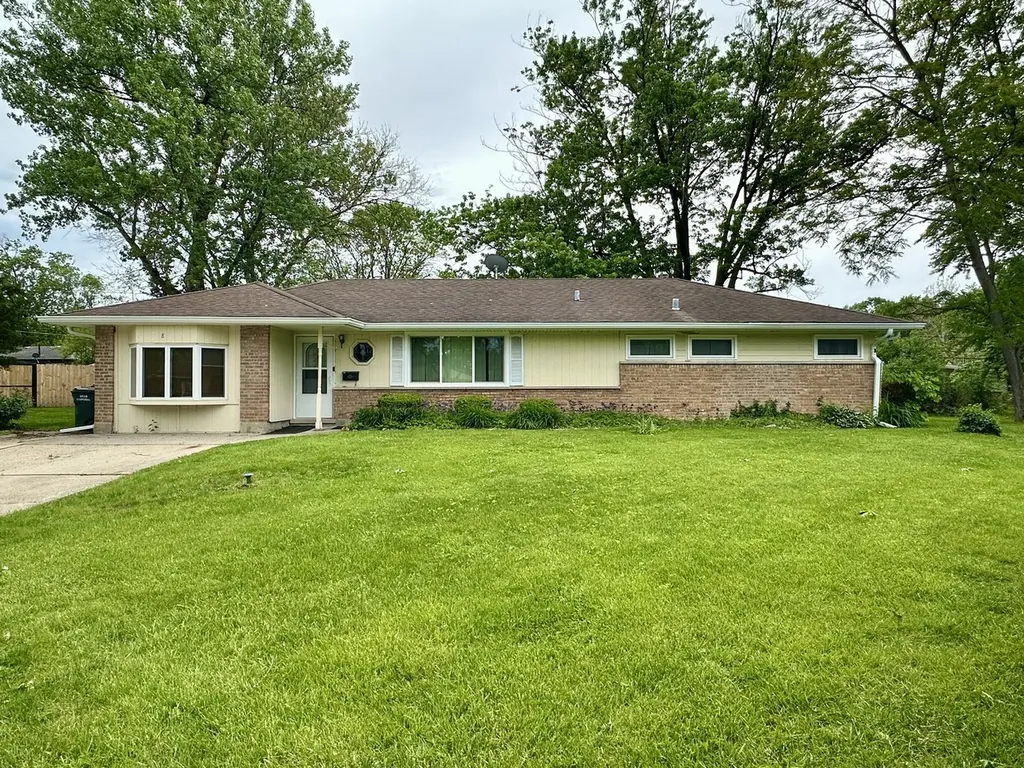
8 Waverly Ct · Park Forest, IL
Flood risk 1/10 · Minimal
- FEMA flood zone
- X (unshaded)
- Chance of flooding over 30 yrs
- 0.0%
- Est. flood insurance / yr
- $473 – $860
Fire risk 1/10 · Minimal
- Est. fire insurance / yr
- $804 – $1,492
Heat risk 3/10 · Minor
- Hot days now (above 101°F)
- 7 days/yr
- Hot days in 30 yrs
- 16 days/yr
Wind risk 2/10 · Minimal
- Chance of severe wind over 30 yrs
- —
Air-quality risk 2/10 · Minimal
- Unhealthy air days now
- 1 days/yr
- Unhealthy air days in 30 yrs
- 1 days/yr
Risk factors via First Street. Map © Google.
Why this score? — see what drove the C+ grade
The composite is a weighted blend of 9 inputs, each scored 0–100. Each bar is that input's sub-score; the figure is the points it added to the 100-point composite (weight × sub-score).
- Cash flow +23.5/30.0
- ARV discount +15.0/15.0
- 1% rule +8.2/10.0
- DSCR +7.6/10.0
- Livability +3.9/5.0
- Rent growth +2.5/5.0
- Condition / age +2.5/5.0
- Schools +0.9/10.0
- Appreciation +0.0/10.0
$169,900
🖨 Deal sheet 📄 Offer letter ✓ Due diligence
Listing remarks
This well-maintained 4-bedroom, 1.5-bath ranch home offers a functional layout with plenty of room for everyday living. The home features an eat-in kitchen, a separate dining room, and both a living room and family room, providing flexible spaces for relaxing and entertaining. A screened porch extends the living area outdoors and offers the perfect spot to enjoy morning coffee or unwind in the evening. With 1,645 square feet of comfortable living space, this home combines practicality and charm in a layout that fits a variety of lifestyles.
Key facts
- 0.29 acre lot
- 2 parking spots
- Built 1959
Property features AI
Finance
- Other: Commuter bus and commuter train access
- HOA & community: No master association fee required
Exterior
- Parking: Two owned parking spaces
- Utilities: Public water; Public sewer; Public power
- Home design: Detached single-family home; One-story layout; Owned fee simple; Built prior to 1978 (age approx. 61–70 years)
- Construction: Vinyl siding and brick construction
- Exterior features: Vinyl siding and brick exterior; Sidewalks and street lights; Paved street; Lot approximately 0.25–0.49 acre
Interior
- Kitchen: Range; Dishwasher; Refrigerator; Freezer; Eating area / table space
- Bedrooms: 4 bedrooms (all on main level); Master bedroom with half bath
- Flooring: Hardwood in living and dining areas; Carpet in bedrooms and family room; Linoleum in kitchen
- Bathrooms: 1 full bathroom; 1 half bathroom
- Heating & cooling: Natural gas forced air heating; Central air conditioning
- Interior features: Screened porch; Separate dining room; 8 total rooms; Wood-burning fireplace in family room
- Laundry & utility: Washer; Dryer; Dedicated laundry room
Neighborhood map
What this means for you Summary
Snapshot
- This is a 3-bed/1.5-bath single-family listed at $170k.
Deal economics
- At list price, monthly cash flow is $316 ($4k/yr) — positive.
- The deal already cash-flows at list — no discount required.
- Meets the 1% rule at list price ($2k rent vs $170k).
- Recommended offer: $167k (1.5% below list) — sets the bar for market timing.
Location & tenants
- Location reads 78/100 on livability (#148 in IL, #2,726 nationally) — a middle-class / working-renter tenant base. Strengths: commute A+, cost of living A+, housing A+; Watch: schools D+, amenities F.
- Rich Twp Hsd 227 (suburban): math 5% / reading 12% proficiency, ranked #577 of 620 in IL (top 93%) — low school quality limits family demand, transient renter base, plan for 1-2y turnover.
- Market conditions: 102 active listings in the ZIP; 18 comparable units currently listed for rent nearby; rentals at typical pace (median 22d on market — plan ~3-4 weeks tenant-placement turnaround); 6,272 units permitted in Cook County in 2024 (4,658 in 5+ unit buildings).
- This rent runs 44% of the median local income ($62k/yr) — at the standard rent-burdened threshold; future hikes will face affordability resistance.
Forward outlook
- Local home prices are declining (-3.0%/yr); year-one equity from $1k of loan paydown is wiped out by about $5k of value loss. Plan a longer hold.
Negotiation context
- It's been on market 15 days — a 2% lower offer ($167k) is reasonable based on typical stale-listing flexibility.
- Current owner paid $90k; list at $170k implies a 89% gain — meaningful room to come down on a strong offer.
Risks & watch-outs
- Watch-outs: property tax is 3.5% of price; built in 1959 — expect roof / HVAC / electrical / plumbing capex.
Questions for the listing agent
- Built in 1959 — when were the roof, HVAC, electrical panel, plumbing, and water heater last replaced?
- Property tax is high relative to price — has the assessment been appealed recently, and will the sale trigger a re-assessment?
- Is there a deadline driving the sale (1031 exchange, divorce, estate, relocation)? That informs how much negotiation room exists.
- Schools are D-rated, which usually means shorter tenancies and higher turnover. Who's the typical renter profile here, and what's been the actual vacancy rate?
- What's the average days-on-market for RENTAL listings here right now (not sales)? A rising rental-DOM trend means longer vacancies and softer asking-rent achievability than the comps imply.
- What's the recent tenant-quality profile in this submarket — average credit score on applications, eviction rate, late-payment / NSF rate, and stable-employment percentage? A property-management company in the area should have these aggregated.
- How much new for-sale + rental construction is in the pipeline within 1–3 miles? Heavy new supply typically softens prices + rents 12–24 months out; constrained supply supports both.
Investment metrics
- 1% rule
- 1.32% ✓
- Cap rate
- 8.53%
- Cash-on-cash
- 7.98%
- DSCR
- 1.36
- GRM
- 6.3
CMA / ARV
- ARV (on-the-fly)
- $203,980
- Comps found
- 12
Show comp detail 12 sales within ~0.75 mi
| Address | Dist | Beds/Ba | Sqft | Sold | Price | $/sf | Match |
|---|---|---|---|---|---|---|---|
| 351 Waverly St | 0.10mi | 3/2.0 | 1,671 (+2%) | 0mo | $149,000 | $89 | 91 |
| 340 Sauk Trl | 0.03mi | 3/2.0 | 1,576 (-4%) | 0mo | $180,000 | $114 | 89 |
| 289 Westwood Dr | 0.20mi | 3/1.5 | 1,664 (+1%) | 1mo | $95,102 | $57 | 88 |
| 4 Lakewood Ct | 0.13mi | 4/2.0 (+1) | 1,556 (-5%) | 2mo | $205,000 | $132 | 76 |
| 202 Wilson St | 0.27mi | 4/1.5 (+1) | 1,772 (+8%) | 1mo | $68,000 | $38 | 69 |
| 356 Waverly St | 0.15mi | 3/2.0 | 1,419 (-14%) | 2mo | $120,000 | $85 | 67 |
| 354 Westgate Dr | 0.33mi | 3/1.5 | 1,470 (-11%) | 2mo | $75,000 | $51 | 66 |
| 109 Wilson St | 0.46mi | 3/2.0 | 1,525 (-7%) | 1mo | $233,500 | $153 | 64 |
| 22646 Lawndale Ave | 0.62mi | 3/2.0 | 1,705 (+4%) | 3mo | $316,600 | $186 | 60 |
| 339 Blackhawk Dr | 0.30mi | 3/2.0 | 1,417 (-14%) | 1mo | $234,200 | $165 | 60 |
| 409 Winnemac St | 0.49mi | 4/2.0 (+1) | 1,736 (+6%) | 3mo | $229,900 | $132 | 59 |
| 287 Mohawk St | 0.37mi | 3/1.0 | 1,408 (-14%) | 1mo | $175,000 | $124 | 56 |
Match score weights: distance 35% · size 25% · config 20% · recency 20%. Top-matched comps best support the ARV.
Projected returns pro-forma
-3.0% appreciation · 3.0% rent growth · sell at horizon
- IRR
- -4.0%
- Equity multiple
- 0.85×
- Total profit
- $-7,179
- Equity at exit
- $25,333
- IRR
- 5.8%
- Equity multiple
- 1.43×
- Total profit
- $20,522
- Equity at exit
- $14,690
Cash invested: $47,572 (down + closing). Projections, not guarantees.
Landlord ↔ Tenant lean methodology
- Overall (STATE)
- 43 Moderately Tenant-Leaning
- State Illinois
- 43 Moderately Tenant-Leaning · D+7
- County
- — inherits STATE
- City
- — inherits STATE
ZIP-level market 60466
- Home prices YoY
- -21.1%
- Active inventory
- 102
- Price-to-rent
- 6.3×
Monthly cashflow live
- Estimated rent
- $2,238 high interval (Pro) →
- Mortgage (P&I)
- −$891
- Tax from tax record
- −$490 /mo · $5,879/yr
- Insurance
- −$71
- HOA
- −$0
- Vacancy / Maint / Mgmt
- −$470
- Net cashflow
- $316
Break-even live
UW: 25.0% down · 7.5% · 30yr · 1.5% tax · 5.0% vac · 8.0% maint · 8.0% mgmt
Financing live
Cash to close
- Down payment
- $42,475
- Closing costs
- $5,097
- Reserves months
- —
- Total cash needed
- —
Loan-product check · same deal, 3 products live
Conventional
25% down · 7.5% · 30yr
- Down + closing
- —
- Monthly P&I
- —
- Monthly cashflow
- —
- DSCR
- —
- Eligible?
- —
Personal DTI + credit; lowest rate.
DSCR
20% down · 8.5% · 30yr
- Down + closing
- —
- Monthly P&I
- —
- Monthly cashflow
- —
- DSCR
- —
- Eligible?
- —
No personal income docs; deal must DSCR.
Hard money
10% down · 12.0% · 12mo
- Down + closing
- —
- Monthly P&I
- —
- Monthly cashflow
- —
- DSCR
- —
- Eligible?
- —
Short-term bridge; refi at stabilization.
Rent comps 18 comps
| Address | Beds | Baths | Sqft | Rent | $/sqft | DOM | Units | Dist |
|---|---|---|---|---|---|---|---|---|
| 400 Watseka St Park Forest, IL | 4.0 | 2.0 | 1161 | $2,161 | $1.86 | 15d | 1 | 0.44mi |
| 411 Huron St Park Forest, IL | 3.0 | 1.0 | 1092 | $2,300 | $2.11 | 24d | 1 | 0.78mi |
| 4014 Euclid Ln Richton Park, IL | 2.0 | 1.0 | 1100 | $2,100 | $1.91 | 7d | 1 | 0.78mi |
| 4014 Euclid Ln Richton Park, IL | 3.0 | 1.0 | 1100 | $2,100 | $1.91 | 12d | 1 | 0.78mi |
| 4014 Euclid Ln Richton Park, IL | 2.0 | 1.0 | 1100 | $2,100 | $1.91 | 21d | 1 | 0.78mi |
| 372 Oswego St Park Forest, IL | 4.0 | 1.0 | 1200 | $2,600 | $2.17 | 24d | 1 | 0.83mi |
| 111 Nashua St Park Forest, IL | 4.0 | 1.5 | 1500 | $2,500 | $1.67 | 24d | 1 | 1.04mi |
| 490 Shabbona Dr Park Forest, IL | 3.0 | 1.0 | 1300 | $1,895 | $1.46 | 2d | 1 | 1.06mi |
| 441 Talala St Park Forest, IL | 4.0 | 2.0 | 1740 | $2,500 | $1.44 | 24d | 1 | 1.09mi |
| 4200 Arlington Dr Richton Park, IL | 3.0 | 2.0 | 1595 | $2,061 | $1.29 | 19d | 1 | 1.11mi |
| 336 Oakwood St Park Forest, IL | 3.0 | 2.0 | 2083 | $2,800 | $1.34 | 10d | 1 | 1.16mi |
| 3838 216th Pl Matteson, IL | 2.0 | 2.0 | 1160 | $1,996 | $1.72 | 19d | 1 | 1.17mi |
| 3324 Western Ave Park Forest, IL | 1.0–3.0 | 1.0 | 1026 | $1,995 | $1.94 | 1d | 11 | 1.17mi |
| 19 Apple Ln Park Forest, IL | 3.0 | 1.0 | 1541 | $2,300 | $1.49 | 12d | 1 | 1.17mi |
| 194 Monee Rd Park Forest, IL | 3.0 | 1.0 | 1092 | $1,971 | $1.80 | 21d | 1 | 1.23mi |
| 235 Tampa St Park Forest, IL | 3.0 | 1.0 | 1092 | $2,000 | $1.83 | 24d | 1 | 1.25mi |
| 22015 E Churchill Dr Richton Park, IL | 4.0 | 2.0 | 1200 | $2,300 | $1.92 | 24d | 1 | 1.42mi |
| 3538 212th Pl Matteson, IL | 3.0 | 1.0 | 1209 | $2,000 | $1.65 | 24d | 1 | 1.46mi |
Listing history 9 events
-
2026-06-18days on market $169,900 Active 15 DOM
-
2026-06-17days on market $169,900 Active 14 DOM
-
2026-06-16days on market $169,900 Active 13 DOM
-
2026-06-15days on market $169,900 Active 12 DOM
-
2026-06-13days on market $169,900 Active 10 DOM
-
2026-06-09days on market $169,900 Active 6 DOM
-
2026-06-08days on market $169,900 Active 5 DOM
-
2026-06-07remarks 546-char remark
-
2026-06-07$169,900 Active 4 DOM
ⓘ Source: listings_history table (triggers on properties + properties_extension) + one-shot
backfill from property_details.listing_events for pre-trigger history.
Tax reassessment forecast IL · Partial reset (capped growth)
- Current annual tax
- $5,879 · $490/mo
- Projected year-2 tax
- $5,879 · $490/mo
- Expected delta
- $0/yr ($0/mo · 0.0%)
ⓘ Screening estimate from a state-policy table — verify with the county assessor before closing.
Climate risk First Street
- Flood 1/10 Low FEMA zone X (unshaded) · 0% chance over 30 yrs
- Wildfire 1/10 Low
- Heat 3/10 Moderate 7 d/yr ≥101°F today · 16 d/yr by 30 yrs out
- Wind 2/10 Low
- Air quality 2/10 Low 1 unhealthy d/yr today · 1 by 30 yrs out
Nearby sold comps map
Loading sold comps map…
Walkable amenities ~0.75 mi
Loading nearby amenities…
Taxation est. · year 1
- Rental income
- $26,856
- − Mortgage interest
- −$9,517
- − Property taxes
- −$5,879
- − Insurance
- −$850
- − Repairs & maintenance
- −$2,148
- − Management
- −$2,148
- − Depreciation
- −$4,943
- Taxable income
- $1,371
- Est. tax owed @ 24.0%
- −$329
- After-tax cash flow
- $3,467/yr
For passive investors: Depreciation is non-cash, so a rental often shows a tax loss while cash-flowing — sheltering income. Rental losses are passive: they offset passive income freely, and up to $25,000/yr can offset ordinary (W-2) income if you actively participate and your MAGI is under $100k (phasing out to $0 by $150k); unused losses carry forward. On sale, claimed depreciation is recaptured at up to 25%, and gains may owe capital-gains tax (a 1031 exchange can defer both). Figures are a year-1 estimate at your 24.0% rate — not tax advice; consult a CPA.
Schools (NCES district)
- District
- Rich Twp Hsd 227
- NCES district ID
- 1733420
- Math proficiency
- 5% ▼ -3.00%
- Reading proficiency
- 12% ▬ 0.00%
- Median HH income
- $56,056
- Composite
- 8.93/100
- National rank
- #9885
- State rank
- #577 of 620 in IL
Livability — Park Forest
- Score
- 78/100
- State rank
- #148
- US rank
- #2726
Category grades
Schools grade is shown separately in the Schools card above.
Census & demographics
- Census place
- Park Forest, IL
- County
- Cook County · 4,486,803 people
- City population
- 21,461
- Metro
- Chicago-Naperville-Elgin, IL-IN-WI
- Population (ZIP)
- 21,461
- Household income
- $61,654
- Rent vs Own
- Severe rent burden
- 900.0
Population outlook (Cook County) Hauer SSP2
- Today (2025)
- 5,347,519 people
- By 2030
- 5,357,703 · +0.2%
- By 2040
- 5,324,924 · -0.4%
- By 2050
- 5,230,762 · -2.2%
- By 2075
- 4,785,735 · -10.5%
- By 2100
- 4,188,836 · -21.7%
Race, ethnicity, and origin ACS 2023
- Neighborhood character
- Predominantly Black (69%)
- Race & ethnicity
- Black 69% White 19% Hispanic / Latino 9% Two or more races 3% Native American 1%
- Hispanic origin (detail)
- Mexican 8%
- Common ancestry
- Romanian 2% Iranian 1% Italian 1%
- Foreign-born
- 6% · Canada
- Languages at home
- 90% English-only · Spanish 7% French/Haitian/Cajun 1% Russian/Polish/Slavic 1%
Political lean MEDSL · Cook
- 2024 margin
- Solid D (+42.0) · D 70.4% · R 28.4% · Other 1.2%
- 2008→2024 swing
- -11.4pp toward R · 2008: 53.4pp · 2024: 42.0pp
- All cycles
- 2024: D+42.0 2020: D+50.3 2016: D+53.0 2012: D+49.4 2008: D+53.4
Not yet ingested
- Civics
- —
Market trends
- HPI YoY
- ▼ -58.87%
- Current HPI
- 219.9692
- Rent YoY
- —
- Metro
- Chicago-Naperville-Elgin, IL-IN-WI
- State GDP YoY
- ▲ 1.59%
- F500 in state
- 60
Industry mix (Fortune 500 HQ in IL)
| Industry | F500 HQs | Revenue |
|---|---|---|
| Insurance | 4 | $201B |
|
||
| Consumer Goods | 4 | $87B |
|
||
| Industrial Machinery | 3 | $64B |
|
||
| Healthcare | 2 | $55B |
|
||
| Retail / Pharmacy | 1 | $148B |
|
||
| Agriculture / Food | 1 | $86B |
|
||
Price history
1 event — show timeline
- 1997-11-07 Sold (Public Records) $90,000 Public Records
Property tax history
+2.7%/yrLatest (2023): $5,879 · +156.1% YoY. Source: county tax records.
Cash-flow waterfall
monthlySold comps — $/sqft
last 12 mo · ≤1 miLoading sold comps…